|
|
市場調査レポート
商品コード
1530025
建設用アンカーの市場規模、シェア、動向分析レポート:製品別、材料別、最終用途別、地域別、セグメント予測、2024年~2030年Construction Anchors Market Size, Share & Trends Analysis Report By Product (Hangers, Mechanical, Chemical), By Materials (Stainless Steel, Carbon Steel), By End Use (Residential, Commercial, Industrial), By Region, And Segment Forecasts, 2024 - 2030 |
||||||
|
|||||||
カスタマイズ可能
|
|||||||

| 建設用アンカーの市場規模、シェア、動向分析レポート:製品別、材料別、最終用途別、地域別、セグメント予測、2024年~2030年 |
|
出版日: 2024年07月31日
発行: Grand View Research
ページ情報: 英文 122 Pages
納期: 2~10営業日
|

全表示
- 概要
- 図表
- 目次
建設用アンカー市場の成長と動向:
Grand View Research, Inc.の最新レポートによると、世界の建設用アンカー市場規模は2030年までに39億米ドルに達する見込みです。
同市場は、2024~2030年にかけてCAGR 3.9%で成長すると予測されています。この成長は、構造要素を接続するための高度な建設用アンカーやファスナーに対する需要の急増に起因しています。さらに、革新的な新製品や手間のかからない設置技術の開拓が市場を大きく牽引しています。メカニカルアンカーは一般的に、柱、梁、設備、機械、その他の重量物などの構造要素を固定するために使用されます。
メカニカルアンカーは、主にスラブ、梁、柱などの主要構造コンクリートの締結に使用されます。トルク制御膨張式アンカーは、施工時間が短く、施工が容易であることから、最も一般的に使用されているメカニカルアンカーです。ケミカルアンカーは、母材にあらかじめ開けられた穴の中に、結合材と埋め込まれた金属部品で構成されています。建設業界における製品需要の高まりは、現在の建設問題や将来の革新的な構造設計に対処する必要性から生じています。現在、この問題には、コンクリート構造物における建設材料の耐久性に起因する、広範囲に及ぶインフラ崩壊が含まれます。
急速に拡大する建設業界が市場需要を牽引しています。建設セグメントにおける先進的な建築設計への注目の高まりは、予測期間中に革新的な建築物に対する潜在的な需要を生み出すと予測されます。中国やインドを含む新興諸国の経済発展は、予測期間中の市場成長を加速させると予測されます。
建築用アンカー業界の参入企業は、流通チャネル、サプライヤーネットワーク、または世界中にある営業所を通じて製品を販売しています。製品タイプは、コンクリートネジ、ラグシールド、ハンマーセットアンカー、プラスチックウォールプラグ、アンカーボルトなど、様々なタイプの建設用アンカーの生産に携わっています。メーカーはまた、ウェブサイトを作成したり、サードパーティのウェブサイトを通じて製品を販売したりして、他国でのプレゼンスを拡大しています。
穴の側面の大きさに対する膨張など、機械式アンカーの限界を克服する必要性は、世界の建設用アンカー業界における主要な課題です。この膨張は圧縮応力を引き起こすため、進化した応力に耐えられる十分な量の母材が必要となります。このポーズは、市場シェアを拡大するためにメーカーが今後の製品で克服しなければならない大きな課題です。
建設用アンカー市場レポートハイライト
- 製品の中では、機械セグメントが2023年の売上高で45.3%を占め、市場を独占しています。建設用アンカーが提供するメンテナンスの容易さとともに、高い耐久性と剛性が、世界中の建設業界における採用の急増につながっています。さらに、施工業者の技術不足の影響を受けにくく、コンクリート構造物に即座に装填できます。これらの要因により、今後数年間は商業施設や工業施設での消費が急増すると予想されています。
- ステンレス鋼製アンカーが業界を支配し、2023年には需要全体の53.0%を占めました。しかし、電柱、高速道路標識、重機、橋梁レールなどの用途では、耐食性と重量比強度が高い炭素鋼製アンカーの普及が進んでいるため、ステンレス鋼製アンカーは他のアンカーに比べて低い成長が見込まれています。しかし、ステンレス鋼製アンカーが提供する高い機械的強度が、予測期間中の着実な成長を促進する重要な要因になると予想されます。
- 2023年の世界市場は、商業ビルが市場全体の31.0%の売上シェアを占め、市場を牽引しました。建築用アンカーは、コンクリート、レンガ、ブロックの壁に物品を安全に吊り下げるための安全な取り付けシステムを提供する能力により、商業用途で広く使用されています。インド、メキシコ、ブラジル、インドネシアなどの新興経済諸国では商業セクターが盛んであり、建築資材の許認可に関して必要な規制支援があるため、予測期間中、商業用途におけるさまざまな建築用アンカーの需要を促進すると予想されます。
- アジア太平洋の建設用アンカー産業は、同地域の全体的な製品需要に対する前向きな展望により、予測期間中、収益ベースで最も速いCAGR 4.4%で成長すると予想されます。さらに、有利な貿易政策に支えられた多国籍ブランドの浸透が、アジア太平洋の建設セクターの成長に寄与しています。その結果、同地域全域でオフィススペース、工場、製造プラント、インフラ開発プロジェクトが増加し、建設用アンカーの需要を促進する可能性が高いです。
- 市場は多数のメーカーが存在するため競争が激しいです。著名なサプライヤーは、市場での優位性を維持するために、最適な運用コストの達成、生産設備の効率の最大化、リードタイムの短縮、製品の品質向上に注力しています。競合他社が直面する主要課題は、原材料価格の変動です。したがって、市場の主要参入企業間では、高度な後方と前方統合が観察される可能性が高いです。これにより、市場間の競争企業間の敵対関係はさらに激化し、新興参入企業が市場で存続することは難しくなると考えられます。
目次
第1章 調査手法と範囲
第2章 エグゼクティブサマリー
第3章 建設用アンカー市場の変数、動向、範囲
- 市場系統の展望
- 親市場の展望:工業用ファスナー市場
- 業界バリューチェーン分析
- 原材料の動向
- 販売チャネル分析
- 価格動向分析
- 技術概要
- 規制の枠組み
- アナリストの視点
- 市場力学
- 市場促進要因分析
- 市場抑制要因分析
- 業界の機会
- 業界の課題
- ビジネス環境ツール分析:建設用アンカー市場
- ポーターのファイブフォース分析
- SWOTによるPESTLE分析
- 市場混乱分析
第4章 建設用アンカー市場:製品、推定・動向分析
- 主要ポイント
- 製品変動分析と市場シェア、2023年と2030年
- 世界の建設用アンカー市場:製品別、2018~2030年
- ハンガー
- メカニカルアンカー
- 化学アンカー
- 釘打ちアンカー
- 壁アンカー
- その他
第5章 建設用アンカー市場:材料、推定・動向分析
- 主要ポイント
- 物質変動分析と市場シェア、2023年と2030年
- 世界の建設用アンカー市場:材料別、2018~2030年
- ステンレス鋼
- 炭素鋼
- その他
第6章 建設用アンカー市場:最終用途、推定・動向分析
- 主要ポイント
- 最終用途変動分析と市場シェア、2023年と2030年
- 世界の建設用アンカー市場:最終用途別、2018~2030年
- 住宅
- 商用
- 産業
- インフラストラクチャー
第7章 建設用アンカー市場:地域別、推定・動向分析
- 主要ポイント
- 地域別市場シェア分析、2023年と2030年
- 北米
- 北米の建設用アンカー市場推定・予測、2018~2030年
- 米国
- カナダ
- メキシコ
- 欧州
- 欧州の建設用アンカー市場の推定と予測、2018~2030年(100万米ドル)
- ドイツ
- 英国
- フランス
- イタリア
- スペイン
- 北欧地域
- アジア太平洋
- アジア太平洋の建設用アンカー市場の推定と予測、2018~2030年
- 中国
- インド
- 日本
- 韓国
- オーストラリア
- 中南米
- 中南米の建設用アンカー市場の推定と予測、2018~2030年
- ブラジル
- チリ
- アルゼンチン
- 中東・アフリカ
- 中東・アフリカの建設用アンカー市場の推定と予測、2018~2030年
- サウジアラビア
- アラブ首長国連邦
第8章 サプライヤー情報
- クラリッチマトリックス
- エンゲージメントモデル
- 交渉戦略
- 調達のベストプラクティス
- ベンダー選択基準
- 原材料サプライヤー一覧
- エンドユーザーリスト
第9章 競合情勢
- 主要市場参入企業による最近の動向と影響分析
- 主要企業/競合の分類
- 企業の市況分析
- 企業ヒートマップ分析
- 戦略マッピング
- 企業リスト
- Hilti Corporation
- Stanley Black &Decker, Inc.-DEWALT
- Illinois Tool Works, Inc.
- Wurth Group
- fischer fixings UK Ltd.
- Mechanical Plastics Corp.
- Cobra Anchors
- MKT Fastening, LLC
- SFS Group Fastening Technology Ltd.
- Friulsider SPA
- CEAS.
- Sika AG
- Koelner Rawlplug IP
- Guangdong Kin Long Hardware Products Co., Ltd.
List of Tables
- Table 1 Construction Anchors Market Estimates & Forecasts, By Hangers, 2018 - 2030 (USD Million)
- Table 2 Construction Anchors Market Estimates & Forecasts, By Mechanical Anchors, 2018 - 2030 (USD Million)
- Table 3 Mechanical Construction Anchors Market Estimates & Forecasts, By Cast-In Anchors, 2018 - 2030 (USD Million)
- Table 4 Mechanical Construction Anchors Market Estimates & Forecasts, By Post-Installed Anchors, 2018 - 2030 (USD Million)
- Table 5 Post-Installed Mechanical Construction Anchors Market Estimates & Forecasts, By Screw Anchors, 2018 - 2030 (USD Million)
- Table 6 Post-Installed Mechanical Construction Anchors Market Estimates & Forecasts, By Expansion Anchors, 2018 - 2030 (USD Million)
- Table 7 Post-Installed Mechanical Construction Anchors Market Estimates & Forecasts, By Undercut Anchors, 2018 - 2030 (USD Million)
- Table 8 Construction Anchors Market Estimates & Forecasts, By Chemical Anchors, 2018 - 2030 (USD Million)
- Table 9 Construction Anchors Market Estimates & Forecasts, By Nail-In Anchors, 2018 - 2030 (USD Million)
- Table 10 Construction Anchors Market Estimates & Forecasts, By Wall Anchors, 2018 - 2030 (USD Million)
- Table 11 Construction Anchors Market Estimates & Forecasts, By Other Anchors, 2018 - 2030 (USD Million)
- Table 12 Stainless Steel Construction Anchors Market Estimates & Forecasts, 2018 - 2030 (USD Million)
- Table 13 Carbon Steel Construction Anchors Market Estimates & Forecasts, 2018 - 2030 (USD Million)
- Table 14 Other Construction Anchors Market Estimates & Forecasts, 2018 - 2030 (USD Million)
- Table 15 Construction Anchor Market Estimates & Forecasts, For Residential, 2018 - 2030 (USD Million)
- Table 16 Construction Anchor Market Estimates & Forecasts, For Commercial, 2018 - 2030 (USD Million
- Table 17 Construction Anchor Market Estimates & Forecasts, For Industrial, 2018 - 2030 (USD Million
- Table 18 Construction Anchor Market Estimates & Forecasts, For Infrastructure, 2018 - 2030 (USD Million )
- Table 19 North America Construction Anchors Market Estimates and Forecasts, 2018 - 2030 (USD Million)
- Table 20 North America Construction Anchors Market Estimates & Forecasts, By Product, 2018 - 2030 (USD Million)
- Table 21 North America Construction Anchors Market Estimates & Forecasts, By Material, 2018 - 2030 (USD Million)
- Table 22 North America Construction Anchors Market Estimates & Forecasts, By End Use, 2018 - 2030 (USD Million)
- Table 23 U.S. Construction Anchors market estimates & forecasts, 2018 - 2030 (USD Million)
- Table 24 U.S. Construction Anchors Market Estimates & Forecasts, By Product, 2018 - 2030 (USD Million)
- Table 25 U.S. Construction Anchors Market Estimates & Forecasts, By Material, 2018 - 2030 (USD Million)
- Table 26 U.S. Construction Anchors Market Estimates & Forecasts, By End Use, 2018 - 2030 (USD Million)
- Table 27 Canada Construction Anchors Market Estimates & Forecasts, 2018 - 2030 (USD Million)
- Table 28 Canada Construction Anchors Market Estimates & Forecasts, By Product, 2018 - 2030 (USD Million)
- Table 29 Canada Construction Anchors Market Estimates & Forecasts, By Material, 2018 - 2030 (USD Million)
- Table 30 Canada Construction Anchors Market Estimates & Forecasts, By End Use, 2018 - 2030 (USD Million)
- Table 31 Mexico Construction Anchors Market Estimates & Forecasts, 2018 - 2030 (USD Million)
- Table 32 Mexico Construction Anchors Market Estimates & Forecasts, By Product, 2018 - 2030 (USD Million)
- Table 33 Mexico Construction Anchors Market Estimates & Forecasts, By Material, 2018 - 2030 (USD Million)
- Table 34 Mexico Construction Anchors Market Estimates & Forecasts, By End Use, 2018 - 2030 (USD Million)
- Table 35 Europe Construction Anchors Market Estimates & Forecasts, 2018 - 2030 (USD Million
- Table 36 Europe Construction Anchors Market Estimates & Forecasts, By Product, 2018 - 2030 (USD Million)
- Table 37 Europe Construction Anchors Market Estimates & Forecasts, By Material, 2018 - 2030 (USD Million)
- Table 38 Europe Construction Anchors Market Estimates & Forecasts, By End Use, 2018 - 2030 (USD Million)
- Table 39 Germany Construction Anchors Market Estimates & Forecasts, 2018 - 2030 (USD Million)
- Table 40 Germany Construction Anchors Market Estimates & Forecasts, By Product, 2018 - 2030 (USD Million)
- Table 41 Germany Construction Anchors Market Estimates & Forecasts, By Material, 2018 - 2030 (USD Million)
- Table 42 Germany Construction Anchors Market Estimates & Forecasts, By End Use, 2018 - 2030 (USD Million)
- Table 43 UK Construction Anchors Market Estimates & Forecasts, 2018 - 2030 (USD Million)
- Table 44 UK Construction Anchors Market Estimates & Forecasts, By Product, 2018 - 2030 (USD Million)
- Table 45 UK Construction Anchors Market Estimates & Forecasts, By Material, 2018 - 2030 (USD Million)
- Table 46 UK Construction Anchors Market Estimates & Forecasts, By End Use, 2018 - 2030 (USD Million)
- Table 47 France Construction Anchors Market Estimates & Forecasts, 2018 - 2030 (USD Million)
- Table 48 France Construction Anchors Market Estimates & Forecasts, By Product, 2018 - 2030 (USD Million)
- Table 49 France Construction Anchors Market Estimates & Forecasts, By Material, 2018 - 2030 (USD Million)
- Table 50 France Construction Anchors Market Estimates & Forecasts, By End Use, 2018 - 2030 (USD Million)
- Table 51 Italy Construction Anchors Market Estimates & Forecasts, 2018 - 2030 (USD Million)
- Table 52 Italy Construction Anchors Market Estimates & Forecasts, By Product, 2018 - 2030 (USD Million)
- Table 53 Italy Construction Anchors Market Estimates & Forecasts, By Material, 2018 - 2030 (USD Million)
- Table 54 Italy Construction Anchors Market Estimates & Forecasts, By End Use, 2018 - 2030 (USD Million)
- Table 55 Spain Construction Anchors Market Estimates & Forecasts, 2018 - 2030 (USD Million)
- Table 56 Spain Construction Anchors Market Estimates & Forecasts, By Product, 2018 - 2030 (USD Million)
- Table 57 Spain Construction Anchors Market Estimates & Forecasts, By Material, 2018 - 2030 (USD Million)
- Table 58 Spain Construction Anchors Market Estimates & Forecasts, By End Use, 2018 - 2030 (USD Million)
- Table 59 Nordic Region Construction Anchors Market Estimates & Forecasts, 2018 - 2030 (USD Million)
- Table 60 Nordic Region Construction Anchors Market Estimates & Forecasts, By Product, 2018 - 2030 (USD Million)
- Table 61 Nordic Region Construction Anchors Market Estimates & Forecasts, By Material, 2018 - 2030 (USD Million)
- Table 62 Nordic Region Construction Anchors Market Estimates & Forecasts, By End Use, 2018 - 2030 (USD Million)
- Table 63 Asia Pacific Construction Anchors Market Estimates & Forecasts, 2018 - 2030 (USD Million)
- Table 64 Asia Pacific Construction Anchors Market Estimates & Forecasts, By Product, 2018 - 2030 (USD Million)
- Table 65 Asia Pacific Construction Anchors Market Estimates & Forecasts, By Material, 2018 - 2030 (USD Million)
- Table 66 Asia Pacific Construction Anchors Market Estimates & Forecasts, By End Use, 2018 - 2030 (USD Million)
- Table 67 China Construction Anchors Market Estimates & Forecasts, 2018 - 2030 (USD Million)
- Table 68 China Construction Anchors Market Estimates & Forecasts, By Product, 2018 - 2030 (USD Million)
- Table 69 China Construction Anchors Market Estimates & Forecasts, By Material, 2018 - 2030 (USD Million)
- Table 70 China Construction Anchors Market Estimates & Forecasts, By End Use, 2018 - 2030 (USD Million)
- Table 71 India Construction Anchors Market Estimates & Forecasts, 2018 - 2030 (USD Million)
- Table 72 India Construction Anchors Market Estimates & Forecasts, By Product, 2018 - 2030 (USD Million)
- Table 73 India Construction Anchors Market Estimates & Forecasts, By Material, 2018 - 2030 (USD Million)
- Table 74 India Construction Anchors Market Estimates & Forecasts, By End Use, 2018 - 2030 (USD Million)
- Table 75 Japan Construction Anchors Market Estimates & Forecasts, 2018 - 2030 (USD Million)
- Table 76 Japan Construction Anchors Market Estimates & Forecasts, By Product, 2018 - 2030 (USD Million)
- Table 77 Japan Construction Anchors Market Estimates & Forecasts, By Material, 2018 - 2030 (USD Million)
- Table 78 Japan Construction Anchors Market Estimates & Forecasts, By End Use, 2018 - 2030 (USD Million)
- Table 79 South Korea Construction Anchors Market Estimates & Forecasts, 2018 - 2030 (USD Million)
- Table 80 South Korea Construction Anchors Market Estimates & Forecasts, By Product, 2018 - 2030 (USD Million)
- Table 81 South Korea Construction Anchors Market Estimates & Forecasts, By Material, 2018 - 2030 (USD Million)
- Table 82 South Korea Construction Anchors Market Estimates & Forecasts, By End Use, 2018 - 2030 (USD Million)
- Table 83 Australia Construction Anchors Market Estimates & Forecasts, 2018 - 2030 (USD Million)
- Table 84 Australia Construction Anchors Market Estimates & Forecasts, By Product, 2018 - 2030 (USD Million)
- Table 85 Australia Construction Anchors Market Estimates & Forecasts, By Material, 2018 - 2030 (USD Million)
- Table 86 Australia Construction Anchors Market Estimates & Forecasts, By End Use, 2018 - 2030 (USD Million)
- Table 87 Central & South America Construction Anchors Market Estimates & Forecasts, 2018 - 2030 (USD Million)
- Table 88 Central & South America Construction Anchors Market Estimates & Forecasts, By Product, 2018 - 2030 (USD Million)
- Table 89 Central & South America Construction Anchors Market Estimates & Forecasts, By Material, 2018 - 2030 (USD Million)
- Table 90 Central & South America Construction Anchors Market Estimates & Forecasts, By End Use, 2018 - 2030 (USD Million)
- Table 91 Brazil Construction Anchors Market Estimates & Forecasts, 2018 - 2030 (USD Million)
- Table 92 Brazil Construction Anchors Market Estimates & Forecasts, By Product, 2018 - 2030 (USD Million)
- Table 93 Brazil Construction Anchors Market Estimates & Forecasts, By Material, 2018 - 2030 (USD Million)
- Table 94 Brazil Construction Anchors Market Estimates & Forecasts, By End Use, 2018 - 2030 (USD Million)
- Table 95 Chile Construction Anchors Market Estimates & Forecasts, 2018 - 2030 (USD Million)
- Table 96 Chile Construction Anchors Market Estimates & Forecasts, By Product, 2018 - 2030 (USD Million)
- Table 97 Chile Construction Anchors Market Estimates & Forecasts, By Material, 2018 - 2030 (USD Million)
- Table 98 Chile Construction Anchors Market Estimates & Forecasts, By End Use, 2018 - 2030 (USD Million)
- Table 99 Argentina Construction Anchors Market Estimates & Forecasts, 2018 - 2030 (USD Million)
- Table 100 Argentina Construction Anchors Market Estimates & Forecasts, By Product, 2018 - 2030 (USD Million)
- Table 101 Argentina Construction Anchors Market Estimates & Forecasts, By Material, 2018 - 2030 (USD Million)
- Table 102 Argentina Construction Anchors Market Estimates & Forecasts, By End Use, 2018 - 2030 (USD Million)
- Table 103 Middle East & Africa Construction Anchors Market Estimates & Forecasts, 2018 - 2030 (USD Million)
- Table 104 Middle East & Africa Construction Anchors Market Estimates & Forecasts, By Product, 2018 - 2030 (USD Million)
- Table 105 Middle East & Africa Construction Anchors Market Estimates & Forecasts, By Material, 2018 - 2030 (USD Million)
- Table 106 Middle East & Africa Construction Anchors Market Estimates & Forecasts, By End Use, 2018 - 2030 (USD Million)
- Table 107 Saudi Arabia Construction Anchors Market Estimates & Forecasts, 2018 - 2030 (USD Million)
- Table 108 Saudi Arabia Construction Anchors Market Estimates & Forecasts, By Product, 2018 - 2030 (USD Million)
- Table 109 Saudi Arabia Construction Anchors Market Estimates & Forecasts, By Material, 2018 - 2030 (USD Million)
- Table 110 Saudi Arabia Construction Anchors Market Estimates & Forecasts, By End Use, 2018 - 2030 (USD Million)
- Table 111 UAE Construction Anchors Market Estimates & Forecasts, 2018 - 2030 (USD Million)
- Table 112 UAE Construction Anchors Market Estimates & Forecasts, By Product, 2018 - 2030 (USD Million)
- Table 113 UAE Construction Anchors Market Estimates & Forecasts, By Material, 2018 - 2030 (USD Million)
- Table 114 UAE Construction Anchors Market Estimates & Forecasts, By End Use, 2018 - 2030 (USD Million)
List of Figures
- Fig. 1 Information Procurement
- Fig. 2 Primary Research Pattern
- Fig. 3 Primary Research Process
- Fig. 4 Market Research Approaches - Bottom-Up Approach
- Fig. 5 Market Research Approaches - Top-Down Approach
- Fig. 6 Market Research Approaches - Combined Approach
- Fig. 7 Market Snapshot
- Fig. 8 Segmental Outlook
- Fig. 9 Competitive Outlook
- Fig. 10 Construction Anchors Market - Global Industrial Fasteners Market
- Fig. 11 Construction Anchors Market - Value Chain Analysis
- Fig. 12 U.S. Stainless Steel Price Trend, 2019 - 2023 (USD/Ton)
- Fig. 13 Market Dynamics
- Fig. 14 Market Driver Impact Analysis
- Fig. 15 Construction Value Added By Key Countries, 2018 - 2023 (Million Square Meters) (USD Million)
- Fig. 16 U.S. Construction Industry Spending, 2018 - 2023 (USD Million)
- Fig. 17 Market Restraint Impact Analysis
- Fig. 18 Industry Analysis: Porter's
- Fig. 19 PESTEL Analysis, By SWOT
- Fig. 20 Product: Key Takeaway
- Fig. 21 Product: Market Share, 2023 & 2030
- Fig. 22 Material: Key Takeaways
- Fig. 23 Material: Market Share, 2023 & 2030
- Fig. 24 End Use: Key Takeaways
- Fig. 25 End Use: Market Share, 2023 & 2030
- Fig. 26 Region, 2023 & 2030 (USD Million)
- Fig. 27 Regional Marketplace: Key Takeaways
- Fig. 28 Kraljic Matrix
- Fig. 29 Engagement Model
- Fig. 30 Sourcing Best Practices
- Fig. 31 Vendor Selection Criteria
- Fig. 32 Competition Categorization
- Fig. 33 Company Market Positioning
- Fig. 34 Strategy Mapping, 2023
Construction Anchors Market Growth & Trends:
The global construction anchors market size is expected to reach USD 3.90 billion by 2030, according to a new report by Grand View Research, Inc. The market is projected to grow at a CAGR of 3.9% from 2024 to 2030 This growth can be attributed to the surging demand for advanced construction anchors and fasteners for connecting structural elements. Moreover, the development of new and innovative products and hassle-free installation techniques has considerably driven the market. They are commonly used to fasten structural elements such as columns, beams, equipment, machinery, and other heavy loads.
Mechanical anchors are majorly used for fastening elements of main structural concrete such as slabs, beams, and columns. Torque-controlled expansion anchors are the most commonly used mechanical anchors owing to their quick installation time and easy application. Chemical anchors consist of bonding material and an embedded metal part placed in a pre-drilled hole in the base material. The growing demand for products in the construction industry arises from the need to address current construction problems as well as future innovative structural designs. Presently, the problems include widespread infrastructural decay, which is attributed to the durability of construction materials in concrete structures.
The rapidly expanding construction industry is driving market demand. The increasing focus on advanced architectural design in the construction sector is projected to create potential demand for innovative buildings over the forecast period. The economic development across rapidly developing countries, including China and India, is projected to accelerate market growth over the forecast period.
The players in the construction anchors industry sell their products through a distribution channel, their supplier network, or through sales offices present around the world. The manufacturers are involved in the production of various types of construction anchors, such as concrete screws, lag shields, hammer-set anchors, plastic wall plugs, and anchor bolts. The manufacturers also create their websites or sell their products through third-party websites to expand their presence in other countries.
The need to overcome the limitations of mechanical anchor, such as its expansion against the size of the sides of the hole, is a major challenge in the global construction anchor industry. This expansion induces compression stress, which requires a sufficient amount of base material that can withstand the evolved stress. This pose is a major challenge that needs to be overcome in the upcoming products by the manufacturers to grow their market share.
Construction Anchors Market Report Highlights:
- Among products, the mechanical segment dominated the market with 45.3% in terms of revenue in 2023. High durability and rigidity, along with ease of maintenance offered by construction anchors, lead to their surged adoption in the construction industry around the world. Moreover, they are less sensitive to poor installer techniques and can be loaded immediately into the concrete structures. These factors are also anticipated to surge their consumption in commercial and industrial establishments in the coming years.
- Stainless steel anchors dominated the industry and accounted for 53.0% of the overall demand in 2023. However, stainless steel is expected to witness lower growth as compared to its counterpart owing to the increasing penetration of carbon steel anchors in applications such as light poles, highway signs, heavy equipment, and bridge rails on account of their high corrosion resistance and strength-to-weight ratio. However, the high mechanical strength offered by stainless steel anchors is expected to be an important factor triggering their steady growth over the forecast period.
- Commercial buildings led the global market in 2023 by accounting for a revenue share of 31.0% of the overall market. Construction anchors are widely used in commercial applications owing to their ability to provide a secure mounting system to safely hang items to concrete, brick, or block walls. The flourishing commercial sector in developing economies, such as India, Mexico, Brazil, and Indonesia, with required regulatory support in terms of permits for building materials, is expected to fuel the demand for different construction anchors in commercial applications over the forecast period.
- The Asia Pacific construction anchors industry is expected to grow at the fastest CAGR of 4.4% in terms of revenue over the forecast period, owing to a positive outlook toward the overall product demand in the region. Moreover, the penetration of multinational brands backed by favorable trade policies is contributing to the growth of the construction sector in Asia Pacific. The consequent rise of office spaces, factories, manufacturing plants, and infrastructural development projects across the region is likely to propel the demand for construction anchors.
- The market is highly competitive owing to the presence of a large number of manufacturers. Prominent suppliers are focusing on achieving optimal operational costs, maximizing the efficiency of production facilities, attaining shortened lead times, and enhancing the quality of products to maintain their dominance in the market. A major challenge faced by the competitors is the fluctuation of raw material prices; hence, a high degree of backward and forward integration is likely to be observed among the major players in the market. This will further intensify the market rivalry and competition, making it difficult for emerging players to sustain in the market.
Table of Contents
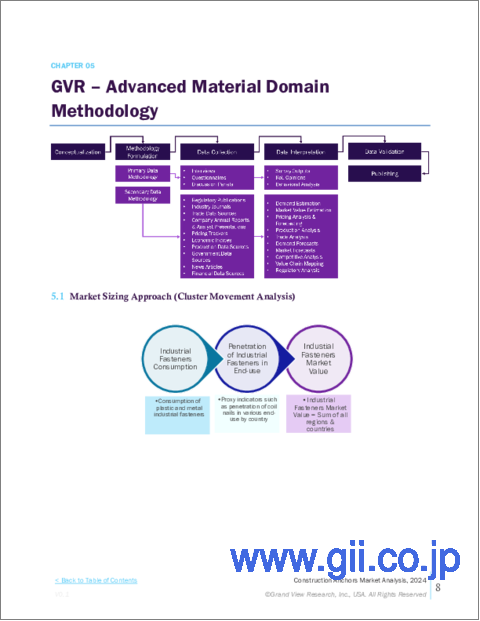
Chapter 1. Methodology and Scope
- 1.1. Research Methodology
- 1.2. Research Scope & Assumption
- 1.3. Information Procurement
- 1.3.1. Purchased Database
- 1.3.2. GVR's Internal Database
- 1.3.3. Secondary Sources & Third-Party Perspectives
- 1.3.4. Primary Research
- 1.4. Information Analysis
- 1.4.1. Data Analysis Models
- 1.5. Market Formulation & Data Visualization
- 1.6. List of Data Sources
Chapter 2. Executive Summary
- 2.1. Market Outlook, 2023 (USD Million)
- 2.2. Segmental Outlook
- 2.3. Competitive Insights
Chapter 3. Construction Anchors Market Variables, Trends & Scope
- 3.1. Market Lineage Outlook
- 3.1.1. Parent Market Outlook: Industrial Fasteners Market
- 3.2. Industry Value Chain Analysis
- 3.2.1. Raw material Trends
- 3.2.2. Sales Channel Analysis
- 3.2.3. Price Trend Analysis
- 3.3. Technological Overview
- 3.4. Regulatory Framework
- 3.4.1. Analyst Perspective
- 3.5. Market Dynamics
- 3.5.1. Market Driver Analysis
- 3.5.1.1. Positive Construction Industry Outlook
- 3.5.1.2. Rapidly Growing Demand for Mechanical Anchors
- 3.5.2. Market Restraint Analysis
- 3.5.2.1. Introduction of Other Bonding Materials
- 3.5.2.2. Fluctuating Cost of Raw Material
- 3.5.3. Industry Opportunities
- 3.5.4. Industry Challenges
- 3.5.1. Market Driver Analysis
- 3.6. Business Environmental Tools Analysis: Construction Anchors market
- 3.6.1. Porter's Five Forces Analysis
- 3.6.1.1. Bargaining Power of Suppliers
- 3.6.1.2. Bargaining Power of Buyers
- 3.6.1.3. Threat of Substitution
- 3.6.1.4. Threat of New Entrants
- 3.6.1.5. Competitive Rivalry
- 3.6.2. PESTLE Analysis, by SWOT
- 3.6.2.1. Political Landscape
- 3.6.2.2. Economic Landscape
- 3.6.2.3. Social Landscape
- 3.6.2.4. Technology Landscape
- 3.6.2.5. Environmental Landscape
- 3.6.2.6. Legal Landscape
- 3.6.1. Porter's Five Forces Analysis
- 3.7. Market Disruption Analysis
Chapter 4. Construction Anchors Market: Product Estimates & Trend Analysis
- 4.1. Key Takeaways
- 4.2. Product Movement Analysis & Market Share, 2023 & 2030
- 4.3. Global Construction Anchors Market By Product, 2018 - 2030 (USD Million)
- 4.4. Hangers
- 4.4.1. Construction Anchors Market Estimates & Forecasts, by Hangers, 2018 - 2030 (USD Million)
- 4.5. Mechanical Anchors
- 4.5.1. Mechanical Construction Anchors Market Estimates & Forecasts, by Mechanical Anchors, 2018 - 2030 (USD Million)
- 4.5.2. Cast-in Anchors
- 4.5.2.1. Mechanical Construction Anchors Market Estimates & Forecasts, by Cast-in Anchors, 2018 - 2030 (USD Million)
- 4.5.3. Post-installed Anchors
- 4.5.3.1. Mechanical Construction Anchors Market Estimates & Forecasts, by Post-installed Anchors, 2018 - 2030 (USD Million)
- 4.5.3.2. Screw
- 4.5.3.2.1. Post-installed Mechanical Construction Anchors Market Estimates & Forecasts, by Screws, 2018 - 2030 (USD Million)
- 4.5.3.3. Expansion
- 4.5.3.3.1. Post-installed Mechanical Construction Anchors Market Estimates & Forecasts, by Expansion, 2018 - 2030 (USD Million)
- 4.5.3.4. Undercut
- 4.5.3.4.1. Post-installed Mechanical Construction Anchors Market Estimates & Forecasts, by Post-installed Anchors, 2018 - 2030 (USD Million)
- 4.6. Chemical Anchors
- 4.6.1. Construction Anchors Market Estimates & Forecasts, by Chemical Anchors, 2018 - 2030 (USD Million)
- 4.7. Nail-In Anchors
- 4.7.1. Construction Anchors Market Estimates & Forecasts, by Nail-in Anchors, 2018 - 2030 (USD Million)
- 4.8. Wall Anchors
- 4.8.1. Construction Anchors Market Estimates & Forecasts, by Wall Anchors, 2018 - 2030 (USD Million)
- 4.9. Other Products
- 4.9.1. Construction Anchors Market Estimates & Forecasts, by Other Anchors, 2018 - 2030 (USD Million)
Chapter 5. Construction Anchors Market: Material Estimates & Trend Analysis
- 5.1. Key Takeaways
- 5.2. Material Movement Analysis & Market Share, 2023 & 2030
- 5.3. Global Construction Anchors Market By Material, 2018 - 2030 (USD Million)
- 5.4. Stainless Steel
- 5.4.1. Stainless Steel Construction Anchors Market Estimates and Forecasts, 2018 - 2030 (USD Million)
- 5.5. Carbon Steel
- 5.5.1. Carbon Steel Construction Anchors Market Estimates and Forecasts, 2018 - 2030 (USD Million)
- 5.6. Other Materials
- 5.6.1. Other Construction Anchors Market Estimates and Forecasts, 2018 - 2030 (USD Million)
Chapter 6. Construction Anchors Market: End Use Estimates & Trend Analysis
- 6.1. Key Takeaways
- 6.2. End Use Movement Analysis & Market Share, 2023 & 2030
- 6.3. Global Construction Anchors Market By End Use, 2018 - 2030 (USD Million)
- 6.4. Residential
- 6.4.1. Construction Anchors Market Estimates and Forecasts for Residential, 2018 - 2030 (USD Million)
- 6.5. Commercial
- 6.5.1. Construction Anchors Market Estimates and Forecasts for Commercial, 2018 - 2030 (USD Million)
- 6.6. Industrial
- 6.6.1. Construction Anchors Market Estimates and Forecasts for Industrial, 2018 - 2030 (USD Million)
- 6.7. Infrastructure
- 6.7.1. Construction Anchors Market Estimates and Forecasts for Infrastructure, 2018 - 2030 (USD Million)
Chapter 7. Construction Anchors Market: Regional Estimates & Trend Analysis
- 7.1. Key Takeaways
- 7.2. Regional Market Share Analysis, 2023 & 2030
- 7.3. North America
- 7.3.1. North America Construction Anchors Market Estimates and Forecasts, 2018 - 2030 (USD Million)
- 7.3.2. North America Construction Anchors Market Estimates & Forecasts, By Product, 2018 - 2030 (USD Million)
- 7.3.3. North America Construction Anchors Market Estimates & Forecasts, By Material, 2018 - 2030 (USD Million)
- 7.3.4. North America Construction Anchors Market Estimates & Forecasts, By End Use, 2018 - 2030 (USD Million)
- 7.3.5. U.S.
- 7.3.5.1. U.S. Construction Anchors market estimates & forecasts, 2018 - 2030 (USD Million)
- 7.3.5.2. U.S. Construction Anchors Market Estimates & Forecasts, By Product, 2018 - 2030 (USD Million)
- 7.3.5.3. U.S. Construction Anchors Market Estimates & Forecasts, By Material, 2018 - 2030 (USD Million)
- 7.3.5.4. U.S. Construction Anchors Market Estimates & Forecasts, By End Use, 2018 - 2030 (USD Million)
- 7.3.6. Canada
- 7.3.6.1. Canada Construction Anchors Market Estimates & Forecasts, 2018 - 2030 (USD Million)
- 7.3.6.2. Canada Construction Anchors Market Estimates & Forecasts, By Product, 2018 - 2030 (USD Million)
- 7.3.6.3. Canada Construction Anchors Market Estimates & Forecasts, By Material, 2018 - 2030 (USD Million)
- 7.3.6.4. Canada Construction Anchors Market Estimates & Forecasts, By End Use, 2018 - 2030 (USD Million)
- 7.3.7. Mexico
- 7.3.7.1. Mexico Construction Anchors Market Estimates & Forecasts, 2018 - 2030 (USD Million)
- 7.3.7.2. Mexico Construction Anchors Market Estimates & Forecasts, By Product, 2018 - 2030 (USD Million)
- 7.3.7.3. Mexico Construction Anchors Market Estimates & Forecasts, By Material, 2018 - 2030 (USD Million)
- 7.3.7.4. Mexico Construction Anchors Market Estimates & Forecasts, By End Use, 2018 - 2030 (USD Million)
- 7.4. Europe
- 7.4.1. Europe Construction Anchors Market Estimates & Forecasts, 2018 - 2030 (USD Million
- 7.4.2. Europe Construction Anchors Market Estimates & Forecasts, By Product, 2018 - 2030 (USD Million)
- 7.4.3. Europe Construction Anchors Market Estimates & Forecasts, By Material, 2018 - 2030 (USD Million)
- 7.4.4. Europe Construction Anchors Market Estimates & Forecasts, By End Use, 2018 - 2030 (USD Million)
- 7.4.5. Germany
- 7.4.5.1. Germany Construction Anchors Market Estimates & Forecasts, 2018 - 2030 (USD Million)
- 7.4.5.2. Germany Construction Anchors Market Estimates & Forecasts, By Product, 2018 - 2030 (USD Million)
- 7.4.5.3. Germany Construction Anchors Market Estimates & Forecasts, By Material, 2018 - 2030 (USD Million)
- 7.4.5.4. Germany Construction Anchors Market Estimates & Forecasts, By End Use, 2018 - 2030 (USD Million)
- 7.4.6. UK
- 7.4.6.1. UK Construction Anchors Market Estimates & Forecasts, 2018 - 2030 (USD Million)
- 7.4.6.2. UK Construction Anchors Market Estimates & Forecasts, By Product, 2018 - 2030 (USD Million)
- 7.4.6.3. UK Construction Anchors Market Estimates & Forecasts, By Material, 2018 - 2030 (USD Million)
- 7.4.6.4. UK Construction Anchors Market Estimates & Forecasts, By End Use, 2018 - 2030 (USD Million)
- 7.4.7. France
- 7.4.7.1. France Construction Anchors Market Estimates & Forecasts, 2018 - 2030 (USD Million)
- 7.4.7.2. France Construction Anchors Market Estimates & Forecasts, By Product, 2018 - 2030 (USD Million)
- 7.4.7.3. France Construction Anchors Market Estimates & Forecasts, By Material, 2018 - 2030 (USD Million)
- 7.4.7.4. France Construction Anchors Market Estimates & Forecasts, By End Use, 2018 - 2030 (USD Million)
- 7.4.8. Italy
- 7.4.8.1. Italy Construction Anchors Market Estimates & Forecasts, 2018 - 2030 (USD Million)
- 7.4.8.2. Italy Construction Anchors Market Estimates & Forecasts, By Product, 2018 - 2030 (USD Million)
- 7.4.8.3. Italy Construction Anchors Market Estimates & Forecasts, By Material, 2018 - 2030 (USD Million)
- 7.4.8.4. Italy Construction Anchors Market Estimates & Forecasts, By End Use, 2018 - 2030 (USD Million)
- 7.4.9. Spain
- 7.4.9.1. Spain Construction Anchors Market Estimates & Forecasts, 2018 - 2030 (USD Million)
- 7.4.9.2. Spain Construction Anchors Market Estimates & Forecasts, By Product, 2018 - 2030 (USD Million)
- 7.4.9.3. Spain Construction Anchors Market Estimates & Forecasts, By Material, 2018 - 2030 (USD Million)
- 7.4.9.4. Spain Construction Anchors Market Estimates & Forecasts, By End Use, 2018 - 2030 (USD Million)
- 7.4.10. Nordic Region
- 7.4.10.1. Nordic Region Construction Anchors Market Estimates & Forecasts, 2018 - 2030 (USD Million)
- 7.4.10.2. Nordic Region Construction Anchors Market Estimates & Forecasts, By Product, 2018 - 2030 (USD Million)
- 7.4.10.3. Nordic Region Construction Anchors Market Estimates & Forecasts, By Material, 2018 - 2030 (USD Million)
- 7.4.10.4. Nordic Region Construction Anchors Market Estimates & Forecasts, By End Use, 2018 - 2030 (USD Million)
- 7.5. Asia Pacific
- 7.5.1. Asia Pacific Construction Anchors Market Estimates & Forecasts, 2018 - 2030 (USD Million)
- 7.5.2. Asia Pacific Construction Anchors Market Estimates & Forecasts, By Product, 2018 - 2030 (USD Million)
- 7.5.3. Asia Pacific Construction Anchors Market Estimates & Forecasts, By Material, 2018 - 2030 (USD Million)
- 7.5.4. Asia Pacific Construction Anchors Market Estimates & Forecasts, By End Use, 2018 - 2030 (USD Million)
- 7.5.5. China
- 7.5.5.1. China Construction Anchors Market Estimates & Forecasts, 2018 - 2030 (USD Million)
- 7.5.5.2. China Construction Anchors Market Estimates & Forecasts, By Product, 2018 - 2030 (USD Million)
- 7.5.5.3. China Construction Anchors Market Estimates & Forecasts, By Material, 2018 - 2030 (USD Million)
- 7.5.5.4. China Construction Anchors Market Estimates & Forecasts, By End Use, 2018 - 2030 (USD Million)
- 7.5.6. India
- 7.5.6.1. India Construction Anchors Market Estimates & Forecasts, 2018 - 2030 (USD Million)
- 7.5.6.2. India Construction Anchors Market Estimates & Forecasts, By Product, 2018 - 2030 (USD Million)
- 7.5.6.3. India Construction Anchors Market Estimates & Forecasts, By Material, 2018 - 2030 (USD Million)
- 7.5.6.4. India Construction Anchors Market Estimates & Forecasts, By End Use, 2018 - 2030 (USD Million)
- 7.5.7. Japan
- 7.5.7.1. Japan Construction Anchors Market Estimates & Forecasts, 2018 - 2030 (USD Million)
- 7.5.7.2. Japan Construction Anchors Market Estimates & Forecasts, By Product, 2018 - 2030 (USD Million)
- 7.5.7.3. Japan Construction Anchors Market Estimates & Forecasts, By Material, 2018 - 2030 (USD Million)
- 7.5.7.4. Japan Construction Anchors Market Estimates & Forecasts, By End Use, 2018 - 2030 (USD Million)
- 7.5.8. South Korea
- 7.5.8.1. South Korea Construction Anchors Market Estimates & Forecasts, 2018 - 2030 (USD Million)
- 7.5.8.2. South Korea Construction Anchors Market Estimates & Forecasts, By Product, 2018 - 2030 (USD Million)
- 7.5.8.3. South Korea Construction Anchors Market Estimates & Forecasts, By Material, 2018 - 2030 (USD Million)
- 7.5.8.4. South Korea Construction Anchors Market Estimates & Forecasts, By End Use, 2018 - 2030 (USD Million)
- 7.5.9. Australia
- 7.5.9.1. Australia Construction Anchors Market Estimates & Forecasts, 2018 - 2030 (USD Million)
- 7.5.9.2. Australia Construction Anchors Market Estimates & Forecasts, By Product, 2018 - 2030 (USD Million)
- 7.5.9.3. Australia Construction Anchors Market Estimates & Forecasts, By Material, 2018 - 2030 (USD Million)
- 7.5.9.4. Australia Construction Anchors Market Estimates & Forecasts, By End Use, 2018 - 2030 (USD Million)
- 7.6. Central & South America
- 7.6.1. Central & South America Construction Anchors Market Estimates & Forecasts, 2018 - 2030 (USD Million)
- 7.6.2. Central & South America Construction Anchors Market Estimates & Forecasts, By Product, 2018 - 2030 (USD Million)
- 7.6.3. Central & South America Construction Anchors Market Estimates & Forecasts, By Material, 2018 - 2030 (USD Million)
- 7.6.4. Central & South America Construction Anchors Market Estimates & Forecasts, By End Use, 2018 - 2030 (USD Million)
- 7.6.5. Brazil
- 7.6.5.1. Brazil Construction Anchors Market Estimates & Forecasts, 2018 - 2030 (USD Million)
- 7.6.5.2. Brazil Construction Anchors Market Estimates & Forecasts, By Product, 2018 - 2030 (USD Million)
- 7.6.5.3. Brazil Construction Anchors Market Estimates & Forecasts, By Material, 2018 - 2030 (USD Million)
- 7.6.5.4. Brazil Construction Anchors Market Estimates & Forecasts, By End Use, 2018 - 2030 (USD Million)
- 7.6.6. Chile
- 7.6.6.1. Chile Construction Anchors Market Estimates & Forecasts, 2018 - 2030 (USD Million)
- 7.6.6.2. Chile Construction Anchors Market Estimates & Forecasts, By Product, 2018 - 2030 (USD Million)
- 7.6.6.3. Chile Construction Anchors Market Estimates & Forecasts, By Material, 2018 - 2030 (USD Million)
- 7.6.6.4. Chile Construction Anchors Market Estimates & Forecasts, By End Use, 2018 - 2030 (USD Million)
- 7.6.7. Argentina
- 7.6.7.1. Argentina Construction Anchors Market Estimates & Forecasts, 2018 - 2030 (USD Million)
- 7.6.7.2. Argentina Construction Anchors Market Estimates & Forecasts, By Product, 2018 - 2030 (USD Million)
- 7.6.7.3. Argentina Construction Anchors Market Estimates & Forecasts, By Material, 2018 - 2030 (USD Million)
- 7.6.7.4. Argentina Construction Anchors Market Estimates & Forecasts, By End Use, 2018 - 2030 (USD Million)
- 7.7. Middle East & Africa
- 7.7.1. Middle East & Africa Construction Anchors Market Estimates & Forecasts, 2018 - 2030 (USD Million)
- 7.7.2. Middle East & Africa Construction Anchors Market Estimates & Forecasts, By Product, 2018 - 2030 (USD Million)
- 7.7.3. Middle East & Africa Construction Anchors Market Estimates & Forecasts, By Material, 2018 - 2030 (USD Million)
- 7.7.4. Middle East & Africa Construction Anchors Market Estimates & Forecasts, By End Use, 2018 - 2030 (USD Million)
- 7.7.5. Saudi Arabia
- 7.7.5.1. Saudi Arabia Construction Anchors Market Estimates & Forecasts, 2018 - 2030 (USD Million)
- 7.7.5.2. Saudi Arabia Construction Anchors Market Estimates & Forecasts, By Product, 2018 - 2030 (USD Million)
- 7.7.5.3. Saudi Arabia Construction Anchors Market Estimates & Forecasts, By Material, 2018 - 2030 (USD Million)
- 7.7.5.4. Saudi Arabia Construction Anchors Market Estimates & Forecasts, By End Use, 2018 - 2030 (USD Million)
- 7.7.6. UAE
- 7.7.6.1. UAE Construction Anchors Market Estimates & Forecasts, 2018 - 2030 (USD Million)
- 7.7.6.2. UAE Construction Anchors Market Estimates & Forecasts, By Product, 2018 - 2030 (USD Million)
- 7.7.6.3. UAE Construction Anchors Market Estimates & Forecasts, By Material, 2018 - 2030 (USD Million)
- 7.7.6.4. UAE Construction Anchors Market Estimates & Forecasts, By End Use, 2018 - 2030 (USD Million)
Chapter 8. Supplier Intelligence
- 8.1. Kraljic Matrix
- 8.2. Engagement Model
- 8.3. Negotiation Strategies
- 8.4. Sourcing Best Practices
- 8.5. Vendor Selection Criteria
- 8.6. List of Raw Material Suppliers
- 8.7. List of End-Users
Chapter 9. Competitive Landscape
- 9.1. Recent Developments & Impact Analysis, By Key Market Participants
- 9.2. Key Company/Competition Categorization
- 9.3. Company Market Position Analysis
- 9.4. Company Heat Map Analysis
- 9.5. Strategy Mapping
- 9.6. Company Listing
- 9.6.1. Hilti Corporation
- 9.6.1.1. Company Overview
- 9.6.1.2. Financial Performance
- 9.6.1.3. Product Benchmarking
- 9.6.1.4. Strategic Initiatives
- 9.6.2. Stanley Black & Decker, Inc.- DEWALT
- 9.6.2.1. Company Overview
- 9.6.2.2. Financial Performance
- 9.6.2.3. Product Benchmarking
- 9.6.2.4. Strategic Initiatives
- 9.6.3. Illinois Tool Works, Inc.
- 9.6.3.1. Company Overview
- 9.6.3.2. Financial Performance
- 9.6.3.3. Product Benchmarking
- 9.6.3.4. Strategic Initiatives
- 9.6.4. Wurth Group
- 9.6.4.1. Company Overview
- 9.6.4.2. Financial Performance
- 9.6.4.3. Product Benchmarking
- 9.6.4.4. Strategic Initiatives
- 9.6.5. fischer fixings UK Ltd.
- 9.6.5.1. Company Overview
- 9.6.5.2. Financial Performance
- 9.6.5.3. Product Benchmarking
- 9.6.5.4. Strategic Initiatives
- 9.6.6. Mechanical Plastics Corp.
- 9.6.6.1. Company Overview
- 9.6.6.2. Financial Performance
- 9.6.6.3. Product Benchmarking
- 9.6.6.4. Strategic Initiatives
- 9.6.7. Cobra Anchors
- 9.6.7.1. Company Overview
- 9.6.7.2. Financial Performance
- 9.6.7.3. Product Benchmarking
- 9.6.7.4. Strategic Initiatives
- 9.6.8. MKT Fastening, LLC
- 9.6.8.1. Company Overview
- 9.6.8.2. Financial Performance
- 9.6.8.3. Product Benchmarking
- 9.6.8.4. Strategic Initiatives
- 9.6.9. SFS Group Fastening Technology Ltd.
- 9.6.9.1. Company Overview
- 9.6.9.2. Financial Performance
- 9.6.9.3. Product Benchmarking
- 9.6.9.4. Strategic Initiatives
- 9.6.10. Friulsider S.P.A.
- 9.6.10.1. Company Overview
- 9.6.10.2. Financial Performance
- 9.6.10.3. Product Benchmarking
- 9.6.10.4. Strategic Initiatives
- 9.6.11. CEAS.
- 9.6.11.1. Company Overview
- 9.6.11.2. Financial Performance
- 9.6.11.3. Product Benchmarking
- 9.6.11.4. Strategic Initiatives
- 9.6.12. Sika AG
- 9.6.12.1. Company Overview
- 9.6.12.2. Financial Performance
- 9.6.12.3. Product Benchmarking
- 9.6.12.4. Strategic Initiatives
- 9.6.13. Koelner Rawlplug IP
- 9.6.13.1. Company Overview
- 9.6.13.2. Financial Performance
- 9.6.13.3. Product Benchmarking
- 9.6.13.4. Strategic Initiatives
- 9.6.14. Guangdong Kin Long Hardware Products Co., Ltd.
- 9.6.14.1. Company Overview
- 9.6.14.2. Financial Performance
- 9.6.14.3. Product Benchmarking
- 9.6.14.4. Strategic Initiatives
- 9.6.1. Hilti Corporation

