|
|
市場調査レポート
商品コード
1363474
OT(Operational Technology)セキュリティ市場規模、シェア、動向分析レポート:コンポーネント別、展開別、企業規模別、業界別、地域別、セグメント予測、2023年~2030年Operational Technology Security Market Size, Share & Trends Analysis Report By Component (Software, Services), By Deployment (Cloud, On-Premises), By Enterprise Size, By Vertical, By Region And Segment Forecasts, 2023 - 2030 |
||||||
|
|
|||||||
カスタマイズ可能
|
|||||||


| OT(Operational Technology)セキュリティ市場規模、シェア、動向分析レポート:コンポーネント別、展開別、企業規模別、業界別、地域別、セグメント予測、2023年~2030年 |
|
出版日: 2023年09月14日
発行: Grand View Research
ページ情報: 英文 100 Pages
納期: 2~10営業日
|

- 全表示
- 概要
- 図表
- 目次
OT(Operational Technology)セキュリティ市場の成長と動向:
Grand View Research, Inc.の最新レポートによると、世界のOT(Operational Technology)セキュリティ市場規模は2030年までに615億米ドルに達する見込みです。
同産業は2023年から2030年にかけて18.2%の有利なCAGRで成長すると予測されています。この成長の背景には、OTとITシステムの統合が進み、サイバー攻撃に対する脆弱性が増大していることなどがあります。さらに、産業用制御システムにデジタル技術を採用することで、サイバー犯罪者が悪用する新たな道が開かれます。さらに、さまざまなベンダーが提供するOT(Operational Technology)セキュリティ・ソリューションの利用可能性が高まっていることも、市場の追い風となっています。このような要因が重なることで、世界のOT(Operational Technology)セキュリティ市場は今後数年間で大きく成長する見通しです。
OT(Operational Technology)セキュリティ市場の拡大は、主にOT環境内で遭遇する特有のセキュリティ課題に対処する包括的かつ統合的なソリューションに対するニーズの高まりが原動力となっています。OTシステムとITシステムの相互接続の拡大は、サイバー脅威に対する脆弱性を増幅させています。さらに、産業用制御システムにおけるデジタル技術の活用の急増は、サイバー犯罪者に新たな攻撃機会を提供しています。このため、企業や政府機関の間では、OT(Operational Technology)セキュリティの重要性に対する認識が高まっています。さらに、こうした需要に対応するため、さまざまなベンダーが提供するOT(Operational Technology)セキュリティ・ソリューションがますます利用しやすくなっています。
北米のOT(Operational Technology)セキュリティ市場は、セキュリティと安全性に対する関心の高まりにより、急成長を遂げています。OTシステムとITシステムの相互接続が進むにつれて、OTシステムはサイバー攻撃にさらされる可能性が高まっています。OTシステムとITシステムの相互接続が進むと、サイバー脅威に対する脆弱性が高まる。その結果、企業や政府機関はOT(Operational Technology)セキュリティの重要性をより強く認識するようになっています。このような意識は、進化する課題に効果的に対処するためのさまざまなOT(Operational Technology)セキュリティソリューションの利用可能性の拡大によって支えられています。
OT(Operational Technology)セキュリティ市場のレポートハイライト
- 2022年の市場はソリューション部門が牽引し、世界売上高の76%以上を占めました。この背景には、脆弱性評価、侵入テスト、政府および業界の規制への準拠を確保するためのニーズの高まりがあります。
- 大企業セグメントは2022年の市場を独占しました。このセグメントの成長は、サイバー攻撃者にとってより魅力的な、より複雑で重要なOT環境に起因しています。また、大企業はOT(Operational Technology)セキュリティに投資するリソースも豊富です。
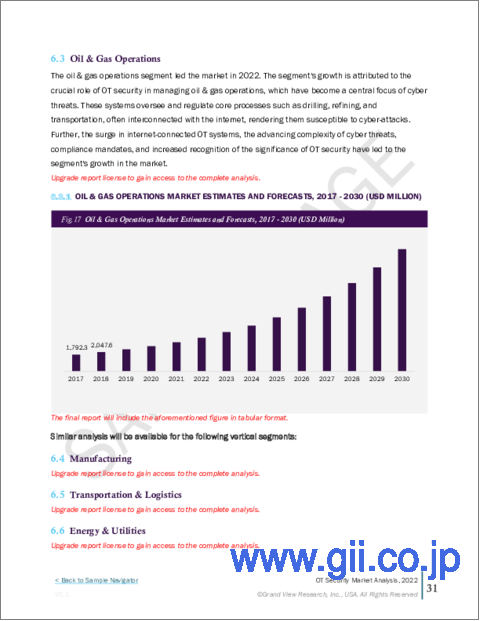
- 石油・ガス事業セグメントが2022年の市場をリードしました。この成長は、複雑で相互接続されたオペレーション、サイバーセキュリティリスクの増加、規制遵守の要求、意識の高まり、地政学的な考慮が強固なセキュリティ対策への投資を促進していることに起因しています。
- 2022年の市場は北米が支配的でした。これは、同地域の技術進歩、高い産業活動、サイバーセキュリティの重視に起因します。
目次
第1章 調査手法と範囲
第2章 エグゼクティブサマリー
第3章 市場変数、動向、および範囲
- 市場の系統
- 業界のバリューチェーン分析
- OT(Operational Technology)セキュリティ市場-市場力学
- 市場促進要因の分析
- 市場抑制要因分析
- 業界の課題
- ビジネス環境ツール分析:コンピュータービジョン市場
- ポーターのファイブフォース分析
- PESTLE分析
- 経済メガトレンド分析
第4章 OT(Operational Technology)セキュリティ市場:コンポーネント別推定・動向分析
- OT(Operational Technology)セキュリティ市場:重要なポイント
- OT(Operational Technology)セキュリティ市場:変動分析、2022年および2030年
- ソリューション
- サービス
第5章 OT(Operational Technology)セキュリティ市場:展開別推定・動向分析
- OT(Operational Technology)セキュリティ市場:重要なポイント
- OT(Operational Technology)セキュリティ市場:変動分析、2022年および2030年
- クラウド
- オンプレミス
第6章 OT(Operational Technology)セキュリティ市場:企業規模別推定・動向分析
- OT(Operational Technology)セキュリティ市場:重要なポイント
- OT(Operational Technology)セキュリティ市場:変動分析、2022年および2030年び2030年
- 中小企業
- 大企業
第7章 OT(Operational Technology)セキュリティ市場:業界別推定・動向分析
- OT(Operational Technology)セキュリティ市場:重要なポイント
- OT(Operational Technology)セキュリティ市場:変動分析、2022年および2030年年
- 製造業
- 輸送と物流
- エネルギーとユーティリティ
- 石油・ガス事業
- 政府
- ヘルスケアと医薬品
- その他
第8章 OT(Operational Technology)セキュリティ市場:地域別推定・動向分析
- OT(Operational Technology)セキュリティ市場:地域変動分析、2022年および2030年
- 北米
- 市場推計・予測、2017~2030年
- 米国
- カナダ
- 欧州
- 市場推計・予測、2017~2030年
- ドイツ
- フランス
- 英国
- アジア太平洋地域
- 市場推計・予測、2017~2030年
- 中国
- 日本
- インド
- 韓国
- オーストラリア
- ラテンアメリカ
- 市場推計・予測、2017~2030年
- ブラジル
- メキシコ
- 中東とアフリカ
- 市場推計・予測、2017~2030年
- サウジアラビア王国(KSA)
- アラブ首長国連邦
- 南アフリカ
第9章 競合情勢
- 企業の分類
- 企業の市場での位置づけ
- 企業ヒートマップ分析
- 戦略マッピング
- 企業プロファイル・一覧表
- Broadcom
- Cisco Systems Inc
- Cyberark Software Ltd.
- Darktrace Holdings Limited.
- Fortinet, Inc.
- Forcepoint
- Nozomi Networks Inc.
- Qualys, Inc.
- Sophos Ltd.
- Zscaler, Inc.
List of Tables
- Table 1 OT Security - industry snapshot & key buying criteria, 2017 - 2030
- Table 2 Global OT security market, 2017 - 2030 (USD Million)
- Table 3 Global OT security market estimates and forecast by component, 2017 - 2030 (USD million)
- Table 4 Global OT security market estimates and forecast by deployment, 2017 - 2030 (USD Million)
- Table 5 Global OT security market estimates and forecast by enterprise size, 2017 - 2030 (USD Million)
- Table 6 Global OT security market estimates and forecast by vertical, from 2017 - 2030 (USD Million)
- Table 7 Global OT security market estimates and forecasts by region, 2017 - 2030 (USD Million)
- Table 8 OT Security market estimates and forecast by component, 2017 - 2030 (USD Million)
- Table 9 OT Security market estimates and forecast by solutions, 2017 - 2030 (USD Million)
- Table 10 OT Security market estimates and forecast by services, 2017 - 2030 (USD Million)
- Table 11 OT Security market estimates and forecast by on-premises, 2017 - 2030 (USD Million)
- Table 12 OT Security market estimates and forecast, by cloud, 2017 - 2030 (USD Million)
- Table 13 OT Security market estimates and forecast by SMEs, 2017 - 2030 (USD Million)
- Table 14 OT Security market estimates and forecast by large enterprises, 2017 - 2030 (USD Million)
- Table 15 OT Security market estimates and forecast, by manufacturing, 2017 - 2030 (USD Million)
- Table 16 OT Security market estimates and forecast by transportation & logistics, 2017 - 2030 (USD Million)
- Table 17 OT Security market estimates and forecast by energy & utilities, 2017 - 2030 (USD Million)
- Table 18 OT Security market estimates and forecast by oil & gas operations, 2017 - 2030 (USD Million)
- Table 19 OT Security market estimates and forecast, by government, 2017 - 2030 (USD Million)
- Table 20 OT Security market estimates and forecast by Healthcare & pharmaceuticals, 2017 - 2030 (USD Million)
- Table 21 OT Security market estimates and forecast by others, 2017 - 2030 (USD Million)
- Table 22 North America OT Security Market Estimates And Forecast, 2017 - 2030 (USD Million)
- Table 23 North America OT security market estimates and forecast, by component, 2017 - 2030 (USD Million)
- Table 24 North America OT security market estimates and forecast, by deployment, 2017 - 2030 (USD Million)
- Table 25 North America OT security market estimates and forecast, by enterprise size, 2017 - 2030 (USD Million)
- Table 26 North America OT security market estimates and forecast, by vertical, 2017 - 2030 (USD Million)
- Table 27 U.S. OT security market estimates and forecast, 2017 - 2030 (USD Million)
- Table 28 U.S. OT security market estimates and forecast by component, 2017 - 2030 (USD Million)
- Table 29 U.S. OT security market estimates and forecast by deployment, 2017 - 2030 (USD Million)
- Table 30 U.S. OT security market estimates and forecast by enterprise size, 2017 - 2030 (USD Million)
- Table 31 U.S. OT security market estimates and forecast by vertical, 2017 - 2030 (USD Million)
- Table 32 Canada OT security market estimates and forecast, 2017 - 2030 (USD Million)
- Table 33 Canada OT security market estimates and forecast by component, 2017 - 2030 (USD Million)
- Table 34 Canada OT security market estimates and forecast by deployment, 2017 - 2030 (USD Million)
- Table 35 Canada OT security market estimates and forecast by enterprise size, 2017 - 2030 (USD Million)
- Table 36 Canada OT security market estimates and forecast by vertical, 2017 - 2030 (USD Million)
- Table 37 Europe OT Security Market Estimates And Forecast, 2017 - 2030 (USD Million)
- Table 38 Europe OT security market estimates and forecast by component, 2017 - 2030 (USD Million)
- Table 39 Europe OT security market estimates and forecast by deployment, 2017 - 2030 (USD Million)
- Table 40 Europe OT security market estimates and forecast by enterprise size, 2017 - 2030 (USD Million)
- Table 41 Europe OT security market estimates and forecast by vertical, 2017 - 2030 (USD Million)
- Table 42 UK OT security market estimates and forecast, 2017 - 2030 (USD Million)
- Table 43 UK OT security market estimates and forecast by component, 2017 - 2030 (USD Million)
- Table 44 UK OT security market estimates and forecast by deployment, 2017 - 2030 (USD Million)
- Table 45 UK OT security market estimates and forecast by enterprise size, 2017 - 2030 (USD Million)
- Table 46 UK OT security market estimates and forecast by vertical, 2017 - 2030 (USD Million)
- Table 47 Germany OT security market estimates and forecast, 2017 - 2030 (USD Million)
- Table 48 Germany OT security market estimates and forecast by component, 2017 - 2030 (USD Million)
- Table 49 Germany OT security market estimates and forecast by deployment, 2017 - 2030 (USD Million)
- Table 50 Germany OT security market estimates and forecast by enterprise size, 2017 - 2030 (USD Million)
- Table 51 Germany OT security market estimates and forecast by vertical, 2017 - 2030 (USD Million)
- Table 52 France OT security market estimates and forecast, 2017 - 2030 (USD Million)
- Table 53 France OT security market estimates and forecast by component, 2017 - 2030 (USD Million)
- Table 54 France OT security market estimates and forecast by deployment, 2017 - 2030 (USD Million)
- Table 55 France OT security market estimates and forecast by enterprise size, 2017 - 2030 (USD Million)
- Table 56 France OT security market estimates and forecast by vertical, 2017 - 2030 (USD Million)
- Table 57 Asia Pacific OT security market estimates and forecast, 2017 - 2030 (USD Million)
- Table 58 Asia Pacific OT security market estimates and forecast by component, 2017 - 2030 (USD Million)
- Table 59 Asia Pacific OT security market estimates and forecast by deployment, 2017 - 2030 (USD Million)
- Table 60 Asia Pacific OT security market estimates and forecast by enterprise size, 2017 - 2030 (USD Million)
- Table 61 Asia Pacific OT security market estimates and forecast by vertical, 2017 - 2030 (USD Million)
- Table 62 China OT security market estimates and forecast, 2017 - 2030 (USD Million)
- Table 63 China OT security market estimates and forecast by component, 2017 - 2030 (USD Million)
- Table 64 China OT security market estimates and forecast by deployment, 2017 - 2030 (USD Million)
- Table 65 China OT security market estimates and forecast by enterprise size, 2017 - 2030 (USD Million)
- Table 66 China OT security market estimates and forecast by vertical, 2017 - 2030 (USD Million)
- Table 67 Japan OT security market estimates and forecast, 2017 - 2030 (USD Million)
- Table 68 Japan OT security market estimates and forecast by component, 2017 - 2030 (USD Million)
- Table 69 Japan OT security market estimates and forecast by deployment, 2017 - 2030 (USD Million)
- Table 70 Japan OT security market estimates and forecast by enterprise size, 2017 - 2030 (USD Million)
- Table 71 Japan OT security market estimates and forecast by vertical, 2017 - 2030 (USD Million)
- Table 72 India OT security market estimates and forecast, 2017 - 2030 (USD Million)
- Table 73 India OT security market estimates and forecast by component, 2017 - 2030 (USD Million)
- Table 74 India OT security market estimates and forecast by deployment, 2017 - 2030 (USD Million)
- Table 75 India OT security market estimates and forecast by enterprise size, 2017 - 2030 (USD Million)
- Table 76 India OT security market estimates and forecast by vertical, 2017 - 2030 (USD Million)
- Table 77 South Korea OT security market estimates and forecast, 2017 - 2030 (USD Million)
- Table 78 South Korea OT security market estimates and forecast by component, 2017 - 2030 (USD Million)
- Table 79 South Korea OT security market estimates and forecast by deployment, 2017 - 2030 (USD Million)
- Table 80 South Korea OT security market estimates and forecast by enterprise size, 2017 - 2030 (USD Million)
- Table 81 South Korea OT security market estimates and forecast by vertical, 2017 - 2030 (USD Million)
- Table 82 Australia OT security market estimates and forecast, 2017 - 2030 (USD Million)
- Table 83 Australia OT security market estimates and forecast by component, 2017 - 2030 (USD Million)
- Table 84 Australia OT security market estimates and forecast by deployment, 2017 - 2030 (USD Million)
- Table 85 Australia OT security market estimates and forecast by enterprise size, 2017 - 2030 (USD Million)
- Table 86 Australia OT security market estimates and forecast by vertical, 2017 - 2030 (USD Million)
- Table 87 Latin America OT security market estimates and forecast, 2017 - 2030 (USD Million)
- Table 88 Latin America OT security market estimates and forecast by component, 2017 - 2030 (USD Million)
- Table 89 Latin America OT security market estimates and forecast by deployment, 2017 - 2030 (USD Million)
- Table 90 Latin America OT security market estimates and forecast by enterprise size, 2017 - 2030 (USD Million)
- Table 91 Latin America OT security market estimates and forecast by vertical, 2017 - 2030 (USD Million)
- Table 92 Brazil OT security market estimates and forecast, 2017 - 2030 (USD Million)
- Table 93 Brazil OT security market estimates and forecast by component, 2017 - 2030 (USD Million)
- Table 94 Brazil OT security market estimates and forecast by deployment, 2017 - 2030 (USD Million)
- Table 95 Brazil OT security market estimates and forecast by enterprise size, 2017 - 2030 (USD Million)
- Table 96 Brazil OT security market estimates and forecast by vertical, 2017 - 2030 (USD Million)
- Table 97 Mexico OT security market estimates and forecast, 2017 - 2030 (USD Million)
- Table 98 Mexico OT security market estimates and forecast by component, 2017 - 2030 (USD Million)
- Table 99 Mexico OT security market estimates and forecast by deployment, 2017 - 2030 (USD Million)
- Table 100 Mexico OT security market estimates and forecast by enterprise size, 2017 - 2030 (USD Million)
- Table 101 Mexico OT security market estimates and forecast by vertical, 2017 - 2030 (USD Million)
- Table 102 Middle East & Africa OT security market estimates and forecast, 2017 - 2030 (USD Million)
- Table 103 Middle East & Africa OT security market estimates and forecast by component, 2017 - 2030 (USD Million)
- Table 104 Middle East & Africa OT security market estimates and forecast by deployment, 2017 - 2030 (USD Million)
- Table 105 Middle East & Africa OT security market estimates and forecast by enterprise size, 2017 - 2030 (USD Million)
- Table 106 Middle East & Africa OT security market estimates and forecast by vertical, 2017 - 2030 (USD Million)
- Table 107 Kingdom of Saudi Arabia OT security market estimates and forecast, 2017 - 2030 (USD Million)
- Table 108 Kingdom of Saudi Arabia OT security market estimates and forecast by component, 2017 - 2030 (USD Million)
- Table 109 Kingdom of Saudi Arabia OT security market estimates and forecast by deployment, 2017 - 2030 (USD Million)
- Table 110 Kingdom of Saudi Arabia OT security market estimates and forecast by enterprise size, 2017 - 2030 (USD Million)
- Table 111 Kingdom of Saudi Arabia OT security market estimates and forecast by vertical, 2017 - 2030 (USD Million)
- Table 112 UAE OT security market estimates and forecast, 2017 - 2030 (USD Million)
- Table 113 UAE OT security market estimates and forecast by component, 2017 - 2030 (USD Million)
- Table 114 UAE OT security market estimates and forecast by deployment, 2017 - 2030 (USD Million)
- Table 115 UAE OT security market estimates and forecast by enterprise size, 2017 - 2030 (USD Million)
- Table 116 UAE OT security market estimates and forecast by vertical, 2017 - 2030 (USD Million)
- Table 117 South Africa OT security market estimates and forecast, 2017 - 2030 (USD Million)
- Table 118 South Africa OT security market estimates and forecast by component, 2017 - 2030 (USD Million)
- Table 119 South Africa OT security market estimates and forecast by deployment, 2017 - 2030 (USD Million)
- Table 120 South Africa OT Security Market Estimates and Forecast by Enterprise Size, 2017 - 2030 (USD Million)
- Table 121 South Africa OT Security Market Estimates and Forecast By vertical, 2017 - 2030 (USD Million)
List of Figures
- Fig. 1 OT Security Market Snapshot
- Fig. 2 OT Security Market Segmentation & Scope
- Fig. 3 OT Security Market Penetration & Growth Prospect Mapping
- Fig. 4 OT Security Market Value Chain Analysis
- Fig. 5 OT Security Market Dynamics
- Fig. 6 OT Security Market Porter's Analysis
- Fig. 7 OT Security Market: Component Movement Analysis
- Fig. 8 OT Security Market: Deployment Movement Analysis
- Fig. 9 OT Security Market: Enterprise Size Movement Analysis
- Fig. 10 OT Security Market: Vertical Movement Analysis
- Fig. 11 OT Security Market: Regional Movement Analysis
Operational Technology Security Market Growth & Trends:
The global operational technology security market size is expected to reach USD 61.50 billion by 2030, according to a new report by Grand View Research, Inc.. The industry is anticipated to grow at a lucrative CAGR of 18.2% from 2023 to 2030. The growth is attributed to several factors, such as the increasing integration of OT and IT systems, which amplifies their vulnerability to cyberattacks. Moreover, adopting digital technologies within industrial control systems exposes new avenues for cybercriminals to exploit. Additionally, the market is benefiting from the increasing availability of OT security solutions offered by various vendors. This confluence of factors is poised to drive significant growth in the global operational technology (OT) security market in the upcoming years.
The expansion of the OT security market is primarily driven by the rising need for comprehensive and integrated solutions addressing the unique security challenges encountered within OT environments. The growing interconnection of OT and IT systems amplifies their vulnerability to cyber threats. Additionally, the surge in the utilization of digital technologies in industrial control systems provides cybercriminals with new opportunities for attacks. This has increased recognition of OT security's significance among enterprises and governmental bodies. Moreover, an array of OT security solutions from diverse vendors has become increasingly accessible to cater to these demands.
The OT security market in North America is witnessing rapid growth due to rising concerns for security and safety. The increasing interconnectedness of OT systems with IT systems exposes them further to cyberattacks. The growing interconnection of OT and IT systems enhances their vulnerability to cyber threats. As a result, businesses and government agencies are becoming more aware of the importance of OT security. This awareness is supported by the expanding availability of various OT security solutions to address these evolving challenges effectively.
Operational Technology Security Market Report Highlights:
- The solutions segment led the market in 2022, accounting for over 76% share of the global revenue. This is due to the growing need for vulnerability assessment, penetration testing, and ensuring compliance with government and industry regulations
- The large enterprises segment dominated the market in 2022. The segment's growth is attributed to the more complex and critical OT environments that are more attractive to cyber attackers. They also have more resources to invest in OT security
- The oil & gas operations segment led the market in 2022. The growth is attributed to its complex and interconnected operations, increasing cybersecurity risks, regulatory compliance demands, heightened awareness, and geopolitical considerations driving investments in robust security measures
- North America dominated the market in 2022. This can be attributed to the region's technological advancement, high industrial activity, and strong emphasis on cybersecurity
Table of Contents
Chapter 1. Methodology And Scope
- 1.1. Research Methodology
- 1.2. Research Scope And Assumptions
- 1.3. Information Procurement
- 1.3.1. Purchased Database
- 1.3.2. GVR's Internal Database
- 1.3.3. Secondary Sources & Third-Party Perspectives
- 1.3.4. Primary Research
- 1.4. Information Analysis
- 1.4.1. Data Analysis Models
- 1.5. Market Formulation & Data Visualization
- 1.6. Data Validation & Publishing
Chapter 2. Executive Summary
- 2.1. Market Outlook
- 2.2. Segmental Outlook
- 2.3. Competitive Insights
Chapter 3. Market Variables, Trends, And Scope
- 3.1. Market Lineage
- 3.2. Industry Value Chain Analysis
- 3.3. OT Security Market - Market Dynamics
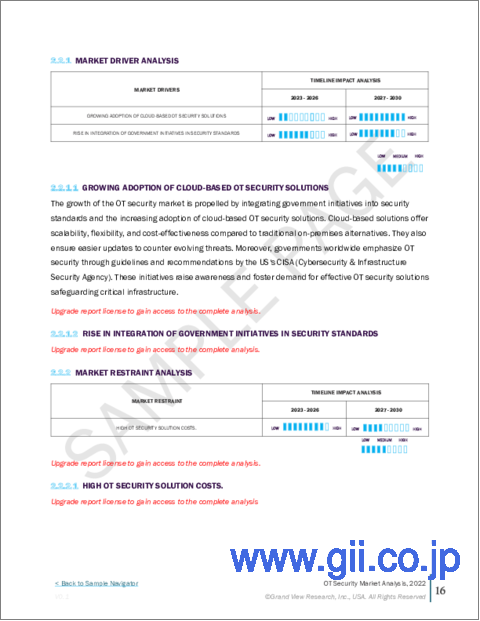
- 3.3.1. Market Driver Analysis
- 3.3.1.1. Growing Adoption Of Cloud-Based OT Security Solutions
- 3.3.1.2. Rise In Integration Of Government Initiatives In Security Standards
- 3.3.2. Market Restraint Analysis
- 3.3.2.1. High OT Security Solution Costs
- 3.3.3. Industry Challenges
- 3.3.1. Market Driver Analysis
- 3.4. Business Environmental Tools Analysis: Computer Vision Market
- 3.4.1. Porter's Five Forces Analysis
- 3.4.1.1. Bargaining Power Of Suppliers
- 3.4.1.2. Bargaining Power Of Buyers
- 3.4.1.3. Threat Of Substitution
- 3.4.1.4. Threat Of New Entrants
- 3.4.1.5. Competitive Rivalry
- 3.4.2. Pestle Analysis
- 3.4.2.1. Political Landscape
- 3.4.2.2. Economic Landscape
- 3.4.2.3. Social Landscape
- 3.4.2.4. Technology Landscape
- 3.4.2.5. Environmental Landscape
- 3.4.2.6. Legal Landscape
- 3.4.1. Porter's Five Forces Analysis
- 3.5. Economic Mega-Trend Analysis
Chapter 4. OT Security Market: Component Estimates & Trend Analysis
- 4.1. OT Security Market, By Component: Key Takeaways
- 4.2. OT Security Market: Component Movement Analysis, 2022 & 2030
- 4.3. Solution
- 4.3.1. Market Estimates And Forecasts, 2017 - 2030 (USD Million)
- 4.4. Services
- 4.4.1. Market Estimates And Forecasts, 2017 - 2030 (USD Million)
Chapter 5. OT Security Market: Deployment Estimates & Trend Analysis
- 5.1. OT Security Market, By Deployment: Key Takeaways
- 5.2. OT Security Market: Deployment Movement Analysis, 2022 & 2030
- 5.3. Cloud
- 5.3.1. Market Estimates And Forecasts, 2017 - 2030 (USD Million)
- 5.4. On-Premises
- 5.4.1. Market Estimates And Forecasts, 2017 - 2030 (USD Million)
Chapter 6. OT Security Market: Enterprise Size Estimates & Trend Analysis
- 6.1. OT Security Market, By Enterprise Size: Key Takeaways
- 6.2. OT Security Market: Enterprise Size Movement Analysis, 2022 & 2030
- 6.3. Smes
- 6.3.1. Market Estimates And Forecasts, 2017 - 2030 (USD Million)
- 6.4. Large Enterprises
- 6.4.1. Market Estimates And Forecasts, 2017 - 2030 (USD Million)
Chapter 7. OT Security Market: Vertical Estimates & Trend Analysis
- 7.1. OT Security Market, By Vertical: Key Takeaways
- 7.2. OT Security Market: Vertical Movement Analysis, 2022 & 2030
- 7.3. Manufacturing
- 7.3.1. Market Estimates And Forecasts, 2017 - 2030 (USD Million)
- 7.4. Transportation & Logistics
- 7.4.1. Market Estimates And Forecasts, 2017 - 2030 (USD Million)
- 7.5. Energy & Utilities
- 7.5.1. Market Estimates And Forecasts, 2017 - 2030 (USD Million)
- 7.6. Oil & Gas Operations
- 7.6.1. Market Estimates And Forecasts, 2017 - 2030 (USD Million)
- 7.7. Government
- 7.7.1. Market Estimates And Forecasts, 2017 - 2030 (USD Million)
- 7.8. Healthcare & Pharmaceuticals
- 7.8.1. Market Estimates And Forecasts, 2017 - 2030 (USD Million)
- 7.9. Others
- 7.9.1. Market Estimates And Forecasts, 2017 - 2030 (USD Million)
Chapter 8. OT Security Market: Regional Estimates & Trend Analysis
- 8.1. OT Security Market: Regional Movement Analysis, 2022 & 2030
- 8.2. North America
- 8.2.1. Market Estimates And Forecasts, 2017 - 2030 (USD Million)
- 8.2.2. U.S.
- 8.2.2.1. Market Estimates And Forecasts, 2017 - 2030 (USD Million)
- 8.2.3. Canada
- 8.2.3.1. Market Estimates And Forecasts, 2017 - 2030 (USD Million)
- 8.3. Europe
- 8.3.1. Market Estimates And Forecasts, 2017 - 2030 (USD Million)
- 8.3.2. Germany
- 8.3.2.1. Market Estimates And Forecasts, 2017 - 2030 (USD Million)
- 8.3.3. France
- 8.3.3.1. Market Estimates And Forecasts, 2017 - 2030 (USD Million)
- 8.3.4. Uk
- 8.3.4.1. Market Estimates And Forecasts, 2017 - 2030 (USD Million)
- 8.4. Asia Pacific
- 8.4.1. Market Estimates And Forecasts, 2017 - 2030 (USD Million)
- 8.4.2. China
- 8.4.2.1. Market Estimates And Forecasts, 2017 - 2030 (USD Million)
- 8.4.3. Japan
- 8.4.3.1. Market Estimates And Forecasts, 2017 - 2030 (USD Million)
- 8.4.4. India
- 8.4.4.1. Market Estimates And Forecasts, 2017 - 2030 (USD Million)
- 8.4.5. South Korea
- 8.4.5.1. Market Estimates And Forecasts, 2017 - 2030 (USD Million)
- 8.4.6. Australia
- 8.4.6.1. Market Estimates And Forecasts, 2017 - 2030 (USD Million)
- 8.5. Latin America
- 8.5.1. Market Estimates And Forecasts, 2017 - 2030 (USD Million)
- 8.5.2. Brazil
- 8.5.2.1. Market Estimates And Forecasts, 2017 - 2030 (USD Million)
- 8.5.3. Mexico
- 8.5.3.1. Market Estimates And Forecasts, 2017 - 2030 (USD Million)
- 8.6. Middle East & Africa
- 8.6.1. Market Estimates And Forecasts, 2017 - 2030 (USD Million)
- 8.6.2. Kingdom Of Saudi Arabia (KSA)
- 8.6.2.1. Market Estimates And Forecasts, 2017 - 2030 (USD Million)
- 8.6.3. UAE
- 8.6.3.1. Market Estimates And Forecasts, 2017 - 2030 (USD Million)
- 8.6.4. South Africa
- 8.6.4.1. Market Estimates And Forecasts, 2017 - 2030 (USD Million)
Chapter 9. Competitive Landscape
- 9.1. Company Categorization
- 9.2. Company Market Positioning
- 9.3. Company Heat Map Analysis
- 9.4. Strategy Mapping
- 9.5. Company Profiles/Listing
- 9.5.1. Broadcom
- 9.5.1.1. Overview
- 9.5.1.2. Financial Performance
- 9.5.1.3. Product Benchmarking
- 9.5.1.4. Strategic Initiatives
- 9.5.2. Cisco Systems Inc
- 9.5.2.1. Overview
- 9.5.2.2. Financial Performance
- 9.5.2.3. Product Benchmarking
- 9.5.2.4. Strategic Initiatives
- 9.5.3. Cyberark Software Ltd.
- 9.5.3.1. Overview
- 9.5.3.2. Financial Performance
- 9.5.3.3. Product Benchmarking
- 9.5.3.4. Strategic Initiatives
- 9.5.4. Darktrace Holdings Limited.
- 9.5.4.1. Overview
- 9.5.4.2. Financial Performance
- 9.5.4.3. Product Benchmarking
- 9.5.4.4. Strategic Initiatives
- 9.5.5. Fortinet, Inc.
- 9.5.5.1. Overview
- 9.5.5.2. Financial Performance
- 9.5.5.3. Product Benchmarking
- 9.5.5.4. Strategic Initiatives
- 9.5.6. Forcepoint
- 9.5.6.1. Overview
- 9.5.6.2. Financial Performance
- 9.5.6.3. Product Benchmarking
- 9.5.6.4. Strategic Initiatives
- 9.5.7. Nozomi Networks Inc.
- 9.5.7.1. Overview
- 9.5.7.2. Financial Performance
- 9.5.7.3. Product Benchmarking
- 9.5.7.4. Strategic Initiatives
- 9.5.8. Qualys, Inc.
- 9.5.8.1. Overview
- 9.5.8.2. Financial Performance
- 9.5.8.3. Product Benchmarking
- 9.5.8.4. Strategic Initiatives
- 9.5.9. Sophos Ltd.
- 9.5.9.1. Overview
- 9.5.9.2. Financial Performance
- 9.5.9.3. Product Benchmarking
- 9.5.9.4. Strategic Initiatives
- 9.5.10. Zscaler, Inc.
- 9.5.10.1. Overview
- 9.5.10.2. Financial Performance
- 9.5.10.3. Product Benchmarking
- 9.5.10.4. Strategic Initiatives
- 9.5.1. Broadcom
