|
|
市場調査レポート
商品コード
1363123
自動分包機の市場規模、シェア、動向分析レポート:用途別、最終用途別、オペレーション別、地域別、セグメント別予測、2023年~2030年Automated Dispensing Machines Market Size, Share & Trends Analysis Report By Application (Outpatient, In-patient), By End Use (Hospitals, Retail Drug Stores And Pharmacies), By Operation, By Region, And Segment Forecasts, 2023 - 2030 |
||||||
|
|
|||||||
カスタマイズ可能
|
|||||||


| 自動分包機の市場規模、シェア、動向分析レポート:用途別、最終用途別、オペレーション別、地域別、セグメント別予測、2023年~2030年 |
|
出版日: 2023年09月22日
発行: Grand View Research
ページ情報: 英文 100 Pages
納期: 2~10営業日
|

- 全表示
- 概要
- 図表
- 目次
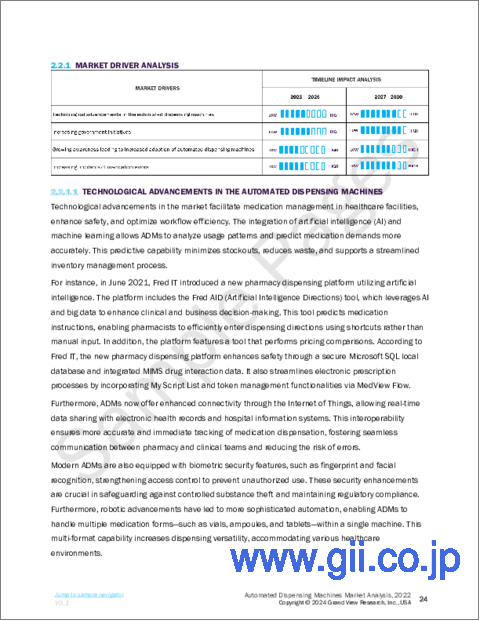
自動分包機市場の成長と動向:
Grand View Research, Inc.の最新レポートによると、世界の自動分包機市場規模は2023年から2030年にかけて7.2%のCAGRを記録し、2030年には83億1,000万米ドルに達する見込みです。
診療報酬の引き下げや薬価の急騰による医薬品への圧力の高まりは、非効率なサプライチェーンや在庫管理につながります。RFIDキャビネットやバーコードなどの自動化システムに対する需要の高まりは、リアルタイムの在庫・在庫管理を容易にし、これが今後数年間で市場を牽引すると予想される極めて重要な要因の一つとなっています。
さらに、世界の高齢者人口の増加や様々な慢性疾患の流行、入院率の高さなどは、病院や小売ドラッグストアの薬局の負担を増加させる要因の一部となっています。処方箋枚数の急増や熟練薬剤師の不足も、調剤システムの自動化を後押しすると予想されるいくつかの要因です。
在庫補充のための長い待ち時間や薬剤の不始末を軽減するために、技術的に高度な調剤システムへの需要が増加しており、調剤、保管、検索などの薬局自動化システムの使用率を促進すると予想される重要な要因の1つです。2011年のASHPによる病院での薬局業務に関する全国調査によると、約89%の病院が自動調剤棚を使用し、10%以上の病院がロボットを使用しています。
Society of Actuariesが実施した調査によると、測定可能な投薬ミスは米国経済に200億米ドルの損害を与えているが、これらのミスの大部分は容易に回避できたことが判明しています。調剤過誤の増加は、患者の健康状態の深刻な悪化や死亡につながる可能性のある副作用の数を増加させる重要な要因であり、これが今後数年間の需要を牽引すると予想されています。例えば米国では、Institute of Medicineが発表したデータによると、毎年約7,000人が投薬ミスが原因で死亡しています。
自動分包機市場のレポートハイライト
- 入院患者セグメントが主要アプリケーションセグメントであり、2022年には72.8%の最大シェアを占める。入院患者の増加と多数の投薬過誤の発生がこのセグメントの成長に寄与しています。外来患者セグメントはCAGR 8.1%で予測期間中に最も急成長するセグメントとなる見込みです。
- 2022年の収益シェアは病院セグメントが最大です。小売ドラッグストアと薬局は予測期間中最も急成長するセグメントと予想されます。
- 2022年、集中型薬局セグメントが最大の事業セグメント。予測期間中、分散型薬局が最も急成長するセグメントとなる見込み。
- 2022年、北米は世界の自動分包機市場で53.4%以上の市場シェアの大半を占めました。投薬ミスの増加や、調剤プロセスの合理化による運用コストの全体的な削減に対する需要の高まりは、同地域の高い市場シェアに起因するいくつかの重要な要因です。
- 主な市場プレーヤーとしては、Omnicell, Inc.、Becton, Dickinson &Co.、Baxter、Swisslog、Parata Systems、AmerisourceBergen Corporationなどが挙げられます。その他の主な競合企業は、ピアソン・メディカル・テクノロジーズ、スクリプト・プロLLC、カプサ・ソリューションズなどです。
目次
第1章 調査手法と範囲
第2章 エグゼクティブサマリー
第3章 自動分包機市場の変数、動向、範囲
- 市場系統の見通し
- 親市場の見通し
- 関連/付随市場の見通し
- 普及と成長の見通しマッピング
- 市場力学
- 市場促進要因の分析
- 市場抑制要因分析
- 自動分包機市場分析ツール
- 業界分析- ポーターのファイブフォース分析
- PESTEL分析
第4章 自動分包機:用途別推定・動向分析
- 自動分包機市場:重要なポイント
- 自動分包機市場:動向と市場シェア分析、2022年および2030年
- 外来
- 入院患者
第5章 自動分包機:最終用途別推定・動向分析
- 自動分包機市場:重要なポイント
- 自動分包機市場:動向と市場シェア分析、2022年および2030年
- 病院
- 小売ドラッグストアおよび薬局
第6章 自動分包機:オペレーション別推定・動向分析
- 自動分包機市場:重要なポイント
- 自動分包機市場:動向と市場シェア分析、2022年および2030年
- 集中薬局
- 分散型薬局
第7章 自動分包機市場:地域別推定・動向分析
- 地域別の見通し
- 地域別の自動分包機市場:主要マーケットプレースの要点
- 北米
- 欧州
- アジア太平洋地域
- ラテンアメリカ
- 中東・アフリカ
第8章 競合情勢
- 主要市場参入企業による最近の動向と影響分析
- 市場参入企業の分類
- Omnicell, Inc.
- BD
- Omnicell, Inc.
- ScriptPro LLC
- Avery Weigh-Tronix
- PEARSON MEDICAL TECHNOLOGIES
- Accu-Chart
- Baxter
- Capsa Healthcare
List of Tables
- Table 1 List of abbreviations
- Table 2 North America automated dispensing machines market, by application, 2018 - 2030 (USD Million)
- Table 3 North America automated dispensing machines market, by end use, 2018 - 2030 (USD Million)
- Table 4 North America automated dispensing machines market, by operation, 2018 - 2030 (USD Million)
- Table 5 North America automated dispensing machines market, by region, 2018 - 2030 (USD Million)
- Table 6 U.S. automated dispensing machines market, by application, 2018 - 2030 (USD Million)
- Table 7 U.S. automated dispensing machines market, by end use, 2018 - 2030 (USD Million)
- Table 8 U.S. automated dispensing machines market, by operation, 2018 - 2030 (USD Million)
- Table 9 Canada automated dispensing machines market, by application, 2018 - 2030 (USD Million)
- Table 10 Canada automated dispensing machines market, by end use, 2018 - 2030 (USD Million)
- Table 11 Canada automated dispensing machines market, by operation, 2018 - 2030 (USD Million)
- Table 12 Europe automated dispensing machines market, by application, 2018 - 2030 (USD Million)
- Table 13 Europe automated dispensing machines market, by end use, 2018 - 2030 (USD Million)
- Table 14 Europe automated dispensing machines market, by operation, 2018 - 2030 (USD Million)
- Table 15 Europe automated dispensing machines market, by region, 2018 - 2030 (USD Million)
- Table 16 UK automated dispensing machines market, by application, 2018 - 2030 (USD Million)
- Table 17 UK automated dispensing machines market, by end use, 2018 - 2030 (USD Million)
- Table 18 UK automated dispensing machines market, by operation, 2018 - 2030 (USD Million)
- Table 19 Germany automated dispensing machines market, by application, 2018 - 2030 (USD Million)
- Table 20 Germany automated dispensing machines market, by end use, 2018 - 2030 (USD Million)
- Table 21 Germany automated dispensing machines market, by operation, 2018 - 2030 (USD Million)
- Table 22 France automated dispensing machines market, by application, 2018 - 2030 (USD Million)
- Table 23 France automated dispensing machines market, by end use, 2018 - 2030 (USD Million)
- Table 24 France automated dispensing machines market, by operation, 2018 - 2030 (USD Million)
- Table 25 Italy automated dispensing machines market, by application, 2018 - 2030 (USD Million)
- Table 26 Italy automated dispensing machines market, by end use, 2018 - 2030 (USD Million)
- Table 27 Italy automated dispensing machines market, by operation, 2018 - 2030 (USD Million)
- Table 28 Spain automated dispensing machines market, by application, 2018 - 2030 (USD Million)
- Table 29 Spain automated dispensing machines market, by end use, 2018 - 2030 (USD Million)
- Table 30 Spain automated dispensing machines market, by operation, 2018 - 2030 (USD Million)
- Table 31 Sweden automated dispensing machines market, by application, 2018 - 2030 (USD Million)
- Table 32 Sweden automated dispensing machines market, by end use, 2018 - 2030 (USD Million)
- Table 33 Sweden automated dispensing machines market, by operation, 2018 - 2030 (USD Million)
- Table 34 Norway automated dispensing machines market, by application, 2018 - 2030 (USD Million)
- Table 35 Norway automated dispensing machines market, by end use, 2018 - 2030 (USD Million)
- Table 36 Norway automated dispensing machines market, by operation, 2018 - 2030 (USD Million)
- Table 37 Denmark automated dispensing machines market, by application, 2018 - 2030 (USD Million)
- Table 38 Denmark automated dispensing machines market, by end use, 2018 - 2030 (USD Million)
- Table 39 Denmark automated dispensing machines market, by operation, 2018 - 2030 (USD Million)
- Table 40 Asia Pacific automated dispensing machines market, by application, 2018 - 2030 (USD Million)
- Table 41 Asia Pacific automated dispensing machines market, by end use, 2018 - 2030 (USD Million)
- Table 42 Asia Pacific automated dispensing machines market, by operation, 2018 - 2030 (USD Million)
- Table 43 Asia Pacific automated dispensing machines market, by region, 2018 - 2030 (USD Million)
- Table 44 Japan automated dispensing machines market, by application, 2018 - 2030 (USD Million)
- Table 45 Japan automated dispensing machines market, by end use, 2018 - 2030 (USD Million)
- Table 46 Japan automated dispensing machines market, by operation, 2018 - 2030 (USD Million)
- Table 47 China automated dispensing machines market, by application, 2018 - 2030 (USD Million)
- Table 48 China automated dispensing machines market, by end use, 2018 - 2030 (USD Million)
- Table 49 China automated dispensing machines market, by operation, 2018 - 2030 (USD Million)
- Table 50 India automated dispensing machines market, by application, 2018 - 2030 (USD Million)
- Table 51 India automated dispensing machines market, by end use, 2018 - 2030 (USD Million)
- Table 52 India automated dispensing machines market, by operation, 2018 - 2030 (USD Million)
- Table 53 Australia automated dispensing machines market, by application, 2018 - 2030 (USD Million)
- Table 54 Australia automated dispensing machines market, by end use, 2018 - 2030 (USD Million)
- Table 55 Australia automated dispensing machines market, by operation, 2018 - 2030 (USD Million)
- Table 56 Thailand automated dispensing machines market, by application, 2018 - 2030 (USD Million)
- Table 57 Thailand automated dispensing machines market, by end use, 2018 - 2030 (USD Million)
- Table 58 Thailand automated dispensing machines market, by operation, 2018 - 2030 (USD Million)
- Table 59 South Korea automated dispensing machines market, by application, 2018 - 2030 (USD Million)
- Table 60 South Korea automated dispensing machines market, by end use, 2018 - 2030 (USD Million)
- Table 61 South Korea automated dispensing machines market, by operation, 2018 - 2030 (USD Million)
- Table 62 Latin America automated dispensing machines market, by region, 2018 - 2030 (USD Million)
- Table 63 Latin America automated dispensing machines market, by application, 2018 - 2030 (USD Million)
- Table 64 Latin America automated dispensing machines market, by end use, 2018 - 2030 (USD Million)
- Table 65 Latin America automated dispensing machines market, by operation, 2018 - 2030 (USD Million)
- Table 66 Brazil automated dispensing machines market, by application, 2018 - 2030 (USD Million)
- Table 67 Brazil automated dispensing machines market, by end use, 2018 - 2030 (USD Million)
- Table 68 Brazil automated dispensing machines market, by operation, 2018 - 2030 (USD Million)
- Table 69 Mexico automated dispensing machines market, by application, 2018 - 2030 (USD Million)
- Table 70 Mexico automated dispensing machines market, by end use, 2018 - 2030 (USD Million)
- Table 71 Mexico automated dispensing machines market, by operation, 2018 - 2030 (USD Million)
- Table 72 Argentina automated dispensing machines market, by application, 2018 - 2030 (USD Million)
- Table 73 Argentina automated dispensing machines market, by end use, 2018 - 2030 (USD Million)
- Table 74 Argentina automated dispensing machines market, by operation, 2018 - 2030 (USD Million)
- Table 75 MEA automated dispensing machines market, by region, 2018 - 2030 (USD Million)
- Table 76 MEA automated dispensing machines market, by application, 2018 - 2030 (USD Million)
- Table 77 MEA automated dispensing machines market, by end use, 2018 - 2030 (USD Million)
- Table 78 MEA automated dispensing machines market, by operation, 2018 - 2030 (USD Million)
- Table 79 South Africa automated dispensing machines market, by application, 2018 - 2030 (USD Million)
- Table 80 South Africa automated dispensing machines market, by end use, 2018 - 2030 (USD Million)
- Table 81 South Africa automated dispensing machines market, by operation, 2018 - 2030 (USD Million)
- Table 82 Saudi Arabia automated dispensing machines market, by application, 2018 - 2030 (USD Million)
- Table 83 Saudi Arabia automated dispensing machines market, by end use, 2018 - 2030 (USD Million)
- Table 84 Saudi Arabia automated dispensing machines market, by operation, 2018 - 2030 (USD Million)
- Table 85 UAE automated dispensing machines market, by application, 2018 - 2030 (USD Million)
- Table 86 UAE automated dispensing machines market, by end use, 2018 - 2030 (USD Million)
- Table 87 UAE automated dispensing machines market, by operation, 2018 - 2030 (USD Million)
- Table 88 Kuwait automated dispensing machines market, by application, 2018 - 2030 (USD Million)
- Table 89 Kuwait automated dispensing machines market, by end use, 2018 - 2030 (USD Million)
- Table 90 Kuwait automated dispensing machines market, by operation, 2018 - 2030 (USD Million)
List of Figures
- Fig. 1 Market research process
- Fig. 2 Data triangulation techniques
- Fig. 3 Primary research pattern
- Fig. 4 Market research approaches
- Fig. 5 Value-chain-based sizing & forecasting
- Fig. 6 QFD modeling for market share assessment
- Fig. 7 Market formulation & validation
- Fig. 8 Automated dispensing machine: market outlook
- Fig. 9 Automated dispensing machine competitive insights
- Fig. 10 Parent market outlook
- Fig. 11 Related/ancillary market outlook
- Fig. 12 Penetration and growth prospect mapping
- Fig. 13 Industry value chain analysis
- Fig. 14 Automated dispensing machines market driver impact
- Fig. 15 Automated dispensing machines market restraint impact
- Fig. 16 Automated dispensing machines market strategic initiatives analysis
- Fig. 17 Automated dispensing machines market: Application movement analysis
- Fig. 18 Automated dispensing machines market: Application outlook and key takeaways
- Fig. 19 Outpatient market estimates and forecasts, 2018 - 2030 (USD Million)
- Fig. 20 Inpatient market estimates and forecasts, 2018 - 2030 (USD Million)
- Fig. 21 Automated dispensing machines market: End use movement analysis
- Fig. 22 Automated dispensing machines market: End use outlook and key takeaways
- Fig. 23 Hospitals market estimates and forecasts, 2018 - 2030 (USD Million)
- Fig. 24 Retail Drug Stores and Pharmacies market estimates and forecasts, 2018 - 2030 (USD Million)
- Fig. 25 Automated dispensing machines market: Operation movement analysis
- Fig. 26 Automated dispensing machines market: Operation outlook and key takeaways
- Fig. 27 Centralized Pharmacies market estimates and forecasts, 2018 - 2030 (USD Million)
- Fig. 28 Decentralized Pharmacies market estimates and forecasts, 2018 - 2030 (USD Million)
- Fig. 29 Automated dispensing machines market: Regional movement analysis
- Fig. 30 Automated dispensing machines market: Regional outlook and key takeaways
- Fig. 31 North America market estimates and forecasts, 2018 - 2030 (USD Million)
- Fig. 32 U.S. market estimates and forecasts, 2018 - 2030 (USD Million)
- Fig. 33 Canada market estimates and forecasts, 2018 - 2030 (USD Million)
- Fig. 34 Europe market estimates and forecasts, 2018 - 2030 (USD Million)
- Fig. 35 UK market estimates and forecasts, 2018 - 2030 (USD Million)
- Fig. 36 Germany market estimates and forecasts, 2018 - 2030 (USD Million)
- Fig. 37 France market estimates and forecasts, 2018 - 2030 (USD Million)
- Fig. 38 Italy market estimates and forecasts, 2018 - 2030 (USD Million)
- Fig. 39 Spain market estimates and forecasts, 2018 - 2030 (USD Million)
- Fig. 40 Sweden market estimates and forecasts, 2018 - 2030 (USD Million)
- Fig. 41 Norway market estimates and forecasts, 2018 - 2030 (USD Million)
- Fig. 42 Denmark market estimates and forecasts, 2018 - 2030 (USD Million)
- Fig. 43 Asia Pacific market estimates and forecasts, 2018 - 2030 (USD Million)
- Fig. 44 Japan market estimates and forecasts, 2018 - 2030 (USD Million)
- Fig. 45 China market estimates and forecasts, 2018 - 2030 (USD Million)
- Fig. 46 India market estimates and forecasts, 2018 - 2030 (USD Million)
- Fig. 47 Australia market estimates and forecasts, 2018 - 2030 (USD Million)
- Fig. 48 Thailand market estimates and forecasts, 2018 - 2030 (USD Million)
- Fig. 49 South Korea market estimates and forecasts, 2018 - 2030 (USD Million)
- Fig. 50 Latin America market estimates and forecasts, 2018 - 2030 (USD Million)
- Fig. 51 Brazil market estimates and forecasts, 2018 - 2030 (USD Million)
- Fig. 52 Mexico market estimates and forecasts, 2018 - 2030 (USD Million)
- Fig. 53 Argentina market estimates and forecasts, 2018 - 2030 (USD Million)
- Fig. 54 Middle East and Africa. market estimates and forecasts, 2018 - 2030 (USD Million)
- Fig. 55 Saudi Arabia market estimates and forecasts, 2018 - 2030 (USD Million)
- Fig. 56 South Africa market estimates and forecasts, 2018 - 2030 (USD Million)
- Fig. 57 UAE market estimates and forecasts, 2018 - 2030 (USD Million)
- Fig. 58 Kuwait market estimates and forecasts, 2018 - 2030 (USD Million)
Automated Dispensing Machines Market Growth & Trends:
The global automated dispensing machines market size is expected to reach USD 8.31 billion by 2030, registering a CAGR of 7.2% from 2023 to 2030, according to a new report by Grand View Research, Inc.. The growing pressure on the pharmaceuticals due to reimbursement reduction and rapidly growing drug prices leads to inefficient supply chain and inventory management. The growing demand for automated systems, such as RFID cabinet and barcodes, facilitates real-time inventory and stock management, which is one of the pivotal factors expected to drive the market in the coming years.
Furthermore, the increase in global geriatric population and prevalence of various chronic diseases, as well as high rates of hospitalization are some of the factors increasing the burden on pharmacy of hospitals and retail drug stores. Upsurge in number of prescriptions and lack of skilled pharmacist are also few factors expected to boost automation in the medication dispensing system.
There is increasing demand for technologically advanced medication dispensing systems to mitigate long waiting hours for stock replenishment and drug mismanagement, which is one of the crucial factors expected to drive the usage rate of pharmacy automation system, such dispensing, storage, and retrieval. Based on the 2011 ASHP national survey of pharmacy practice in hospital settings, it was stated that approximately 89% of the hospitals are using automated dispensing cabinets and over 10% of the hospitals are using robots.
According to a survey conducted by Society of Actuaries, it was found that measurable medication errors cost USD 20 billion to the U.S. economy, while majority of these errors could have been easily avoided. Increase in medication dispensing errors is a significant factor driving the number of adverse drug reactions, which may lead to severe deterioration of the patient's health and may also lead to death; this is expected to drive the demand in the coming years. For instance, in the U.S., data published by the Institute of Medicine states that around 7,000 deaths each year can be attributed to medication errors.
Automated Dispensing Machines Market Report Highlights:
- The inpatient segment is the leading application segment and occupies the largest share of 72.8% in 2022. Increasing cases of hospitalization coupled with occurrence of large number of medication errors contribute to the growth of this segment. The outpatient segment is expected to be the fastest growing segment during the forecast period with a CAGR of 8.1%.
- The hospitals' segment is the largest revenue share in 2022. Retail drug stores and pharmacies are expected to be the fastest growing segment during the forecast period.
- In 2022, the centralized pharmacy segment was the largest operations segment. The decentralized pharmacy is expected to be the fastest growing segment during the forecast period.
- In 2022, North America held majority of market share of over 53.4% in global automated dispensing machines market. Increasing medication errors and rising demand for the overall reduction in operational cost by streamlining medication dispensing processes are few key factors attributed to the regions high market share.
- Some of the key market players are Omnicell, Inc.; Becton, Dickinson & Co; Baxter; Swisslog; Parata Systems; AmerisourceBergen Corporation. The other key competitors in the market include Pearson Medical Technologies; Script Pro LLC; and Capsa Solutions.
Table of Contents
Chapter 1. Methodology and Scope
- 1.1. Market Segmentation & Scope
- 1.1.1. Application
- 1.1.2. End use
- 1.1.3. Operation
- 1.1.4. Regional scope
- 1.1.5. Estimates and forecast timeline
- 1.2. Research Methodology
- 1.3. Information Procurement
- 1.3.1. Purchased database
- 1.3.2. GVR's internal database
- 1.3.3. Secondary sources
- 1.3.4. Primary research
- 1.3.5. Details of primary research
- 1.4. Information or Data Analysis
- 1.4.1. Data analysis models
- 1.5. Market Formulation & Validation
- 1.6. Model Details
- 1.7. List of Secondary Sources
- 1.8. List of Primary Sources
- 1.9. Objectives
- 1.9.1. Objective 1
- 1.9.2. Objective 2
Chapter 2. Executive Summary
- 2.1. Market Outlook
- 2.2. Segment Outlook
- 2.2.1. Application outlook
- 2.2.2. End use outlook
- 2.2.3. Operation outlook
- 2.2.4. Regional outlook
- 2.3. Competitive Insights
Chapter 3. Automated Dispensing Machines Market Variables, Trends & Scope
- 3.1. Market Lineage Outlook
- 3.1.1. Parent market outlook
- 3.1.2. Related/ancillary market outlook
- 3.2. Penetration & Growth Prospect Mapping
- 3.3. Market Dynamics
- 3.3.1. Market driver analysis
- 3.3.2. Market restraint analysis
- 3.4. Automated Dispensing Machines Market Analysis Tools
- 3.4.1. Industry Analysis - Porter's
- 3.4.1.1. Supplier power
- 3.4.1.2. Buyer power
- 3.4.1.3. Substitution threat
- 3.4.1.4. Threat of new entrant
- 3.4.1.5. Competitive rivalry
- 3.4.2. PESTEL Analysis
- 3.4.2.1. Political landscape
- 3.4.2.2. Technological landscape
- 3.4.2.3. Economic landscape
- 3.4.1. Industry Analysis - Porter's
Chapter 4. Automated Dispensing Machines: Application Estimates & Trend Analysis
- 4.1. Automated Dispensing Machines Market: Key Takeaways
- 4.2. Automated Dispensing Machines Market: Movement & Market Share Analysis, 2022 & 2030
- 4.3. Outpatient
- 4.3.1. Outpatient market estimates and forecasts, 2018 to 2030 (USD Million)
- 4.4. Inpatient
- 4.4.1. Inpatient market estimates and forecasts, 2018 to 2030 (USD Million)
Chapter 5. Automated Dispensing Machines: End Use Estimates & Trend Analysis
- 5.1. Automated Dispensing Machines Market: Key Takeaways
- 5.2. Automated Dispensing Machines Market: Movement & Market Share Analysis, 2022 & 2030
- 5.3. Hospitals
- 5.3.1. Hospitals market estimates and forecasts, 2018 to 2030 (USD Million)
- 5.4. Retail Drug Stores and Pharmacies
- 5.4.1. Retail drug stores and pharmacies market estimates and forecasts, 2018 to 2030 (USD Million)
Chapter 6. Automated Dispensing Machines: Operation Estimates & Trend Analysis
- 6.1. Automated Dispensing Machines Market: Key Takeaways
- 6.2. Automated Dispensing Machines Market: Movement & Market Share Analysis, 2022 & 2030
- 6.3. Centralized Pharmacies
- 6.3.1. Centralized Pharmacies market estimates and forecasts, 2018 to 2030 (USD Million)
- 6.4. Decentralized Pharmacies
- 6.4.1. Decentralized Pharmacies market estimates and forecasts, 2018 to 2030 (USD Million)
Chapter 7. Automated Dispensing Machines Market: Regional Estimates & Trend Analysis
- 7.1. Regional Outlook
- 7.2. Automated Dispensing Machines Market by Region: Key Marketplace Takeaway
- 7.3. North America
- 7.3.1. Market estimates and forecasts, 2018 - 2030 (Revenue, USD Million)
- 7.3.2. U.S.
- 7.3.2.1. Market estimates and forecasts, 2018 - 2030 (Revenue, USD Million)
- 7.3.3. Canada
- 7.3.3.1. Market estimates and forecasts, 2018 - 2030 (Revenue, USD Million)
- 7.4. Europe
- 7.4.1. UK
- 7.4.1.1. Market estimates and forecasts, 2018 - 2030 (Revenue, USD Million)
- 7.4.2. Germany
- 7.4.2.1. Market estimates and forecasts, 2018 - 2030 (Revenue, USD Million)
- 7.4.3. France
- 7.4.3.1. Market estimates and forecasts, 2018 - 2030 (Revenue, USD Million)
- 7.4.4. Italy
- 7.4.4.1. Market estimates and forecasts, 2018 - 2030 (Revenue, USD Million)
- 7.4.5. Spain
- 7.4.5.1. Market estimates and forecasts, 2018 - 2030 (Revenue, USD Million)
- 7.4.6. Sweden
- 7.4.6.1. Market estimates and forecasts, 2018 - 2030 (Revenue, USD Million)
- 7.4.7. Norway
- 7.4.7.1. Market estimates and forecasts, 2018 - 2030 (Revenue, USD Million)
- 7.4.8. Denmark
- 7.4.8.1. Market estimates and forecasts, 2018 - 2030 (Revenue, USD Million)
- 7.4.1. UK
- 7.5. Asia Pacific
- 7.5.1. Japan
- 7.5.1.1. Market estimates and forecasts, 2018 - 2030 (Revenue, USD Million)
- 7.5.2. China
- 7.5.2.1. Market estimates and forecasts, 2018 - 2030 (Revenue, USD Million)
- 7.5.3. India
- 7.5.3.1. Market estimates and forecasts, 2018 - 2030 (Revenue, USD Million)
- 7.5.4. Australia
- 7.5.4.1. Market estimates and forecasts, 2018 - 2030 (Revenue, USD Million)
- 7.5.5. Thailand
- 7.5.5.1. Market estimates and forecasts, 2018 - 2030 (Revenue, USD Million)
- 7.5.6. South Korea
- 7.5.6.1. Market estimates and forecasts, 2018 - 2030 (Revenue, USD Million)
- 7.5.1. Japan
- 7.6. Latin America
- 7.6.1. Brazil
- 7.6.1.1. Market estimates and forecasts, 2018 - 2030 (Revenue, USD Million)
- 7.6.2. Mexico
- 7.6.2.1. Market estimates and forecasts, 2018 - 2030 (Revenue, USD Million)
- 7.6.3. Argentina
- 7.6.3.1. Market estimates and forecasts, 2018 - 2030 (Revenue, USD Million)
- 7.6.1. Brazil
- 7.7. MEA
- 7.7.1. Saudi Arabia
- 7.7.1.1. Market estimates and forecasts, 2018 - 2030 (Revenue, USD Million)
- 7.7.2. South Africa
- 7.7.2.1. Market estimates and forecasts, 2018 - 2030 (Revenue, USD Million)
- 7.7.3. UAE
- 7.7.3.1. Market estimates and forecasts, 2018 - 2030 (Revenue, USD Million)
- 7.7.4. Kuwait
- 7.7.4.1. Market estimates and forecasts, 2018 - 2030 (Revenue, USD Million)
- 7.7.1. Saudi Arabia
Chapter 8. Competitive Landscape
- 8.1. Recent Developments & Impact Analysis, By Key Market Participants
- 8.2. Market Participant Categorization
- 8.2.1. Omnicell, Inc.
- 8.2.1.1. Company overview
- 8.2.1.2. Financial performance
- 8.2.1.3. Product benchmarking
- 8.2.1.4. Strategic initiatives
- 8.2.2. BD
- 8.2.2.1. Company overview
- 8.2.2.2. Financial performance
- 8.2.2.3. Product benchmarking
- 8.2.2.4. Strategic initiatives
- 8.2.3. Omnicell, Inc.
- 8.2.3.1. Company overview
- 8.2.3.2. Financial performance
- 8.2.3.3. Product benchmarking
- 8.2.3.4. Strategic initiatives
- 8.2.4. ScriptPro LLC
- 8.2.4.1. Company overview
- 8.2.4.2. Financial performance
- 8.2.4.3. Product benchmarking
- 8.2.4.4. Strategic initiatives
- 8.2.5. Avery Weigh-Tronix
- 8.2.5.1. Company overview
- 8.2.5.2. Financial performance
- 8.2.5.3. Product benchmarking
- 8.2.5.4. Strategic initiatives
- 8.2.6. PEARSON MEDICAL TECHNOLOGIES
- 8.2.6.1. Company overview
- 8.2.6.2. Financial performance
- 8.2.6.3. Product benchmarking
- 8.2.6.4. Strategic initiatives
- 8.2.7. Accu-Chart
- 8.2.7.1. Company overview
- 8.2.7.2. Financial performance
- 8.2.7.3. Product benchmarking
- 8.2.7.4. Strategic initiatives
- 8.2.8. Baxter
- 8.2.8.1. Company overview
- 8.2.8.2. Financial performance
- 8.2.8.3. Product benchmarking
- 8.2.8.4. Strategic initiatives
- 8.2.9. Capsa Healthcare
- 8.2.9.1. Company overview
- 8.2.9.2. Financial performance
- 8.2.9.3. Product benchmarking
- 8.2.9.4. Strategic initiatives
- 8.2.1. Omnicell, Inc.
