|
|
市場調査レポート
商品コード
1362970
フレキシブルフラットケーブル(FFC)の市場規模、シェア、動向分析レポート:銅線の厚み別、銅線の幅別、用途別、地域別、セグメント別予測、2023年~2030年Flat Flexible Cables Market Size, Share & Trends Analysis Report By Copper Wire Thickness (< 35 Micron, 35 To 50 Micron, 50 To 100 Micron), By Copper Wire Width, By Application, By Region, And Segment Forecasts, 2023 - 2030 |
||||||
|
|
|||||||
カスタマイズ可能
|
|||||||


| フレキシブルフラットケーブル(FFC)の市場規模、シェア、動向分析レポート:銅線の厚み別、銅線の幅別、用途別、地域別、セグメント別予測、2023年~2030年 |
|
出版日: 2023年09月12日
発行: Grand View Research
ページ情報: 英文 110 Pages
納期: 2~10営業日
|

- 全表示
- 概要
- 図表
- 目次
フレキシブルフラットケーブル(FFC)市場の成長と動向:
Grand View Research, Inc.の最新レポートによると、世界のフレキシブルフラットケーブル(FFC)市場規模は2030年までに30億6,000万米ドルに達する見込みです。
同市場は、2023年から2030年にかけてCAGR 10.8%で成長すると予測されています。この成長は、優れた性能を提供する小型化された電子機器に対する需要の増加に起因しています。さらに、エレクトロニクス産業はフレキシブルフラットケーブル(FFC)市場の主要促進要因の1つです。
特にアジア太平洋と中東・アフリカにおける旅客輸送量の増加に起因する次世代民間航空機の旺盛な需要は、民間航空機の生産を促進すると予想されます。航空機生産の増加は、フレキシブルフラットケーブル(FFC)の需要を促進すると予想されます。これらのケーブルは、電子通信機器、ディスプレイ、半導体オートメーション、航空機燃料・システムなど、さまざまな電子機器の内部接続用として航空宇宙生産で使用されています。
フレキシブルフラットケーブル(FFC)は優れた曲げ能力を持ち、同時に軽量で化学薬品に強いです。これらの特性は、自動車産業における軽量車両の製造に非常に適しています。規制によって軽量化された自動車製造の必要性が強調されているため、フレキシブルフラットケーブル(FFC)の需要は今後数年間で増加すると予想されます。この製品は、アルミニウム、ゴム、熱可塑性プラスチック、ポリウレタン、ポリエステル、ポリイミドなど複数の原材料を使用して製造されます。複数の原材料の価格は、サプライチェーンの混乱や需給ギャップなどの要因により変動しやすいです。例えば、アルミニウムは在庫が少ないため価格が上昇しています。
製品タイプは、航空宇宙、自動車、消費財、海洋など、さまざまな最終用途に応じたさまざまなタイプのフレキシブルフラットケーブル(FFC)の生産に携わっています。さらに、企業は顧客の要件に基づいて製品を構築するためのカスタマイズのオプションも提供しています。これにより、企業はより幅広い顧客に対応することができ、他のメーカーと比較して大きな市場シェアを獲得しています。
フレキシブルフラットケーブル(FFC)市場レポートハイライト
- 銅線の厚みに基づくと、50~100ミクロンセグメントがフレキシブルフラットケーブル(FFC)市場を独占し、2022年には47.2%の売上シェアを占めました。この市場セグメントの成長は、自動車、航空宇宙、軍事、産業システムで使用される銅線の厚みが50~100ミクロンのフレキシブルフラットケーブル(FFC)の需要が急増していることに起因しています。
- 銅線の幅に基づくと、1mm以下のセグメントがフレキシブルフラットケーブル(FFC)の市場を独占し、2022年には63.2%の売上シェアを占めました。フレキシブルフラットケーブル(FFC)の幅を小さくすることで、コンパクトで軽量なスマートフォンやセンサーなどの開発が可能になるためです。
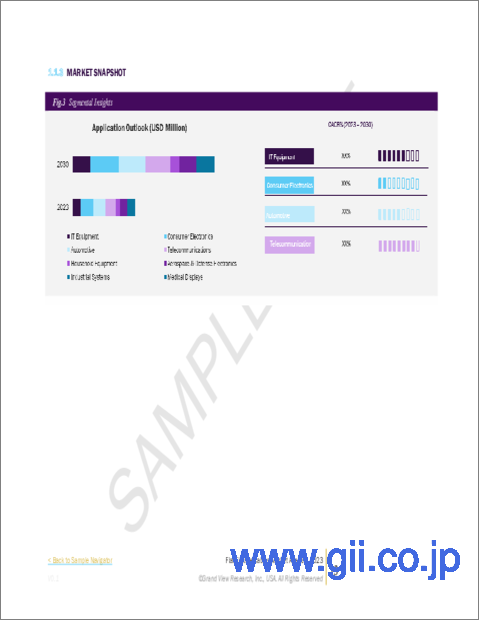
- 2022年のフレキシブルフラットケーブル(FFC)業界は、民生用電子機器用途分野が20.8%の収益シェアでリードしています。大衆の生活水準の向上、都市化の進行、世界の顧客の購買力の急増が、民生用電子機器への需要を促進しています。これが、このセグメントの世界の成長に寄与しています。
- 中東・アフリカのフレキシブルフラットケーブル(FFC)市場は、収益ベースで予測期間中に11.9%という最高のCAGRで拡大すると予測されています。この地域市場の成長は、石油・ガス部門への依存を減らすために、地域経済の多角化と工業化に焦点を当てるために、地域経済の政府が行った取り組みによるものです。このことは、同地域の自動車、航空宇宙・防衛、エレクトロニクス産業の成長に恩恵をもたらし、市場の成長に寄与すると予想されます。
- フレキシブルフラットケーブル(FFC)市場は、地域プレーヤーと多国籍プレーヤーの両方が存在するため、競争が激しいです。これらの企業は、製造設備の生産量を高めるために、さまざまな戦略、特に拡張戦略を採用しています。拡張戦略により、これらの企業はフレキシブルフラットケーブル(FFC)の世界の需要増に対応できるようになり、市場で大きなシェアを獲得しています。
目次
第1章 調査手法と範囲
第2章 エグゼクティブサマリー
第3章 フレキシブルフラットケーブル(FFC)市場の変数、動向、範囲
- 市場系統の見通し
- 世界のケーブル市場
- 業界のバリューチェーン分析
- 原材料の動向
- 製造業の動向
- 規制の枠組み
- アナリストの視点
- 規則
- 市場力学
- 市場促進要因の分析
- 市場抑制要因分析
- 業界の機会
- 業界の課題
- フレキシブルフラットケーブル(FFC)市場- 事業環境分析ツール
- 業界分析:ポーターのファイブフォース分析
- PESTEL分析、 SWOT別
第4章 フレキシブルフラットケーブル(FFC)市場:銅線の厚みの推定・動向分析
- 重要なポイント
- 銅線の厚みの変動分析と市場シェア、2022年と2030年
- 銅線の厚み別、2018年~2030年
- 35ミクロン未満
- 35~50ミクロン
- 50~100ミクロン
第5章 フレキシブルフラットケーブル(FFC)市場:銅線の幅の推定・動向分析
- 重要なポイント
- 銅線の幅の変動分析と市場シェア、2022年と2030年
- 銅線の幅別、2018年~2030年
- 1mm以下
- 1~3mm
- 3mm以上
第6章 フレキシブルフラットケーブル(FFC)市場:用途の推定・動向分析
- 重要なポイント
- 用途の変動分析と市場シェア、2022年と2030年
- 用途別、2018年~2030年
- IT機器
- コンシューマーエレクトロニクス
- 自動車
- 通信
- 家庭用機器
- 航空宇宙・防衛エレクトロニクス
- 産業システム
- 医療用ディスプレイ
第7章 フレキシブルフラットケーブル(FFC)市場:地域の推定・動向分析
- 重要なポイント
- 地域の市場シェア分析、2022年および2030年
- 北米
- 北米のフレキシブルフラットケーブル(FFC)市場の推定と予測、2018年~2030年
- 米国
- カナダ
- メキシコ
- 欧州
- 欧州のフレキシブルフラットケーブル(FFC)市場の推定と予測、2018年~2030年
- ドイツ
- 英国
- フランス
- スペイン
- イタリア
- アジア太平洋地域
- アジア太平洋地域のフレキシブルフラットケーブル(FFC)市場の予測と2018年~2030年
- 中国
- インド
- 日本
- 中南米
- 中南米のフレキシブルフラットケーブル(FFC)市場の予測と2018年~2030年
- 中東とアフリカ
- 中東とアフリカのフレキシブルフラットケーブル(FFC)市場の推定と予測、2018年~2030年
第8章 サプライヤーインテリジェンス
- Kraljicマトリックス
- エンゲージメントモデル
- 交渉戦略
- 調達のベストプラクティス
- ベンダーの選択基準
- 原材料サプライヤー一覧
- エンドユーザーのリスト
- 機器サプライヤー一覧
第9章 競合情勢
- 主要市場参入企業による最近の動向と影響分析
- 競合の分類
- 企業の市場での位置づけ
- 企業ヒートマップ分析、2022年
- 企業の市場シェア分析、2022年
- 戦略マッピング、2022年
- 市場参入戦略
- ケーススタディ
- 会社一覧
- Johnson Electric Holdings Limited.
- Proterial Cable America, Inc.
- Quadrangle Products
- Samtec
- Wurth Elektronik
- Adam Tech
- SUMIDA CORPORATION
- NICOMATIC
- Molex
- Axon Cable
- GCT(Global Connector Technology)
- AUK
- Alysium-Tech GmbH
List of Tables
- Table 1 Flat flexible cables Market Estimates & Forecast, By Copper Wire Thickness, 2018 - 2030 (Tons)
- Table 2 Flat flexible cables Market Estimates & Forecast, By Copper Wire Thickness, 2018 - 2030 (USD Million)
- Table 3 Flat Flexible Cables Market Estimates & Forecast, By Copper Wire Width, 2018 - 2030 (Tons)
- Table 4 Flat Flexible Cables Market Estimates & Forecast, By Copper Wire Width, 2018 - 2030 (USD Million)
- Table 5 Flat Flexible Cables Market Estimates & Forecast, By Application, 2018 - 2030 (Tons)
- Table 6 Flat Flexible Cables Market Estimates & Forecast, By Application, 2018 - 2030 (USD Million)
- Table 7 Recent Developments & Impact Analysis, By Key Market Participants
- Table 8 Company Heat Map Analysis, 2022
List of Figures
- Fig. 1 Flat flexible cables market segmentation
- Fig. 2 Information Procurement
- Fig. 3 Data Analysis Models
- Fig. 4 Market Formulation And Validation
- Fig. 5 Data Validating & Publishing
- Fig. 6 Regional Outlook
- Fig. 7 Segmental Outlook
- Fig. 8 Segmental Outlook
- Fig. 9 Competitive Outlook
- Fig. 10 Flat flexible cables value chain analysis
- Fig. 11 Global natural rubber production, (Million tons)
- Fig. 12 U.S. polyester price index (USD)
- Fig. 13 U.S. polypropylene price trend (USD/Kiloton)
- Fig. 14 Market driver impact analysis
- Fig. 15 Electric car sales (USD Million)
- Fig. 16 Global passenger and freight traffic, 2010-2022 (Billion individuals) (Billion ton-Km)
- Fig. 17 In-service aircraft reaching 25 years of age which needs replacement (No. of units)
- Fig. 18 Market restraints impact analysis
- Fig. 19 Prices of aluminum, 2017-2023 (USD/Ton)
- Fig. 20 Global crude oil prices (USD per barrel)
- Fig. 21 Industry Analysis: Porter's Five Forces
- Fig. 22 PESTEL analysis, by SWOT
- Fig. 23 Copper wire thickness: Key Takeaways
- Fig. 24 Copper Wire Thickness: Market Share, 2022 & 2030
- Fig. 25 < 35 micron flat flexible cables market estimates & forecasts, 2018 - 2030 (Tons) (USD Million)
- Fig. 26 35 to 50 micron flat flexible cables market estimates & forecasts, 2018 - 2030 (Tons) (USD Million)
- Fig. 27 50 to 100 micron flat flexible cables market estimates & forecasts, 2018 - 2030 (Tons) (USD Million)
- Fig. 28 Copper Wire Width: Key Takeaways
- Fig. 29 Copper Wire Width: Market Share, 2022 & 2030
- Fig. 30 <= 1 mm flat flexible cables market estimates & forecasts, 2018 - 2030 (Tons) (USD Million)
- Fig. 31 1 to 3 mm flat flexible cables market estimates & forecasts, 2018 - 2030 (Tons) (USD Million)
- Fig. 32 3 mm <= flat flexible cables market estimates & forecasts, 2018 - 2030 (Tons) (USD Million)
- Fig. 33 Application: Key Takeaways
- Fig. 34 Application: Market Share, 2022 & 2030
- Fig. 35 Flat flexible cables market estimates & forecasts, by IT equipment, 2018 - 2030 (Tons) (USD Million)
- Fig. 36 Flat flexible cables market estimates & forecasts, by consumer electronics, 2018 - 2030 (Tons) (USD Million)
- Fig. 37 Flat flexible cables market estimates & forecasts, by automotive, 2018 - 2030 (Tons) (USD Million)
- Fig. 38 Flat flexible cables market estimates & forecasts, by telecommunications, 2018 - 2030 (Tons) (USD Million)
- Fig. 39 Flat flexible cables market estimates & forecasts, by household equipment, 2018 - 2030 (Tons) (USD Million)
- Fig. 40 Flat flexible cables market estimates & forecasts, by aerospace & defense electronics, 2018 - 2030 (Tons) (USD Million)
- Fig. 41 Flat flexible cables market estimates & forecasts, by industrial systems, 2018 - 2030 (Tons) (USD Million)
- Fig. 42 Flat flexible cables market estimates & forecasts, by medical displays, 2018 - 2030 (Tons) (USD Million)
- Fig. 43 Region, 2022 & 2030, (USD Billion)
- Fig. 44 Regional marketplace: Key takeaways
- Fig. 45 Regional marketplace: Key takeaways
- Fig. 46 North America flat flexible cables market estimates & forecasts, 2018 - 2030 (Tons) (USD Million)
- Fig. 47 U.S. flat flexible cables market estimates & forecasts, 2018 - 2030 (Tons) (USD Million)
- Fig. 48 Canada flat flexible cables market estimates & forecasts, 2018 - 2030 (Tons) (USD Million)
- Fig. 49 Mexico flat flexible cables market estimates & forecasts, 2018 - 2030 (Tons) (USD Million)
- Fig. 50 Europe flat flexible cables market estimates & forecasts, 2018 - 2030 (Tons) (USD Million)
- Fig. 51 Germany flat flexible cables market estimates & forecasts, 2018 - 2030 (Tons) (USD Million)
- Fig. 52 France flat flexible cables market estimates & forecasts, 2018 - 2030 (Tons) (USD Million)
- Fig. 53 UK flat flexible cables market estimates & forecasts, 2018 - 2030 (Tons) (USD Million)
- Fig. 54 Spain flat flexible cables market estimates & forecasts, 2018 - 2030 (Tons) (USD Million)
- Fig. 55 Italy flat flexible cables market estimates & forecasts, 2018 - 2030 (Tons) (USD Million)
- Fig. 56 Asia Pacific flat flexible cables market estimates & forecasts, 2018 - 2030 (Tons) (USD Million)
- Fig. 57 China flat flexible cables market estimates & forecasts, 2018 - 2030 (Tons) (USD Million)
- Fig. 58 India flat flexible cables market estimates & forecasts, 2018 - 2030 (Tons) (USD Million)
- Fig. 59 Japan flat flexible cables market estimates & forecasts, 2018 - 2030 (Tons) (USD Million)
- Fig. 60 Central & South America flat flexible cables market estimates & forecasts, 2018 - 2030 (Tons) (USD Million)
- Fig. 61 Middle East & Africa flat flexible cables market estimates & forecasts, 2018 - 2030 (Tons) (USD Million)
- Fig. 62 Kraljic Matrix
- Fig. 63 Engagement Model
- Fig. 64 Sourcing Best Practices
- Fig. 65 Vendor Selection Criteria
- Fig. 66 Competition Categorization
- Fig. 67 Company Market Positioning
- Fig. 68 Company market share analysis, 2022
- Fig. 69 Strategy Mapping, 2022
Flat Flexible Cables Market Growth & Trends:
The global flat flexible cables market size is expected to reach USD 3.06 billion by 2030, according to a new report by Grand View Research, Inc.. The market is expected to advance at a CAGR of 10.8% from 2023 to 2030. This growth can be attributed to the increasing demand for miniaturized electronic devices that offer superior performance. Furthermore, the electronics industry is one of the key drivers of the market for flat flexible cables.
Strong demand for next-generation commercial aircraft owing to the increasing passenger traffic, especially in the Asia Pacific and the Middle East & Africa, is expected to drive the production of commercial aircraft. The increased aircraft production is anticipated to fuel the demand for flat flexible cables. These cables are used in aerospace production for internal connections in various electronic equipment such as electronic communication equipment, displays, semiconductor automation, and aircraft fuel & systems, among others.
Flat flexible cables offer superior bending capability and, at the same time, have low weight and are resistant to chemicals. These attributes make them extremely suitable for manufacturing lightweight vehicles in the automotive industry. With regulations emphasizing the need for lighter-weight vehicle manufacturing, the demand for flat flexible cables is expected to rise in the coming years. The product is manufactured using several raw materials such as aluminum, rubber, thermoplastic, polyurethane, polyester, and polyimide. The prices of several raw materials are susceptible to fluctuations on account of factors such as disruptions in the supply chain and the demand-supply gap. For instance, aluminum prices are increasing owing to its low inventory.
Manufacturers are involved in the production of various types of flat flexible cables as per their application in different end-use areas such as aerospace, automotive, consumer goods, marine, etc. Additionally, companies also offer the option of customization to build a product based on customers' requirements. This helps the company cater to a wider audience, thereby gaining significant market share as compared to other manufacturers.
Flat Flexible Cables Market Report Highlights:
- Based on copper wire thickness, the 50 to 100-micron segment dominated the market for flat flexible cables, accounting for a revenue share of 47.2% in 2022. The growth of this market segment can be attributed to the surging demand for flat flexible cables with a copper wire thickness of 50 to 100 microns for use in automotive, aerospace, military, and industrial systems
- Based on copper wire width, the <= 1 mm segment dominated the market for flat flexible cables, accounting for a revenue share of 63.2% in 2022. Increasing miniaturization of products in various industries is fueling the growth of this segment, as smaller width of flat flexible cables enables the development of compact and lightweight smartphones, sensors, etc.
- The consumer electronics application segment led the flat flexible cables industry in 2022 with a revenue share of 20.8%. Improvements in the living standards of the masses, ongoing urbanization, and the surging purchasing power of customers globally are fueling the demand for consumer electronics. This, in turn, is contributing to the growth of this segment globally
- The market for flat flexible cables in the Middle East & Africa is projected to expand at the highest CAGR of 11.9% over the forecast period, in terms of revenue. The growth of the regional market is owing to the initiatives undertaken by governments of regional economies to diversify and focus on industrialization to reduce their dependence on the oil & gas sector. This is expected to benefit the growth of the automotive, aerospace & defense, and electronics industries in the region, thereby contributing to the growth of the market
- The market for flat flexible cables is highly competitive, owing to the presence of both regional and multinational players. These companies have adopted various strategies, especially expansions, to enhance the output of their manufacturing facilities. An expansion strategy enables these companies to cater to the increasing global demand for flat flexible cables, thus gaining a significant share of the market
Table of Contents
Chapter 1. Methodology and Scope
- 1.1. Market Segmentation and Scope
- 1.2. Research Methodology
- 1.3. Research Scope & Assumption
- 1.4. Information Procurement
- 1.4.1. Purchased Database
- 1.4.2. GVR's Internal Database
- 1.4.3. Secondary Sources & Third-Party Perspectives
- 1.4.4. Primary Research
- 1.5. Information Analysis
- 1.5.1. Data Analysis Models
- 1.6. Market Formulation & Data Visualization
- 1.7. Data Validation & Publishing
Chapter 2. Executive Summary
- 2.1. Market Outlook
- 2.2. Segmental Outlook
- 2.3. Competitive Insights
Chapter 3. Flat Flexible Cables Market Variables, Trends & Scope
- 3.1. Market Lineage Outlook
- 3.1.1. Global Cables Market
- 3.2. Industry Value Chain Analysis
- 3.2.1. Raw Material Trend
- 3.2.1.1. Rubber
- 3.2.1.2. Polyester
- 3.2.1.3. Polypropylene
- 3.2.2. Manufacturing Trends
- 3.2.1. Raw Material Trend
- 3.3. Regulatory Framework
- 3.3.1. Analyst Perspective
- 3.3.2. Regulations
- 3.4. Market Dynamics
- 3.4.1. Market Driver Analysis
- 3.4.1.1. Growth In The Transportation Industry
- 3.4.1.2. Rise In Passenger And Freight Traffic
- 3.4.2. Market Restraint Analysis
- 3.4.2.1. Volatile Raw Material Prices
- 3.4.3. Industry Opportunity
- 3.4.3.1. Growth Of The Electronic Industry
- 3.4.4. Industry Challenges
- 3.4.1. Market Driver Analysis
- 3.5. Flat Flexible Cables Market - Business Environment Analysis Tools
- 3.5.1. Industry Analysis: Porter's Five Forces
- 3.5.2. Pestel Analysis, By Swot
Chapter 4. Flat Flexible Cables Market: Copper Wire Thickness Estimates & Trend Analysis
- 4.1. Key Takeaways
- 4.2. Copper Wire Thickness Movement Analysis & Market Share, 2022 & 2030
- 4.3. Flat Flexible Cables Market Estimates & Forecast, By Copper Wire Thickness, 2018 - 2030 (USD Million) (Tons)
- 4.4. < 35 Micron
- 4.5. 35 to 50 Micron
- 4.6. 50 to 100 Micron
Chapter 5. Flat Flexible Cables Market: Copper Wire Width Estimates & Trend Analysis
- 5.1. Key Takeaways
- 5.2. Copper Wire Width Movement Analysis & Market Share, 2022 & 2030
- 5.3. Flat Flexible Cables Market Estimates & Forecast, By Copper Wire Width, 2018 - 2030 (USD Million) (Tons)
- 5.4. <= 1 mm
- 5.5. 1 to 3 mm
- 5.6. 3 mm <=
Chapter 6. Flat Flexible Cables Market: Application Estimates & Trend Analysis
- 6.1. Key Takeaways
- 6.2. Application Movement Analysis & Market Share, 2022 & 2030
- 6.3. Flat Flexible Cables Market Estimates & Forecast, By Application, 2018 - 2030 (USD Million) (Tons)
- 6.4. IT Equipment
- 6.5. Consumer Electronics
- 6.6. Automotive
- 6.7. Telecommunications
- 6.8. Household Equipment
- 6.9. Aerospace & Defense Electronics
- 6.10. Industrial Systems
- 6.11. Medical Displays
Chapter 7. Flat Flexible Cables Market: Regional Estimates & Trend Analysis
- 7.1. Key Takeaways
- 7.2. Regional Market Share Analysis, 2022 & 2030
- 7.3. North America
- 7.3.1. North America flat flexible cables market estimates & Forecasts, 2018 - 2030 (Tons) (USD million)
- 7.3.2. U.S.
- 7.3.2.1. U.S. flat flexible cables market estimates & Forecasts, 2018 - 2030 (Tons) (USD million)
- 7.3.3. Canada
- 7.3.3.1. Canada flat flexible cables market estimates & Forecasts, 2018 - 2030 (Tons) (USD million)
- 7.3.4. Mexico
- 7.3.4.1. Mexico flat flexible cables market estimates & Forecasts, 2018 - 2030 (Tons) (USD million)
- 7.4. Europe
- 7.4.1. Europe flat flexible cables market estimates & Forecasts, 2018 - 2030 (Tons) (USD Million)
- 7.4.2. Germany
- 7.4.2.1. Germany flat flexible cables market estimates & Forecasts, 2018 - 2030 (Tons) (USD Million)
- 7.4.3. UK
- 7.4.3.1. UK flat flexible cables market estimates & Forecasts, 2018 - 2030 (Tons) (USD Million)
- 7.4.4. France
- 7.4.4.1. France flat flexible cables market estimates & Forecasts, 2018 - 2030 (Tons) (USD Million)
- 7.4.5. Spain
- 7.4.5.1. Spain flat flexible cables market estimates & Forecasts, 2018 - 2030 (Tons) (USD Million)
- 7.4.6. Italy
- 7.4.6.1. Italy flat flexible cables market estimates & Forecasts, 2018 - 2030 (Tons) (USD Million)
- 7.5. Asia Pacific
- 7.5.1. Asia Pacific flat flexible cables market estimates & Forecasts, 2018 - 2030 (Tons) (USD Million)
- 7.5.2. China
- 7.5.2.1. China flat flexible cables market estimates & Forecasts, 2018 - 2030 (Tons) (USD Million)
- 7.5.3. India
- 7.5.3.1. India flat flexible cables market estimates & Forecasts, 2018 - 2030 (Tons) (USD Million)
- 7.5.4. Japan
- 7.5.4.1. Japan flat flexible cables market estimates & Forecasts, 2018 - 2030 (Tons) (USD Million)
- 7.6. Central & South America
- 7.6.1. Central & South America flat flexible cables market estimates & Forecasts, 2018 - 2030 (Tons) (USD million)
- 7.7. Middle East & Africa
- 7.7.1. Middle East & Africa flat flexible cables market estimates & Forecasts, 2018 - 2030 (Tons) (USD million)
Chapter 8. Supplier Intelligence
- 8.1. Kraljic Matrix
- 8.2. Engagement Model
- 8.3. Negotiation Strategies
- 8.4. Sourcing Best Practices
- 8.5. Vendor Selection Criteria
- 8.6. List of Raw Material Suppliers
- 8.7. List of End Users
- 8.8. List of Equipment Suppliers
Chapter 9. Competitive Landscape
- 9.1. Recent Developments & Impact Analysis, By Key Market Participants
- 9.2. Competition Categorization
- 9.3. Company Market Positioning
- 9.4. Company Heat Map Analysis, 2022
- 9.5. Company Market Share Analysis, 2022
- 9.6. Strategy Mapping, 2022
- 9.6.1. Market Entry Strategies
- 9.6.2. Case Studies
- 9.7. Company Listing
- 9.7.1. Johnson Electric Holdings Limited.
- 9.7.1.1. Company Overview
- 9.7.1.2. Financial Performance
- 9.7.1.3. Product Benchmarking
- 9.7.1.4. Strategic Initiatives
- 9.7.2. Proterial Cable America, Inc.
- 9.7.2.1. Company Overview
- 9.7.2.2. Financial Performance
- 9.7.2.3. Product Benchmarking
- 9.7.2.4. Strategic Initiatives
- 9.7.3. Quadrangle Products
- 9.7.3.1. Company Overview
- 9.7.3.2. Financial Performance
- 9.7.3.3. Product Benchmarking
- 9.7.3.4. Strategic Initiatives
- 9.7.4. Samtec
- 9.7.4.1. Company Overview
- 9.7.4.2. Financial Performance
- 9.7.4.3. Product Benchmarking
- 9.7.4.4. Strategic Initiatives
- 9.7.5. Wurth Elektronik
- 9.7.5.1. Company Overview
- 9.7.5.2. Financial Performance
- 9.7.5.3. Product Benchmarking
- 9.7.5.4. Strategic Initiatives
- 9.7.6. Adam Tech
- 9.7.6.1. Company Overview
- 9.7.6.2. Financial Performance
- 9.7.6.3. Product Benchmarking
- 9.7.6.4. Strategic Initiatives
- 9.7.7. SUMIDA CORPORATION
- 9.7.7.1. Company Overview
- 9.7.7.2. Financial Performance
- 9.7.7.3. Product Benchmarking
- 9.7.7.4. Strategic Initiatives
- 9.7.8. NICOMATIC
- 9.7.8.1. Company Overview
- 9.7.8.2. Financial Performance
- 9.7.8.3. Product Benchmarking
- 9.7.8.4. Strategic Initiatives
- 9.7.9. Molex
- 9.7.9.1. Company Overview
- 9.7.9.2. Financial Performance
- 9.7.9.3. Product Benchmarking
- 9.7.9.4. Strategic Initiatives
- 9.7.10. Axon Cable
- 9.7.10.1. Company Overview
- 9.7.10.2. Financial Performance
- 9.7.10.3. Product Benchmarking
- 9.7.10.4. Strategic Initiatives
- 9.7.11. GCT (Global Connector Technology)
- 9.7.11.1. Company Overview
- 9.7.11.2. Financial Performance
- 9.7.11.3. Product Benchmarking
- 9.7.11.4. Strategic Initiatives
- 9.7.12. AUK
- 9.7.12.1. Company Overview
- 9.7.12.2. Financial Performance
- 9.7.12.3. Product Benchmarking
- 9.7.12.4. Strategic Initiatives
- 9.7.13. Alysium-Tech GmbH
- 9.7.13.1. Company Overview
- 9.7.13.2. Financial Performance
- 9.7.13.3. Product Benchmarking
- 9.7.13.4. Strategic Initiatives
- 9.7.1. Johnson Electric Holdings Limited.