|
|
市場調査レポート
商品コード
1321430
二日酔い対策製品の市場規模、シェア、動向分析レポート:製品別、流通チャネル別、タイプ別、地域別、セグメント予測、2023年~2030年Hangover Cure Products Market Size, Share & Trends Analysis Report By Product (Solutions, Patches), By Distribution Channel (Online, Offline), By Type, By Region, And Segment Forecasts, 2023 - 2030 |
||||||
|
|
|||||||
カスタマイズ可能
|
|||||||


| 二日酔い対策製品の市場規模、シェア、動向分析レポート:製品別、流通チャネル別、タイプ別、地域別、セグメント予測、2023年~2030年 |
|
出版日: 2023年07月25日
発行: Grand View Research
ページ情報: 英文 127 Pages
納期: 2~10営業日
|

- 全表示
- 概要
- 図表
- 目次
二日酔い対策製品市場の成長と動向
Grand View Research, Inc.の最新レポートによると、世界の二日酔い対策製品の市場規模は2030年までに61億8,000万米ドルに達し、2023年から2030年までのCAGRは14.8%で成長すると推定されます。
ここ数年、国内では二日酔い対策製品の売上が急増しています。錠剤/カプセルの世界の普及拡大は、市場成長に好影響を与えると予測されます。
二日酔い対策製品の世界の普及と認知度の向上により、市場は予測期間中に成長するとみられます。市場プレイヤーは、より多くの人々にリーチするため、様々な流通チャネルを活用して存在感を拡大しています。近年、世界的に機能性食品・飲料に対する消費者の関心が顕著に高まっています。そのため、エネルギー、精神の明瞭さ、気分を高め、ストレスを軽減する成分が、今後数年間で消費者の間で支持を集めると予想されます。このような機能性食品・飲料への動向は、二日酔い対策製品メーカーにチャンスをもたらします。
さらに、eコマースの普及により、二日酔い対策製品のオンライン販売は世界的に容易になっています。この市場開拓は、市場プレーヤーにさらなるビジネスチャンスをもたらすと予想されます。様々な流通チャネルを通じた革新的な二日酔い対策製品の導入は、今後の市場成長を促進する上で重要な役割を果たすと予想されます。
二日酔い対策製品市場レポートハイライト
- 製品別では、二日酔い対策錠剤・カプセルが2022年に36.7%の市場シェアを占めました。ジヒドロミリセチンを含む二日酔い対策タブレットは世界中で主に消費されています。水分補給溶液企業のNuunは、エネルギーレベルを高め、最適な水分補給効果をもたらす機能性発泡錠剤を提供しています。このような市場各社の取り組みは、予測期間中の同セグメントの成長にプラスの影響を与えると思われます。
- 治療に基づくと、水分補給、体内の抗酸化レベルの向上、二日酔いの治療、アルコール副産物の中和などの利点を提供する治療法に対する消費者の志向の変化が、市場の成長をさらに促進すると予想されます。二日酔い対策製品市場は、2030年までに64.8%の市場シェアを占めると予想されます。
- オンラインチャネルは二日酔い対策製品の販売における主要プラットフォームであり、2022年の世界シェアは57.7%です。FMCG企業や製薬会社は、リーチと顧客基盤を拡大するため、CVS HealthやAmazon.comのようなサードパーティアグリゲーターとパートナーシップを結ぶことが増えており、このセグメントの成長にプラスの影響を与えています。
- 市場のプレーヤーは、自社製品を二日酔い予防の効果的なソリューションとして積極的に宣伝しており、これがこれらの製品の採用拡大に寄与しています。2022年6月、スウェーデンのMyrkl社は英国で「飲酒前用ピル」を発表し、アルコールが肝臓に到達する前に分解し、有毒なアセトアルデヒドの生成を防ぐと主張しました。
目次
第1章 調査手法と範囲
- 市場セグメンテーションと範囲
- 市場の定義
- 情報調達
- 情報分析
- 市場の形成とデータの視覚化
- データの検証と公開
第2章 エグゼクティブサマリー
第3章 二日酔い対策製品の市場変数と動向
- 市場系統の見通し
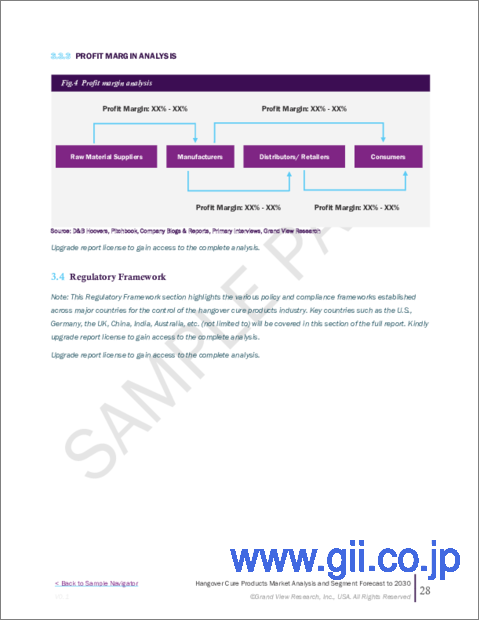
- 業界のバリューチェーン分析
- サプライヤーの見通し
- 技術動向
- 市場力学
- 市場促進要因分析
- 市場抑制要因分析
- 業界の課題
- 業界の機会
- 業界分析ツール
- 業界分析- ポーター
- 市場参入戦略
第4章 消費者行動分析
- 人口統計分析
- 消費者の動向と好み
- 購入決定に影響を与える要因
- 消費者向けサービスプロバイダーの採用
- 所見と推奨事項
第5章 二日酔い対策製品市場:製品の分析と推定
- 製品の変動分析と市場シェア、2022年と2030年
- 溶液
- 錠剤・カプセル
- 粉末
- パッチ
第6章 二日酔い対策製品市場:タイプの分析と推定
- タイプの変動分析と市場シェア、2022年と2030年
- 二日酔い予防
- 二日酔い治療
第7章 二日酔い対策製品市場:流通チャネルの分析と推定
- 流通チャネルの変動分析と市場シェア、2022年と2030年
- オンライン
- オフライン
第8章 二日酔い対策製品市場:地域の推定・動向分析
- 二日酔い対策製品市場:地域の展望
- 北米
- 製品別、2017~2030年
- タイプ別、2017~2030年
- 流通チャネル別、2017~2030年
- 米国
- カナダ
- メキシコ
- 欧州
- 製品別、2017~2030年
- タイプ別、2017~2030年
- 流通チャネル別、2017~2030年
- 英国
- ドイツ
- フランス
- スペイン
- ロシア
- アジア太平洋地域
- 製品別、2017~2030年
- タイプ別、2017~2030年
- 流通チャネル別、2017~2030年
- 中国
- インド
- 日本
- 韓国
- オーストラリア
- 中南米
- 製品別、2017~2030年
- タイプ別、2017~2030年
- 流通チャネル別、2017~2030年
- ブラジル
- アルゼンチン
- 中東・アフリカ
- 製品別、2017~2030年
- タイプ別、2017~2030年
- 流通チャネル別、2017~2030年
- 南アフリカ
- トルコ
第9章 二日酔い対策製品市場:競合情勢
- 主要市場参入企業による最近の動向と影響分析
- 企業の分類
- 参入企業の概要
- 財務実績
- サービスプロバイダーのベンチマーク
- 企業市場シェア分析、2022年(金額シェア%)
- 企業ヒートマップ分析
- 戦略マッピング
- パートナーシップ
- サービスプロバイダーの開始
- 主要企業のリスト:
- Abbott
- Bayer AG
- More Labs
- The Himalaya Drug Company
- Rally Labs LLC(Blowfish)
- Flyby
- Drinkwel, LLC
- Cheers Health
- Liquid IV, Inc.
- DOTSHOT
- AfterDrink Ltd.
- Toniiq
- Purple Tree Labs
- No Days Wasted
- LES Labs(Detoxx)
- EZ Lifestyle(Over EZ)
- DrinkAde
- Kaplan Laboratory, LLC(H-PROOF)
- Bytox
- Cheal Hangover Patch
- Party Patch
- Rebound Hangover Patch
- TRIO Patch
- SmartPatches
- D-Tox Hangover Patches
- La Mend, Inc.(The Good Patch)
- RallyPatch, LLC
- Ozmo Patch
- Wet Buffalo Patch
- LiveToShine
- AWKN
List of Tables
- Table 1 Hangover cure products market - Driving factor market analysis
- Table 2 Hangover cure products market - Restraint factor market analysis
- Table 3 Hangover cure solutions market estimates and forecast, 2017 - 2030 (USD Million)
- Table 4 Hangover cure tablets/ capsules market estimates and forecast, 2017 - 2030 (USD Million)
- Table 5 Hangover cure powder market estimates and forecast, 2017 - 2030 (USD Million)
- Table 6 Hangover cure patches market estimates and forecast, 2017 - 2030 (USD Million)
- Table 7 Hangover prevention market estimates and forecast, 2017 - 2030 (USD Million)
- Table 8 Hangover cure solutions market estimates and forecast, 2017 - 2030 (USD Million)
- Table 9 Hangover remedies market estimates and forecast through online distribution, 2017 - 2030 (USD Million)
- Table 10 Hangover cure products market estimates and forecast through offline distribution, 2017 - 2030 (USD Million)
- Table 11 North America hangover cure products market estimates and forecast, 2017 - 2030 (USD Million)
- Table 12 Europe hangover cure products market estimates and forecast, 2017 - 2030 (USD Million)
- Table 13 Asia Pacific hangover cure products market estimates and forecast, 2017 - 2030 (USD Million)
- Table 14 Central and South America hangover cure products market estimates and forecast, 2017 - 2030 (USD Million)
- Table 15 Middle East & Africa hangover cure products market estimates and forecast, 2017 - 2030 (USD Million)
- Table 16 Company categorization
List of Figures
- Fig. 1 Hangover Cure Products Market Snapshot
- Fig. 2 Hangover Cure Products Market Segmentation & Scope
- Fig. 3 Hangover Cure Products Market Penetration & Growth Prospect Mapping
- Fig. 4 Hangover Cure Products Market Value Chain Analysis
- Fig. 5 Hangover Cure Products Market Dynamics
- Fig. 6 Hangover Cure Products Market Porter's Analysis
- Fig. 7 Hangover Cure Products Market: Product Movement Analysis
- Fig. 8 Hangover Cure Products Market: Type Movement Analysis
- Fig. 9 Hangover Cure Products Market: Distribution Channel Movement Analysis
- Fig. 10 Hangover Cure Products Market: Regional Movement Analysis
Hangover Cure Products Market Growth & Trends
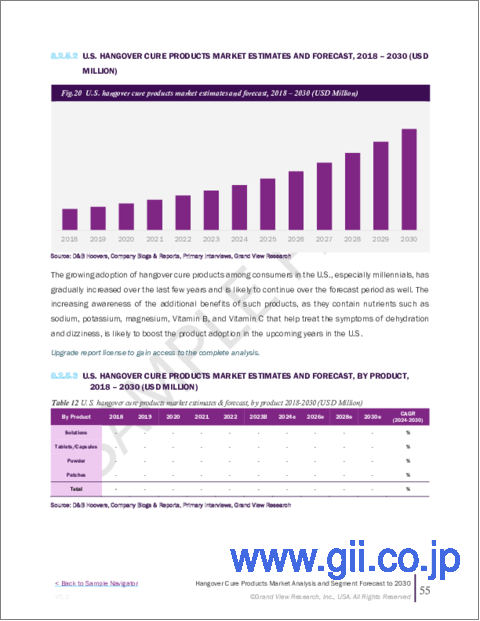
The global hangover cure products market size is estimated to reach USD 6.18 billion by 2030, and grow at a CAGR of 14.8% from 2023 to 2030, according to a new report by Grand View Research, Inc. Over the past few years, the sales of hangover cure products have skyrocketed in the country. This increased availability has soared product adoption among Generation Z and millennials in the U.S. Increasing penetration of tablets/capsules worldwide is anticipated to have a positive impact on the market growth.
The market is poised for growth during the forecast period due to the increasing adoption of cure products and the growing awareness about anti-hangover products globally. Market players are expanding their presence by utilizing various distribution channels to reach a wider audience. In recent years, there has been a notable rise in consumer interest in functional foods and drinks worldwide. Therefore, ingredients that enhance energy, mental clarity, and mood, and reduce stress are expected to gain traction among consumers in the coming years. This trend towards functional foods and drinks presents opportunities for manufacturers of hangover cure products.
In addition, the widespread adoption of e-commerce has facilitated easy online distribution of hangover cure products globally. This development is anticipated to provide further opportunities for market players. The introduction of innovative hangover cure products through various distribution channels will play a vital role in driving market growth in the future.
Hangover Cure Products Market Report Highlights
- In terms of product, hangover cure tablets/capsules held a market share of 36.7% in 2022. Hangover cure tablets containing dihydromyricetin are majorly consumed worldwide. Nuun, a hydration solutions company, offers functional effervescent tablets to enhance energy levels and provides optimum hydration benefits. Such initiatives by market players will have a positive impact on segment growth over the forecast period
- Based on remedies, the shift in consumer inclination for remedies that offer benefits like rehydration, boosting antioxidant levels in the body, treating hangovers, and neutralizing alcohol by-products are expected to further drive the market's growth. The hangover remedies market is expected to hold a 64.8% market share by 2030
- The online channel is the leading platform for the sale of hangover cure products, with a global share of 57.7% in 2022. To expand their reach and customer base, FMCG companies and pharmaceutical firms are increasingly forging partnerships with third-party aggregators like CVS Health and Amazon.com to positively influence the segment's growth
- Market players are actively promoting their products as effective solutions for hangover prevention, which has contributed to the increased adoption of these products. In June 2022, a Swedish company, Myrkl, introduced a "pre-drinking pill" in the UK, claiming that it breaks down alcohol before it reaches the liver, thereby preventing the formation of toxic acetaldehyde
Table of Contents
Chapter 1. Methodology and Scope
- 1.1. Market Segmentation & Scope
- 1.2. Market Definition
- 1.3. Information Procurement
- 1.3.1. Purchased Database
- 1.3.2. GVR's Internal Database
- 1.3.3. Secondary Sources & Third-Party Perspectives
- 1.3.4. Primary Research
- 1.4. Information Analysis
- 1.4.1. Data Analysis Models
- 1.5. Market Formulation & Data Visualization
- 1.6. Data Validation & Publishing
Chapter 2. Executive Summary
- 2.1. Market Outlook
- 2.2. Segmental Outlook
- 2.3. Regional Outlook
Chapter 3. Hangover Cure Products Market Variables & Trends
- 3.1. Market Lineage Outlook
- 3.2. Industry Value Chain Analysis
- 3.2.1. Suppliers Outlook
- 3.2.2. Technology Trends
- 3.3. Market Dynamics
- 3.3.1. Market Driver Analysis
- 3.3.2. Market Restraint Analysis
- 3.3.3. Industry Challenges
- 3.3.4. Industry Opportunities
- 3.4. Industry Analysis Tools
- 3.4.1. Industry Analysis - Porter's
- 3.4.1.1. Supplier Power
- 3.4.1.2. Buyer Power
- 3.4.1.3. Substitution Threat
- 3.4.1.4. Threat from New Entrant
- 3.4.1.5. Competitive Rivalry
- 3.4.1. Industry Analysis - Porter's
- 3.5. Market Entry Strategies
Chapter 4. Consumer Behavior Analysis
- 4.1. Demographic Analysis
- 4.2. Consumer Trends and Preferences
- 4.3. Factors Affecting Buying Decision
- 4.4. Consumer Service Provider Adoption
- 4.5. Observations & Recommendations
Chapter 5. Hangover Cure Products Market: Product Analysis & Estimates
- 5.1. Product Movement Analysis & Market Share, 2022 & 2030
- 5.1.1. Solutions
- 5.1.1.1. Hangover cure solution market estimates and forecast, 2017 - 2030 (USD Million)
- 5.1.2. Tablets/Capsules
- 5.1.2.1. Hangover cure tablets/Capsules market estimates and forecast, 2017 - 2030 (USD Million)
- 5.1.3. Powder
- 5.1.3.1. Hangover cure powder market estimates and forecast, 2017 - 2030 (USD Million)
- 5.1.4. Patches
- 5.1.4.1. Hangover cure patches market estimates and forecast, 2017 - 2030 (USD Million)
- 5.1.1. Solutions
Chapter 6. Hangover Cure Products Market: Type Analysis & Estimates
- 6.1. Type Movement Analysis & Market Share, 2022 & 2030
- 6.1.1. Hangover prevention
- 6.1.1.1. Hangover prevention market estimates and forecast, 2017 - 2030 (USD Million)
- 6.1.2. Hangover remedies
- 6.1.2.1. Hangover remedies market estimates and forecast, 2017 - 2030 (USD Million)
- 6.1.1. Hangover prevention
Chapter 7. Hangover Cure Products Market: Distribution Channel Analysis & Estimates
- 7.1. Distribution Channel Movement Analysis & Market Share, 2022 & 2030
- 7.1.1. Online
- 7.1.1.1. Hangover cure products market, through online distribution, estimates, and forecast, 2017 - 2030 (USD Million)
- 7.1.2. Offline
- 7.1.2.1. Hangover cure products market, through offline distribution, market estimates and forecast, 2017 - 2030 (USD Million)
- 7.1.1. Online
Chapter 8. Hangover Cure Products Market: Regional Estimates & Trend Analysis
- 8.1. Hangover Cure Products Market: Regional Outlook
- 8.2. North America
- 8.2.1. Market estimates and forecast, by product, 2017- 2030 (USD Million)
- 8.2.2. Market estimates and forecast, by type, 2017 - 2030 (USD Million)
- 8.2.3. Market estimates and forecast, by distribution channel, 2017 - 2030 (USD Million)
- 8.2.4. U.S.
- 8.2.4.1. Market estimates and forecast, by product, 2017- 2030 (USD Million)
- 8.2.4.2. Market estimates and forecast, by type, 2017 - 2030 (USD Million)
- 8.2.4.3. Market estimates and forecast, by distribution channel, 2017 - 2030 (USD Million)
- 8.2.5. Canada
- 8.2.5.1. Market estimates and forecast, by product, 2017- 2030 (USD Million)
- 8.2.5.2. Market estimates and forecast, by type, 2017 - 2030 (USD Million)
- 8.2.5.3. Market estimates and forecast, by distribution channel, 2017 - 2030 (USD Million)
- 8.2.6. Mexico
- 8.2.6.1. Market estimates and forecast, by product, 2017- 2030 (USD Million)
- 8.2.6.2. Market estimates and forecast, by type, 2017 - 2030 (USD Million)
- 8.2.6.3. Market estimates and forecast, by distribution channel, 2017 - 2030 (USD Million)
- 8.3. Europe
- 8.3.1. Market estimates and forecast, by product, 2017- 2030 (USD Million)
- 8.3.2. Market estimates and forecast, by type, 2017 - 2030 (USD Million)
- 8.3.3. Market estimates and forecast, by distribution channel, 2017 - 2030 (USD Million)
- 8.3.4. U.K.
- 8.3.4.1. Market estimates and forecast, by product, 2017- 2030 (USD Million)
- 8.3.4.2. Market estimates and forecast, by type, 2017 - 2030 (USD Million)
- 8.3.4.3. Market estimates and forecast, by distribution channel, 2017 - 2030 (USD Million)
- 8.3.5. Germany
- 8.3.5.1. Market estimates and forecast, by product, 2017- 2030 (USD Million)
- 8.3.5.2. Market estimates and forecast, by type, 2017 - 2030 (USD Million)
- 8.3.5.3. Market estimates and forecast, by distribution channel, 2017 - 2030 (USD Million)
- 8.3.6. France
- 8.3.6.1. Market estimates and forecast, by product, 2017- 2030 (USD Million)
- 8.3.6.2. Market estimates and forecast, by type, 2017 - 2030 (USD Million)
- 8.3.6.3. Market estimates and forecast, by distribution channel, 2017 - 2030 (USD Million)
- 8.3.7. Spain
- 8.3.7.1. Market estimates and forecast, by product, 2017- 2030 (USD Million)
- 8.3.7.2. Market estimates and forecast, by type, 2017 - 2030 (USD Million)
- 8.3.7.3. Market estimates and forecast, by distribution channel, 2017 - 2030 (USD Million)
- 8.3.8. Russia
- 8.3.8.1. Market estimates and forecast, by product, 2017- 2030 (USD Million)
- 8.3.8.2. Market estimates and forecast, by type, 2017 - 2030 (USD Million)
- 8.3.8.3. Market estimates and forecast, by distribution channel, 2017 - 2030 (USD Million)
- 8.4. Asia Pacific
- 8.4.1. Market estimates and forecast, by product, 2017- 2030 (USD Million)
- 8.4.2. Market estimates and forecast, by type, 2017 - 2030 (USD Million)
- 8.4.3. Market estimates and forecast, by distribution channel, 2017 - 2030 (USD Million)
- 8.4.4. China
- 8.4.4.1. Market estimates and forecast, by product, 2017- 2030 (USD Million)
- 8.4.4.2. Market estimates and forecast, by type, 2017 - 2030 (USD Million)
- 8.4.4.3. Market estimates and forecast, by distribution channel, 2017 - 2030 (USD Million)
- 8.4.5. India
- 8.4.5.1. Market estimates and forecast, by product, 2017- 2030 (USD Million)
- 8.4.5.2. Market estimates and forecast, by type, 2017 - 2030 (USD Million)
- 8.4.5.3. Market estimates and forecast, by distribution channel, 2017 - 2030 (USD Million)
- 8.4.6. Japan
- 8.4.6.1. Market estimates and forecast, by product, 2017- 2030 (USD Million)
- 8.4.6.2. Market estimates and forecast, by type, 2017 - 2030 (USD Million)
- 8.4.6.3. Market estimates and forecast, by distribution channel, 2017 - 2030 (USD Million)
- 8.4.7. South Korea
- 8.4.7.1. Market estimates and forecast, by product, 2017- 2030 (USD Million)
- 8.4.7.2. Market estimates and forecast, by type, 2017 - 2030 (USD Million)
- 8.4.7.3. Market estimates and forecast, by distribution channel, 2017 - 2030 (USD Million)
- 8.4.8. Australia
- 8.4.8.1. Market estimates and forecast, by product, 2017- 2030 (USD Million)
- 8.4.8.2. Market estimates and forecast, by type, 2017 - 2030 (USD Million)
- 8.4.8.3. Market estimates and forecast, by distribution channel, 2017 - 2030 (USD Million)
- 8.5. Central & South America
- 8.5.1. Market estimates and forecast, by product, 2017- 2030 (USD Million)
- 8.5.2. Market estimates and forecast, by type, 2017 - 2030 (USD Million)
- 8.5.3. Market estimates and forecast, by distribution channel, 2017 - 2030 (USD Million)
- 8.5.4. Brazil
- 8.5.4.1. Market estimates and forecast, by product, 2017- 2030 (USD Million)
- 8.5.4.2. Market estimates and forecast, by type, 2017 - 2030 (USD Million)
- 8.5.4.3. Market estimates and forecast, by distribution channel, 2017 - 2030 (USD Million)
- 8.5.5. Argentina
- 8.5.5.1. Market estimates and forecast, by product, 2017- 2030 (USD Million)
- 8.5.5.2. Market estimates and forecast, by type, 2017 - 2030 (USD Million)
- 8.5.5.3. Market estimates and forecast, by distribution channel, 2017 - 2030 (USD Million)
- 8.6. Middle East & Africa
- 8.6.1. Market estimates and forecast, by product, 2017- 2030 (USD Million)
- 8.6.2. Market estimates and forecast, by type, 2017 - 2030 (USD Million)
- 8.6.3. Market estimates and forecast, by distribution channel, 2017 - 2030 (USD Million)
- 8.6.4. South Africa
- 8.6.4.1. Market estimates and forecast, by product, 2017- 2030 (USD Million)
- 8.6.4.2. Market estimates and forecast, by type, 2017 - 2030 (USD Million)
- 8.6.4.3. Market estimates and forecast, by distribution channel, 2017 - 2030 (USD Million)
- 8.6.5. Turkey
- 8.6.5.1. Market estimates and forecast, by product, 2017- 2030 (USD Million)
- 8.6.5.2. Market estimates and forecast, by type, 2017 - 2030 (USD Million)
- 8.6.5.3. Market estimates and forecast, by distribution channel, 2017 - 2030 (USD Million)
Chapter 9. Hangover Cure Products Market: Competitive Landscape
- 9.1. Recent Developments & Impact Analysis, By Key Market Participants
- 9.2. Company Categorization
- 9.3. Participant's Overview
- 9.4. Financial Performance
- 9.5. Service Provider Benchmarking
- 9.6. Company Market Share Analysis, 2022 (Value % Share)
- 9.7. Company Heat Map Analysis
- 9.8. Strategy Mapping
- 9.8.1. Partnerships
- 9.8.2. Service Provider Launches
- 9.9. List of key companies analyzed in this section includes:
- 9.9.1. Abbott
- 9.9.2. Bayer AG
- 9.9.3. More Labs
- 9.9.4. The Himalaya Drug Company
- 9.9.5. Rally Labs LLC (Blowfish)
- 9.9.6. Flyby
- 9.9.7. Drinkwel, LLC
- 9.9.8. Cheers Health
- 9.9.9. Liquid I.V., Inc.
- 9.9.10. DOTSHOT
- 9.9.11. AfterDrink Ltd.
- 9.9.12. Toniiq
- 9.9.13. Purple Tree Labs
- 9.9.14. No Days Wasted
- 9.9.15. LES Labs (Detoxx)
- 9.9.16. EZ Lifestyle (Over EZ)
- 9.9.17. DrinkAde
- 9.9.18. Kaplan Laboratory, LLC (H-PROOF)
- 9.9.19. Bytox
- 9.9.20. Cheal Hangover Patch
- 9.9.21. Party Patch
- 9.9.22. Rebound Hangover Patch
- 9.9.23. TRIO Patch
- 9.9.24. SmartPatches
- 9.9.25. D-Tox Hangover Patches
- 9.9.26. La Mend, Inc. (The Good Patch)
- 9.9.27. RallyPatch, LLC
- 9.9.28. Ozmo Patch
- 9.9.29. Wet Buffalo Patch
- 9.9.30. LiveToShine
- 9.9.31. AWKN
