|
|
市場調査レポート
商品コード
1301100
産業用CTの市場規模、シェア、動向分析レポート:提供別、タイプ別、スキャン技術別、用途別、業界別、地域別、セグメント予測、2023年~2030年Industrial Computed Tomography Market Size, Share & Trends Analysis Report By Offering (Equipment, Services), By Type, By Scanning Technique, By Application, By Vertical, By Region, And Segment Forecasts, 2023 - 2030 |
||||||
|
|
|||||||
カスタマイズ可能
|
|||||||


| 産業用CTの市場規模、シェア、動向分析レポート:提供別、タイプ別、スキャン技術別、用途別、業界別、地域別、セグメント予測、2023年~2030年 |
|
出版日: 2023年06月21日
発行: Grand View Research
ページ情報: 英文 100 Pages
納期: 2~10営業日
|

- 全表示
- 概要
- 図表
- 目次
産業用CT市場の成長と動向
GrandView Research, Inc.の最新レポートによると、産業用CTの世界市場規模は、予測期間中にCAGR 7.4%を記録し、2030年までに11億1,650万米ドルに達する見込みです。
産業用CTは、アルミニウムやプラスチックなどの部品を検査する非破壊検査法です。これは、接触せずに部品の欠陥を検出するために使用されるX線透視検査の一種です。エレクトロニクス、自動車、石油・ガスなど、さまざまな業界で利用が拡大しています。COVID-19パンデミックは、ロックダウンや政府による渡航制限により市場に悪影響を及ぼし、世界的に工業生産が減少しました。産業化の進展と付加製造技術の産業界への導入の増加が、産業用CT市場の成長を促進しています。
産業用CTが提供するメリットには、製品設計の改善や製造コストの削減、製品の不具合発生率の低減などがあります。これらのメリットにより、産業用CTスキャナの産業界への導入が促進されると期待されています。産業用CTスキャナは、検査対象の製品を詳細に描写する高品質の検査画像を提供します。これにより、業界全体の検査プロセスが改善されます。
提供サービスに基づいて、市場は探索装置とサービスに分けられます。様々なソフトウェアに対応したCTスキャナーが広く利用可能であることが、このセグメントの成長を促進しています。タイプ別に見ると、市場は高電圧CT、マイクロCT、その他に分けられます。高電圧CTスキャナーは大型で高密度の部品に使用され、マイクロCTスキャナーは小型から中型の部品に使用されます。
市場参入企業は、産業用CTスキャナーの革新的なソリューションを導入し、製品ラインナップの充実を図っています。例えば、コメットグループは2022年2月、エクスロンUX50という新しいCT(コンピュータ断層検査)システムの発売を発表しました。このシステムはGeminyソフトウェアプラットフォームに基づいています。このシステムは、鋳物工場や自動車産業向けの生産環境用に設計されています。
主なプレーヤーには、株式会社ニコン、オムロン株式会社、Baker Hughes Company、Comet Group、ZEISS Group、島津製作所、North Star Imaging Inc.(Illinois Tool Works Inc.)、Werth Inc.、株式会社リガク、VJ Technologiesなどがあります。これらの主なプレーヤーは、存在感と市場シェアを拡大するために、製品の発売など、さまざまな新興国市場開拓戦略を採用しています。
2023年4月、日本の株式会社ニコンは2つの新しいX線コンピュータ断層検査システムの発売を発表しました。VOXLS 30 M 450とVOXLS 30 C 450の2機種は、最大450ワットの連続X線出力を実現。この新システムは、大型タービンブレードや3Dプリント部品のスキャンなどの用途に適しています。
産業用CT市場レポートハイライト
- 製品リコール件数の削減と全体的な製品品質向上へのニーズの高まりが市場成長の原動力
- サービス分野は予測期間中に最も速いCAGRで成長すると予測される
- 高電圧CT分野は2022年に42.7%の収益シェアで市場を独占し、2023年から2030年にかけてCAGR 7.5%で拡大する見込み
- コーンビームCTセグメントは予測期間中最も速いCAGR 7.9%で成長すると予測される
- 探傷・検査分野は2022年に最大の収益シェアを占め、2023年から2030年にかけてCAGR 8.6%で拡大する見込み
- エレクトロニクス分野は予測期間中CAGR 8.5%で最速成長すると予測される
目次
第1章 調査手法と範囲
- 市場セグメンテーションと範囲
- 市場の定義
- 調査手法
- 調査の仮定
- データソースのリスト
- 二次情報
- 一次情報
第2章 エグゼクティブサマリー
- 市場スナップショット
- セグメントスナップショット
- 競合情勢のスナップショット
第3章 市場変数、動向、および範囲の見通し
- 市場系統の見通し
- 産業用CT市場のバリューチェーン分析
- 産業用CT市場力学
- 市場促進要因分析
- 市場抑制要因/課題の分析
- 市場機会分析
- 業界分析- ポーターのファイブフォース分析
- 産業用CT市場PESTEL分析
- 新型コロナウイルス感染症(COVID-19)が産業用CT市場に与える影響
第4章 産業用CT市場:提供の見通し
- 産業用CT市場、提供の分析および市場シェア別、2022年および2030年
- 装置
- 市場推計・予測、2017~2030年
- 地域別、2017~2030年
- サービス
- 市場推計・予測、2017~2030年
- 地域別、2017~2030年
第5章 産業用CT市場:タイプの見通し
- 産業用CT市場、タイプ別分析および市場シェア、2022年および2030年
- 高圧CT
- 市場推計・予測、2017~2030年
- 地域別、2017~2030年
- マイクロCT
- 市場推計・予測、2017~2030年
- 地域別、2017~2030年
- その他
- 市場推計・予測、2017~2030年
- 地域別、2017~2030年
第6章 産業用CT市場:スキャン技術の見通し
- 産業用CT市場、スキャン技術分析および市場シェア別、2022年および2030年
- ファンビームCT
- 市場推計・予測、2017~2030年
- 地域別、2017~2030年
- コーンビームCT
- 市場推計・予測、2017~2030年
- 地域別、2017~2030年
- その他
- 市場推計・予測、2017~2030年
- 地域別、2017~2030年
第7章 産業用CT市場:用途の展望
- 産業用CT市場、用途分析および市場シェア別、2022年および2030年
- 欠陥の検出と検査
- 市場推計・予測、2017~2030年
- 地域別、2017~2030年
- 故障解析
- 市場推計・予測、2017~2030年
- 地域別、2017~2030年
- アセンブリ解析
- 市場推計・予測、2017~2030年
- 地域別、2017~2030年
- 寸法および公差解析
- 市場推計・予測、2017~2030年
- 地域別、2017~2030年
- その他
- 市場推計・予測、2017~2030年
- 地域別、2017~2030年
第8章 産業用CT市場の垂直展望
- 産業用CT市場、業界別分析および市場シェア別、2022年および2030年
- 石油ガス
- 市場推計・予測、2017~2030年
- 地域別、2017~2030年
- 航空宇宙と防衛
- 市場推計・予測、2017~2030年
- 地域別、2017~2030年
- 自動車
- 市場推計・予測、2017~2030年
- 地域別、2017~2030年
- エレクトロニクス
- 市場推計・予測、2017~2030年
- 地域別、2017~2030年
- その他
- 市場推計・予測、2017~2030年
- 地域別、2017~2030年
第9章 産業用CT市場:地域推定・動向分析
- 産業用CTの地域別市場シェア、2022年および2030年
- 北米
- 提供別、2017~2030年
- タイプ別、2017~2030年
- スキャン技術別、2017~2030
- 用途別、2017~2030年
- 業界別、2017~2030年
- 米国
- カナダ
- 欧州
- 提供別、2017~2030年
- タイプ別、2017~2030年
- スキャン技術別、2017~2030
- 用途別、2017~2030年
- 業界別、2017~2030年
- 英国
- ドイツ
- フランス
- アジア太平洋地域
- 提供別、2017~2030年
- タイプ別、2017~2030年
- スキャン技術別、2017~2030
- 用途別、2017~2030年
- 業界別、2017~2030年
- 中国
- インド
- 日本
- 韓国
- ラテンアメリカ
- 提供別、2017~2030年
- タイプ別、2017~2030年
- スキャン技術別、2017~2030
- 用途別、2017~2030年
- 業界別、2017~2030年
- ブラジル
- メキシコ
- 中東とアフリカ
- 提供別、2017~2030年
- タイプ別、2017~2030年
- スキャン技術別、2017~2030
- 用途別、2017~2030年
- 業界別、2017~2030年
第10章 産業用CT市場の競合情勢
- 主要な市場参入企業
- Nikon Corporation
- OMRON Corporation
- Baker Hughes Company
- Comet Group
- ZEISS Group
- Shimadzu Corporation
- North Star Imaging Inc.(Illinois Tool Works Inc.)
- Werth Inc
- Rigaku Corporation
- VJ Technologies
- 主要企業の市場シェア分析、2022年
- 企業分類/ポジション分析、2022年
- 戦略的マッピング
- 拡張
- 取得
- コラボレーション
- 製品/サービスの開始
- パートナーシップ
- その他
List of Tables
- Table 1 Global Industrial Computed Tomography market revenue estimates and forecast, by offering, 2017 - 2030 (USD Million)
- Table 2 Global Industrial Computed Tomography market revenue estimates and forecast, by type, 2017 - 2030 (USD Million)
- Table 3 Global Industrial Computed Tomography market revenue estimates and forecast, by scanning technique, 2017 - 2030 (USD Million)
- Table 4 Global Industrial Computed Tomography market revenue estimates and forecast, by application, 2017 - 2030 (USD Million)
- Table 5 Global Industrial Computed Tomography market revenue estimates and forecast, by vertical, 2017 - 2030 (USD Million)
- Table 6 Global Industrial Computed Tomography market revenue estimates and forecast, by region, 2017 - 2030 (USD Million)
- Table 7 Company heat map analysis
- Table 8 Key companies undertaking partnerships and collaboration
- Table 9 Key companies launching new products
List of Figures
- Fig. 1 Industrial Computed Tomography market segmentation
- Fig. 2 Information procurement
- Fig. 3 Data analysis models
- Fig. 4 Market formulation and validation
- Fig. 5 Data validating & publishing
- Fig. 6 Market snapshot
- Fig. 7 Segment snapshot (1/3)
- Fig. 8 Segment snapshot (2/3)
- Fig. 9 Segment snapshot (3/3)
- Fig. 10 Competitive landscape snapshot
- Fig. 11 Industrial computed tomography market value, 2017 - 2030 (USD Million)
- Fig. 12 Industrial computed tomography market - Industry value chain analysis
- Fig. 13 Industrial computed tomography market - Market trends
- Fig. 14 Industrial computed tomography market: Porter's analysis
- Fig. 15 Industrial computed tomography market: PESTEL analysis
- Fig. 16 Industrial computed tomography market, by Offering: Key takeaways
- Fig. 17 Industrial computed tomography market, by Offering: Market share, 2022 & 2030
- Fig. 18 Equipment industrial computed tomography market estimates & forecasts, 2017 - 2030 (USD Million)
- Fig. 19 Services industrial computed tomography market estimates & forecasts, 2017 - 2030 (USD Million)
- Fig. 20 Industrial computed tomography market, by Type: Key takeaways
- Fig. 21 Industrial computed tomography market, by Type: Market share, 2022 & 2030
- Fig. 22 High-voltage CT industrial computed tomography market estimates & forecasts, 2017 - 2030 (USD Million)
- Fig. 23 Micro CT industrial computed tomography market estimates & forecasts, 2017 - 2030 (USD Million)
- Fig. 24 Others industrial computed tomography market estimates & forecasts, 2017 - 2030 (USD Million)
- Fig. 25 Industrial computed tomography market, by scanning technique: Key takeaways
- Fig. 26 Industrial computed tomography market, by scanning technique: Market share, 2022 & 2030
- Fig. 27 Fan-beam CT industrial computed tomography market estimates & forecasts, 2017 - 2030 (USD Million)
- Fig. 28 Cone-beam CT industrial computed tomography market estimates & forecasts, 2017 - 2030 (USD Million)
- Fig. 29 Others industrial computed tomography market estimates & forecasts, 2017 - 2030 (USD Million)
- Fig. 30 Industrial Computed Tomography market, by Application: Key takeaways
- Fig. 31 Industrial Computed Tomography market, by Application: Market share, 2022 & 2030
- Fig. 32 Flaw detection and inspection industrial computed tomography market estimates & forecasts, 2017 - 2030 (USD Million)
- Fig. 33 Failure analysis industrial computed tomography market estimates & forecasts, 2017 - 2030 (USD Million)
- Fig. 34 Assembly analysis industrial computed tomography market estimates & forecasts, 2017 - 2030 (USD Million)
- Fig. 35 Dimensioning and tolerancing analysis industrial computed tomography market estimates & forecasts, 2017 - 2030 (USD Million)
- Fig. 36 Others industrial computed tomography market estimates & forecasts, 2017 - 2030 (USD Million)
- Fig. 37 Industrial computed tomography market, by Vertical: Key takeaways
- Fig. 38 Industrial computed tomography market, by Vertical: Market share, 2022 & 2030
- Fig. 39 Oil & gas industrial computed tomography market estimates & forecasts, 2017 - 2030 (USD Million)
- Fig. 40 Aerospace and defense industrial computed tomography market estimates & forecasts, 2017 - 2030 (USD Million)
- Fig. 41 Automotive industrial computed tomography market estimates & forecasts, 2017 - 2030 (USD Million)
- Fig. 42 Electronics industrial computed tomography market estimates & forecasts, 2017 - 2030 (USD Million)
- Fig. 43 Others (industry) Industrial Computed Tomography market estimates & forecasts, 2017 - 2030 (USD Million)
- Fig. 44 Global industrial computed tomography market revenue, by region, 2022 & 2030, (USD Million)
- Fig. 45 North America industrial computed tomography market estimates & forecasts, 2017 - 2030 (USD Million)
- Fig. 46 U.S. industrial computed tomography market estimates & forecasts, 2017 - 2030 (USD Million)
- Fig. 47 Canada industrial computed tomography market estimates & forecasts, 2017 - 2030 (USD Million)
- Fig. 48 Europe industrial computed tomography market estimates & forecasts, 2017 - 2030 (USD Million)
- Fig. 49 UK industrial computed tomography market estimates & forecasts, 2017 - 2030 (USD Million)
- Fig. 50 Germany industrial computed tomography market estimates & forecasts, 2017 - 2030 (USD Million)
- Fig. 51 France industrial computed tomography market estimates & forecasts, 2017 - 2030 (USD Million)
- Fig. 52 Asia Pacific industrial computed tomography market estimates & forecasts, 2017 - 2030 (USD Million)
- Fig. 53 China industrial computed tomography market estimates & forecasts, 2017 - 2030 (USD Million)
- Fig. 54 India industrial computed tomography market estimates & forecasts, 2017 - 2030 (USD Million)
- Fig. 55 Japan industrial computed tomography market estimates & forecasts, 2017 - 2030 (USD Million)
- Fig. 56 South Korea industrial computed tomography market estimates & forecasts, 2017 - 2030 (USD Million)
- Fig. 57 Latin America industrial computed tomography market estimates & forecasts, 2017 - 2030 (USD Million)
- Fig. 58 Brazil industrial computed tomography market estimates & forecasts, 2017 - 2030 (USD Million)
- Fig. 59 Mexico industrial computed tomography market estimates & forecasts, 2017 - 2030 (USD Million)
- Fig. 60 Middle East & Africa industrial computed tomography market estimates & forecasts, 2017 - 2030 (USD Million)
- Fig. 61 Key company categorization
- Fig. 62 Industrial computed tomography market - Key company market share analysis, 2022.
- Fig. 63 Strategic framework
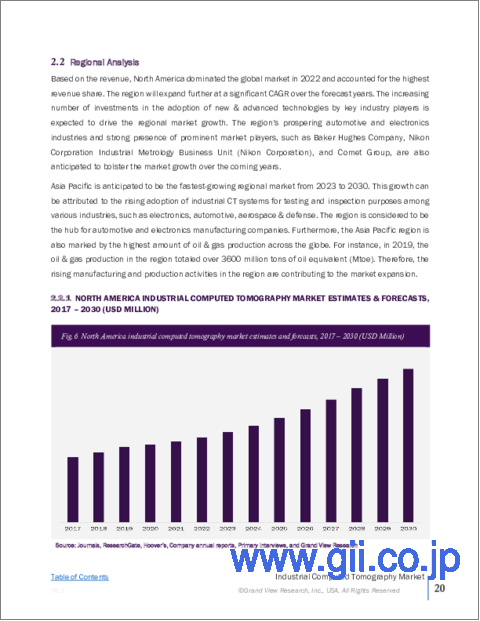
Industrial Computed Tomography Market Growth & Trends
The global industrial computed tomography market size is expected to reach USD 1,116.5 million by 2030, registering a CAGR of 7.4% during the forecast period, according to a new report by Grand View Research, Inc. Industrial computed tomography is a non-destructive testing method for examining components such as aluminum and plastics. It is a type of radiography testing used to detect flaws in components without contact. It is increasingly used across various industries, including electronics, automotive, and oil & gas, among others. The COVID-19 pandemic negatively affected the market due to lockdowns and government travel restrictions, reducing industrial production worldwide. Growing industrialization and the rising adoption of additive manufacturing techniques across industries are driving the growth of the market for industrial computed tomography.
The benefits offered by industrial CT include improved product design and manufacturing cost reduction and reduced product failure instances. These benefits are expected to boost the adoption of industrial CT scanners in the industries. Industrial CT scanners offer high-quality inspection images detailing the product under inspection. This improves the inspection process across industries.
Based on offering, the market is divided into exploratory equipment and services. The wide availability of various software-enabled computed tomography scanners is driving the growth of the segment. Based on type, the market is divided into high-voltage CT, micro CT, and others. High-voltage CT scanners are used for large and dense components, whereas micro CT scanners are used for small to medium-sized components.
The market players are introducing innovative solutions for industrial computed tomography to improve offerings. For instance, in February 2022, Comet Group announced the launch of a new computed tomography system called YXLON UX50. The system is based on the Geminy software platform. It is designed for foundry and automotive industries for production environment.
Some of the key players include Nikon Corporation; OMRON Corporation; Baker Hughes Company; Comet Group; ZEISS Group; Shimadzu Corporation; North Star Imaging Inc. (Illinois Tool Works Inc.); Werth Inc.; Rigaku Corporation; and VJ Technologies. These key players are adopting different development strategies, such as product launches and others, to expand their presence and market share.
In April 2023, Japan-based Nikon Corporation announced the launch of two new X-ray computed tomography inspection systems. The two variants, VOXLS 30 M 450 and VOXLS 30 C 450 deliver continuous X-ray power of up to 450 watts. The new systems have applications such as scanning large turbine blades and 3D-printed parts.
Industrial Computed Tomography Market Report Highlights
- The increasing need to reduce product recall instances and improve overall product quality drives the market growth
- The services segment is projected to grow at the fastest CAGR over the forecast period
- The high-voltage CT segment is expected to dominate the market in 2022 with a revenue share of 42.7% and is expected to expand at a CAGR of 7.5% from 2023 to 2030
- The cone-beam CT segment is projected to grow at the fastest CAGR of 7.9% over the forecast period
- The flaw detection and inspection segment held the largest revenue share in 2022 and is expected to expand at a CAGR of 8.6% from 2023 to 2030
- The electronics segment is projected to grow at the fastest CAGR of 8.5% over the forecast period
Table of Contents
Chapter 1. Methodology and Scope
- 1.1. Market Segmentation & Scope
- 1.2. Market Definitions
- 1.3. Research Methodology
- 1.4. Research Assumptions
- 1.5. List of Data Sources
- 1.5.1. Secondary Sources
- 1.5.2. Primary Sources
Chapter 2. Executive Summary
- 2.1. Market Snapshot
- 2.2. Segmental Snapshot
- 2.3. Competitive Landscape Snapshot
Chapter 3. Market Variables, Trends, & Scope Outlook
- 3.1. Market Lineage Outlook
- 3.2. Industrial Computed Tomography Market Value Chain Analysis
- 3.3. Industrial Computed Tomography Market Dynamics
- 3.3.1. Market Driver Analysis
- 3.3.2. Market Restraint/Challenge Analysis
- 3.3.3. Market Opportunity Analysis
- 3.4. Industry Analysis - Porter's Five Forces Analysis
- 3.4.1. Supplier Power
- 3.4.2. Buyer Power
- 3.4.3. Substitution Threat
- 3.4.4. Threat of New Entrants
- 3.4.5. Competitive Rivalry
- 3.5. Industrial Computed Tomography Market PESTEL Analysis
- 3.5.1. Political Landscape
- 3.5.2. Economic Landscape
- 3.5.3. Social Landscape
- 3.5.4. Technology Landscape
- 3.5.5. Environmental Landscape
- 3.5.6. Legal Landscape
- 3.6. Impact of COVID-19 on the Industrial Computed Tomography Market
Chapter 4. Industrial Computed Tomography Market Offering Outlook
- 4.1. Industrial Computed Tomography Market, By Offering Analysis & Market Share, 2022 & 2030
- 4.2. Equipment
- 4.2.1. Market estimates and forecasts, 2017 - 2030 (USD Million)
- 4.2.2. Market estimates and forecasts, By Region, 2017 - 2030 (USD Million)
- 4.3. Services
- 4.3.1. Market estimates and forecasts, 2017 - 2030 (USD Million)
- 4.3.2. Market estimates and forecasts, By Region, 2017 - 2030 (USD Million)
Chapter 5. Industrial Computed Tomography Market Type Outlook
- 5.1. Industrial Computed Tomography Market, By Type Analysis & Market Share, 2022 & 2030
- 5.2. High-voltage CT
- 5.2.1. Market estimates and forecasts, 2017 - 2030 (USD Million)
- 5.2.2. Market estimates and forecasts, By Region, 2017 - 2030 (USD Million)
- 5.3. Micro CT
- 5.3.1. Market estimates and forecasts, 2017 - 2030 (USD Million)
- 5.3.2. Market estimates and forecasts, By Region, 2017 - 2030 (USD Million)
- 5.4. Others
- 5.4.1. Market estimates and forecasts, 2017 - 2030 (USD Million)
- 5.4.2. Market estimates and forecasts, By Region, 2017 - 2030 (USD Million)
Chapter 6. Industrial Computed Tomography Market Scanning Technique Outlook
- 6.1. Industrial Computed Tomography Market, By Scanning Technique Analysis & Market Share, 2022 & 2030
- 6.2. Fan-beam CT
- 6.2.1. Market estimates and forecasts, 2017 - 2030 (USD Million)
- 6.2.2. Market estimates and forecasts, By Region, 2017 - 2030 (USD Million)
- 6.3. Cone-beam CT
- 6.3.1. Market estimates and forecasts, 2017 - 2030 (USD Million)
- 6.3.2. Market estimates and forecasts, By Region, 2017 - 2030 (USD Million)
- 6.4. Others
- 6.4.1. Market estimates and forecasts, 2017 - 2030 (USD Million)
- 6.4.2. Market estimates and forecasts, By Region, 2017 - 2030 (USD Million)
Chapter 7. Industrial Computed Tomography Market Application Outlook
- 7.1. Industrial Computed Tomography Market, By Application Analysis & Market Share, 2022 & 2030
- 7.2. Flaw Detection and Inspection
- 7.2.1. Market estimates and forecasts, 2017 - 2030 (USD Million)
- 7.2.2. Market estimates and forecasts, By Region, 2017 - 2030 (USD Million)
- 7.3. Failure Analysis
- 7.3.1. Market estimates and forecasts, 2017 - 2030 (USD Million)
- 7.3.2. Market estimates and forecasts, By Region, 2017 - 2030 (USD Million)
- 7.4. Assembly Analysis
- 7.4.1. Market estimates and forecasts, 2017 - 2030 (USD Million)
- 7.4.2. Market estimates and forecasts, By Region, 2017 - 2030 (USD Million)
- 7.5. Dimensioning and Tolerancing Analysis
- 7.5.1. Market estimates and forecasts, 2017 - 2030 (USD Million)
- 7.5.2. Market estimates and forecasts, By Region, 2017 - 2030 (USD Million)
- 7.6. Others
- 7.6.1. Market estimates and forecasts, 2017 - 2030 (USD Million)
- 7.6.2. Market estimates and forecasts, By Region, 2017 - 2030 (USD Million)
Chapter 8. Industrial Computed Tomography Market Vertical Outlook
- 8.1. Industrial Computed Tomography Market, By Vertical Analysis & Market Share, 2022 & 2030
- 8.2. Oil & Gas
- 8.2.1. Market estimates and forecasts, 2017 - 2030 (USD Million)
- 8.2.2. Market estimates and forecasts, By Region, 2017 - 2030 (USD Million)
- 8.3. Aerospace and Defense
- 8.3.1. Market estimates and forecasts, 2017 - 2030 (USD Million)
- 8.3.2. Market estimates and forecasts, By Region, 2017 - 2030 (USD Million)
- 8.4. Automotive
- 8.4.1. Market estimates and forecasts, 2017 - 2030 (USD Million)
- 8.4.2. Market estimates and forecasts, By Region, 2017 - 2030 (USD Million)
- 8.5. Electronics
- 8.5.1. Market estimates and forecasts, 2017 - 2030 (USD Million)
- 8.5.2. Market estimates and forecasts, By Region, 2017 - 2030 (USD Million)
- 8.6. Others
- 8.6.1. Market estimates and forecasts, 2017 - 2030 (USD Million)
- 8.6.2. Market estimates and forecasts, By Region, 2017 - 2030 (USD Million)
Chapter 9. Industrial Computed Tomography Market: Regional Estimates & Trend Analysis
- 9.1. Industrial Computed Tomography Market Share by Region, 2022 & 2030
- 9.2. North America
- 9.2.1. Market estimates and forecasts, 2017 - 2030
- 9.2.2. Market estimates and forecasts, By Offering, 2017 - 2030 (USD Million)
- 9.2.3. Market estimates and forecasts, By Type, 2017 - 2030 (USD Million)
- 9.2.4. Market estimates and forecasts, By Scanning Technique, 2017 - 2030 (USD Million)
- 9.2.5. Market estimates and forecasts, By Application, 2017 - 2030 (USD Million)
- 9.2.6. Market estimates and forecasts, By Vertical, 2017 - 2030 (USD Million)
- 9.2.7. U.S.
- 9.2.7.1. Market estimates and forecasts, By Offering, 2017 - 2030 (USD Million)
- 9.2.7.2. Market estimates and forecasts, By Type, 2017 - 2030 (USD Million)
- 9.2.7.3. Market estimates and forecasts, By Scanning Technique, 2017 - 2030 (USD Million)
- 9.2.7.4. Market estimates and forecasts, By Application, 2017 - 2030 (USD Million)
- 9.2.7.5. Market estimates and forecasts, By Vertical, 2017 - 2030 (USD Million)
- 9.2.8. Canada
- 9.2.8.1. Market estimates and forecasts, By Offering, 2017 - 2030 (USD Million)
- 9.2.8.2. Market estimates and forecasts, By Type, 2017 - 2030 (USD Million)
- 9.2.8.3. Market estimates and forecasts, By Scanning Technique, 2017 - 2030 (USD Million)
- 9.2.8.4. Market estimates and forecasts, By Application, 2017 - 2030 (USD Million)
- 9.2.8.5. Market estimates and forecasts, By Vertical, 2017 - 2030 (USD Million)
- 9.3. Europe
- 9.3.1. Market estimates and forecasts, 2017 - 2030
- 9.3.2. Market estimates and forecasts, By Offering, 2017 - 2030 (USD Million)
- 9.3.3. Market estimates and forecasts, By Type, 2017 - 2030 (USD Million)
- 9.3.4. Market estimates and forecasts, By Scanning Technique, 2017 - 2030 (USD Million)
- 9.3.5. Market estimates and forecasts, By Application, 2017 - 2030 (USD Million)
- 9.3.6. Market estimates and forecasts, By Vertical, 2017 - 2030 (USD Million)
- 9.3.7. UK
- 9.3.7.1. Market estimates and forecasts, By Offering, 2017 - 2030 (USD Million)
- 9.3.7.2. Market estimates and forecasts, By Type, 2017 - 2030 (USD Million)
- 9.3.7.3. Market estimates and forecasts, By Scanning Technique, 2017 - 2030 (USD Million)
- 9.3.7.4. Market estimates and forecasts, By Application, 2017 - 2030 (USD Million)
- 9.3.7.5. Market estimates and forecasts, By Vertical, 2017 - 2030 (USD Million)
- 9.3.8. Germany
- 9.3.8.1. Market estimates and forecasts, By Offering, 2017 - 2030 (USD Million)
- 9.3.8.2. Market estimates and forecasts, By Type, 2017 - 2030 (USD Million)
- 9.3.8.3. Market estimates and forecasts, By Scanning Technique, 2017 - 2030 (USD Million)
- 9.3.8.4. Market estimates and forecasts, By Application, 2017 - 2030 (USD Million)
- 9.3.8.5. Market estimates and forecasts, By Vertical, 2017 - 2030 (USD Million)
- 9.3.9. France
- 9.3.9.1. Market estimates and forecasts, By Offering, 2017 - 2030 (USD Million)
- 9.3.9.2. Market estimates and forecasts, By Type, 2017 - 2030 (USD Million)
- 9.3.9.3. Market estimates and forecasts, By Scanning Technique, 2017 - 2030 (USD Million)
- 9.3.9.4. Market estimates and forecasts, By Application, 2017 - 2030 (USD Million)
- 9.3.9.5. Market estimates and forecasts, By Vertical, 2017 - 2030 (USD Million)
- 9.4. Asia Pacific
- 9.4.1. Market estimates and forecasts, 2017 - 2030
- 9.4.2. Market estimates and forecasts, By Offering, 2017 - 2030 (USD Million)
- 9.4.3. Market estimates and forecasts, By Type, 2017 - 2030 (USD Million)
- 9.4.4. Market estimates and forecasts, By Scanning Technique, 2017 - 2030 (USD Million)
- 9.4.5. Market estimates and forecasts, By Application, 2017 - 2030 (USD Million)
- 9.4.6. Market estimates and forecasts, By Vertical, 2017 - 2030 (USD Million)
- 9.4.7. China
- 9.4.7.1. Market estimates and forecasts, By Offering, 2017 - 2030 (USD Million)
- 9.4.7.2. Market estimates and forecasts, By Type, 2017 - 2030 (USD Million)
- 9.4.7.3. Market estimates and forecasts, By Scanning Technique, 2017 - 2030 (USD Million)
- 9.4.7.4. Market estimates and forecasts, By Application, 2017 - 2030 (USD Million)
- 9.4.7.5. Market estimates and forecasts, By Vertical, 2017 - 2030 (USD Million)
- 9.4.8. India
- 9.4.8.1. Market estimates and forecasts, By Offering, 2017 - 2030 (USD Million)
- 9.4.8.2. Market estimates and forecasts, By Type, 2017 - 2030 (USD Million)
- 9.4.8.3. Market estimates and forecasts, By Scanning Technique, 2017 - 2030 (USD Million)
- 9.4.8.4. Market estimates and forecasts, By Application, 2017 - 2030 (USD Million)
- 9.4.8.5. Market estimates and forecasts, By Vertical, 2017 - 2030 (USD Million)
- 9.4.9. Japan
- 9.4.9.1. Market estimates and forecasts, By Offering, 2017 - 2030 (USD Million)
- 9.4.9.2. Market estimates and forecasts, By Type, 2017 - 2030 (USD Million)
- 9.4.9.3. Market estimates and forecasts, By Scanning Technique, 2017 - 2030 (USD Million)
- 9.4.9.4. Market estimates and forecasts, By Application, 2017 - 2030 (USD Million)
- 9.4.9.5. Market estimates and forecasts, By Vertical, 2017 - 2030 (USD Million)
- 9.4.10. South Korea
- 9.4.10.1. Market estimates and forecasts, By Offering, 2017 - 2030 (USD Million)
- 9.4.10.2. Market estimates and forecasts, By Type, 2017 - 2030 (USD Million)
- 9.4.10.3. Market estimates and forecasts, By Scanning Technique, 2017 - 2030 (USD Million)
- 9.4.10.4. Market estimates and forecasts, By Application, 2017 - 2030 (USD Million)
- 9.4.10.5. Market estimates and forecasts, By Vertical, 2017 - 2030 (USD Million)
- 9.5. Latin America
- 9.5.1. Market estimates and forecasts, 2017 - 2030
- 9.5.2. Market estimates and forecasts, By Offering, 2017 - 2030 (USD Million)
- 9.5.3. Market estimates and forecasts, By Type, 2017 - 2030 (USD Million)
- 9.5.4. Market estimates and forecasts, By Scanning Technique, 2017 - 2030 (USD Million)
- 9.5.5. Market estimates and forecasts, By Application, 2017 - 2030 (USD Million)
- 9.5.6. Market estimates and forecasts, By Vertical, 2017 - 2030 (USD Million)
- 9.5.7. Brazil
- 9.5.7.1. Market estimates and forecasts, By Offering, 2017 - 2030 (USD Million)
- 9.5.7.2. Market estimates and forecasts, By Type, 2017 - 2030 (USD Million)
- 9.5.7.3. Market estimates and forecasts, By Scanning Technique, 2017 - 2030 (USD Million)
- 9.5.7.4. Market estimates and forecasts, By Application, 2017 - 2030 (USD Million)
- 9.5.7.5. Market estimates and forecasts, By Vertical, 2017 - 2030 (USD Million)
- 9.5.8. Mexico
- 9.5.8.1. Market estimates and forecasts, By Offering, 2017 - 2030 (USD Million)
- 9.5.8.2. Market estimates and forecasts, By Type, 2017 - 2030 (USD Million)
- 9.5.8.3. Market estimates and forecasts, By Scanning Technique, 2017 - 2030 (USD Million)
- 9.5.8.4. Market estimates and forecasts, By Application, 2017 - 2030 (USD Million)
- 9.5.8.5. Market estimates and forecasts, By Vertical, 2017 - 2030 (USD Million)
- 9.6. Middle East & Africa
- 9.6.1. Market estimates and forecasts, 2017 - 2030
- 9.6.2. Market estimates and forecasts, By Offering, 2017 - 2030 (USD Million)
- 9.6.3. Market estimates and forecasts, By Type, 2017 - 2030 (USD Million)
- 9.6.4. Market estimates and forecasts, By Scanning Technique, 2017 - 2030 (USD Million)
- 9.6.5. Market estimates and forecasts, By Application, 2017 - 2030 (USD Million)
- 9.6.6. Market estimates and forecasts, By Vertical, 2017 - 2030 (USD Million)
Chapter 10. Industrial Computed Tomography Market Competitive Landscape
- 10.1. Key Market Participants
- 10.1.1. Nikon Corporation
- 10.1.2. OMRON Corporation
- 10.1.3. Baker Hughes Company
- 10.1.4. Comet Group
- 10.1.5. ZEISS Group
- 10.1.6. Shimadzu Corporation
- 10.1.7. North Star Imaging Inc. (Illinois Tool Works Inc.)
- 10.1.8. Werth Inc
- 10.1.9. Rigaku Corporation
- 10.1.10. VJ Technologies
- 10.2. Key Company Market Share Analysis, 2022
- 10.3. Company Categorization/Position Analysis, 2022
- 10.4. Strategic Mapping
- 10.4.1. Expansion
- 10.4.2. Acquisition
- 10.4.3. Collaborations
- 10.4.4. Product/service launch
- 10.4.5. Partnerships
- 10.4.6. Others