|
|
市場調査レポート
商品コード
1268682
カーボンブラックの市場規模、シェア、動向分析レポート:用途別(タイヤ、高機能コーティング、プラスチック)、地域別、セグメント別予測、2023年~2030年Carbon Black Market Size, Share & Trends Analysis Report By Application (Tires, High-performance Coatings, Plastics), By Region, And Segment Forecasts, 2023 - 2030 |
||||||
|
|
|||||||
|
● お客様のご希望に応じて、既存データの加工や未掲載情報(例:国別セグメント)の追加などの対応が可能です。 詳細はお問い合わせください。 |
|||||||


| カーボンブラックの市場規模、シェア、動向分析レポート:用途別(タイヤ、高機能コーティング、プラスチック)、地域別、セグメント別予測、2023年~2030年 |
|
出版日: 2023年04月14日
発行: Grand View Research
ページ情報: 英文 92 Pages
納期: 2~10営業日
|
- 全表示
- 概要
- 図表
- 目次
カーボンブラック市場の成長と動向:
Grand View Research, Inc.の最新レポートによると、カーボンブラックの世界市場規模は2030年までに310億4,000万米ドルに達し、CAGR4.8%で拡大すると予測されています。
輸送産業の発展に伴うタイヤ生産の増加が、製品需要を牽引しています。カーボンブラックは、製造工程で有害物質が排出され、環境や健康に悪影響を及ぼすと考えられているため、高度に規制された産業です。2003年2月には、カリフォルニア州環境健康有害性評価局(OEHHA)の「がんを引き起こすことが知られている物質」のリストに追加されました。
市場の主要企業は、有害な排出物を削減するための新しい製造技術を開発するための研究開発活動に注力しています。排出を抑制するための厳しい規制は、市場成長を促進する上で大きな役割を果たすと予想されます。中国、タイ、インド、インドネシアなどのアジア太平洋地域の新興国は、今後数年間、最大の製品需要を生み出すと予測されています。北米や欧州のメーカーは、新興国での生産コストが低いため、アジア諸国への事業シフトを余儀なくされています。しかし、ドイツやフランスなどでは自動車産業が回復しており、予測期間中に欧州の市場成長を促進すると予想されます。
カーボンブラック市場レポートハイライト
- 数量ベースでは、自動車産業からの高い需要に伴うタイヤ生産の増加により、タイヤ分野は2023年から20230年にかけてCAGR 4.8%を記録すると予測されます。
- プラスチックは、高性能製品の生産における応用範囲の拡大により、2023年から2030年にかけて最も急速に成長するアプリケーションと予想されます。
- ブラジルの安定した自動車生産と、徐々に増加するプラスチックおよびゴム製造の状況は、ラテンアメリカの市場を牽引すると予測されます。
- 主なカーボンブラックのメーカーおよびサプライヤーには、Evonik、日本、三菱、Jiangxi Black Cat Carbon Black Co.Ltd.、Philips Carbon Black、China Synthetic Rubber Corporationなどがあります。
目次
第1章 調査手法と範囲
- 市場セグメンテーションと範囲
- 市場の定義
- 情報調達
- 購入したデータベース
- GVRの内部データベース
- 二次情報と第三者の視点
- 情報分析
- データ分析モデル
- 市場形成とデータの可視化
- データの検証と公開
- 調査範囲と前提条件
第2章 エグゼクティブサマリー
- 市場スナップショット
- セグメントのスナップショット
- 競合情勢のスナップショット
第2章 市場変数、動向、範囲
- 市場系統の見通し
- 業界のバリューチェーン分析
- 原材料の動向
- 製造業の動向
- 販売チャネル分析
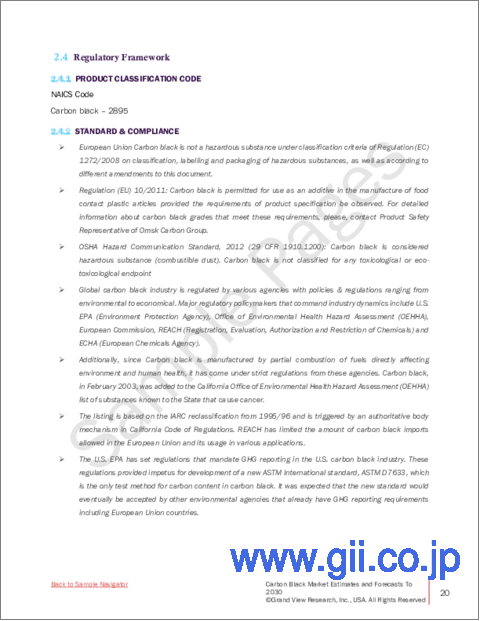
- 規制の枠組み
- 価格動向分析
- 価格に影響を与える要因
- COVID-19)の影響
- 市場力学
- 市場促進要因の分析
- 市場抑制要因分析
- 業界の課題
- 業界のチャンス
- 業界分析ツール
- ポーターの分析
- マクロ環境分析
第4章 カーボンブラックマーケット:サプライヤーポートフォリオ分析
- 主要な原材料サプライヤーのリスト
- 原材料の動向
- ポートフォリオ分析/Kraljicマトリックス
- エンゲージメントモデル
- 交渉戦略
- 調達のベストプラクティス
第5章 カーボンブラックマーケット:用途の推定・動向分析
- 用途の変動分析と市場シェア、2021年と2030年
- タイヤ
- 高性能コーティング
- プラスチック
- その他
第6章 カーボンブラックマーケット:地域別の推定・動向分析
- カーボンブラックマーケット:地域別の展望
- 北米
- 用途別、2018~2030年
- 米国
- カナダ
- メキシコ
- 欧州
- 用途別、2018~2030年
- ドイツ
- 英国
- フランス
- アジア太平洋地域
- 用途別、2018~2030年
- 中国
- インド
- 日本
- 中南米
- 用途別、2018~2030年
- ブラジル
- 中東とアフリカ
- 用途別、2018~2030年
- アラブ首長国連邦
第7章 競合情勢
- 主要市場参入企業の最近における開発と影響分析
- 会社の分類
- 企業の市場シェア分析、2022年
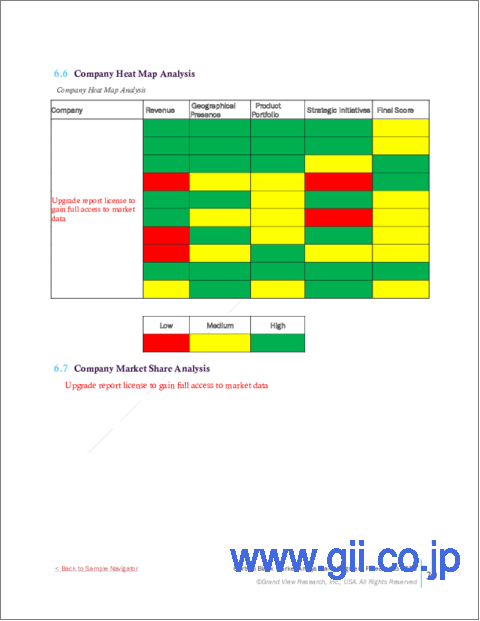
- 企業ヒートマップ分析
- 戦略マッピング
- 会社一覧(事業概要、財務実績、アプリケーションベンチマーク)
- Orion Engineered Carbons Holdings GmbH
- OMSK Carbon Group
- Sid Richardson Carbon &Energy Co.
- Tokai Carbon Co. Ltd.
- Asahi Carbon Co. Ltd.
- Ralson Goodluck Carbon
- Atlas Organic Pvt. Ltd.
- Continental Carbon Co.
- OCI Company Ltd.
- Birla Carbon
- Bridgestone Corp.
- Birla Carbon
- Cabot Corp.
- China Synthetic Rubber Corporation(CSRC)
- Himadri Companies &Industries Ltd.(HCIL)
- Mitsubishi Chemicals
- Nippon Steel &Sumikin Chemical Co. Ltd.
- Jiangxi Black Cat Carbon Black Inc.
List of Tables
- Table 1 List of key end users
- Table 2 Global Carbon Black Market Estimates & Forecast, by Application, 2018 - 2030 (Kilotons)
- Table 3 Global Carbon Black Market Estimates & Forecast, by Application, 2018 - 2030 (USD Million)
- Table 4 Global Carbon Black Market Estimates & Forecast, by Region, 2018 - 2030 (Kilotons)
- Table 5 Global Carbon Black Market Estimates & Forecast, by Region, 2018 - 2030 (USD Million)
- Table 6 North America Carbon Black Market Estimates and Forecast, by Application, 2018 - 2030 (Kilotons)
- Table 7 North America Carbon Black Market Estimates and Forecast, by Application, 2018 - 2030 (USD Million)
- Table 8 U.S. macro-economic outlay
- Table 9 U.S. Carbon Black Market Estimates and Forecast, by Application, 2018 - 2030 (Kilotons)
- Table 10 U.S. Carbon Black Market Estimates and Forecast, by Application, 2018 - 2030 (USD Million)
- Table 11 Canada macro-economic outlay
- Table 12 Canada Carbon Black Market Estimates and Forecast, by Application, 2018 - 2030 (Kilotons)
- Table 13 Canada Carbon Black Market Estimates and Forecast, by Application, 2018 - 2030
- Table 14 Mexico macro-economic outlay
- Table 15 Mexico Carbon Black Market Estimates and Forecast, by Application, 2018 - 2030 (Kilotons)
- Table 16 Mexico Carbon Black Market Estimates and Forecast, by Application, 2018 - 2030
- Table 17 Europe Carbon Black Market Estimates and Forecast, by Application, 2018 - 2030 (Kilotons)
- Table 18 Europe Carbon Black Market Estimates and Forecast, by Application, 2018 - 2030 (USD Million)
- Table 19 Germany macro-economic outlay
- Table 20 Germany Carbon Black Market Estimates and Forecast, by Application, 2018 - 2030 (Kilotons)
- Table 21 Germany Carbon Black Market Estimates and Forecast, by Application, 2018 - 2030 (USD Million)
- Table 22 Germany Carbon Black Market Estimates and Forecast, by Application, 2018 - 2030 (Kilotons)
- Table 23 U.K. macro-economic outlay
- Table 24 U.K. Carbon Black Market Estimates and Forecast, by Application, 2018 - 2030 (Kilotons)
- Table 25 U.K. Carbon Black Market Estimates and Forecast, by Application, 2018 - 2030 (USD Million)
- Table 26 France macro-economic outlay
- Table 27 France Carbon Black Market Estimates and Forecast, by Application, 2018 - 2030 (Kilotons)
- Table 28 France Carbon Black Market Estimates and Forecast, by Application, 2018 - 2030 (USD Million)
- Table 29 Asia Pacific Carbon Black Market Estimates and Forecast, by Application, 2018 - 2030 (Kilotons)
- Table 30 Asia Pacific Carbon Black Market Estimates and Forecast, by Application, 2018 - 2030 (USD Million)
- Table 31 China macro-economic outlay
- Table 32 China Carbon Black Market Estimates and Forecast, by Application, 2018 - 2030 (Kilotons)
- Table 33 China Carbon Black Market Estimates and Forecast, by Application, 2018 - 2030 (USD Million)
- Table 34 India macro-economic outlay
- Table 35 India Carbon Black Market Estimates and Forecast, by Application, 2018 - 2030 (Kilotons)
- Table 36 India Carbon Black Market Estimates and Forecast, by Application, 2018 - 2030 (USD Million)
- Table 37 Japan macro-economic outlay
- Table 38 Japan Carbon Black Market Estimates and Forecast, by Application, 2018 - 2030 (Kilotons)
- Table 39 Japan Carbon Black Market Estimates and Forecast, by Application, 2018 - 2030 (USD Million)
- Table 40 Central & South America Carbon Black Market Estimates and Forecast, by Application, 2018 - 2030 (Kilotons)
- Table 41 Central & South America Carbon Black Market Estimates and Forecast, by Application, 2018 - 2030 (USD Million)
- Table 42 Brazil macro-economic outlay
- Table 43 Brazil Carbon Black Market Estimates and Forecast, by Application, 2018 - 2030 (Kilotons)
- Table 44 Brazil Carbon Black Market Estimates and Forecast, by Application, 2018 - 2030 (USD Million)
- Table 45 Middle East & Africa Carbon Black Market Estimates and Forecast, by Application, 2018 - 2030 (Kilotons)
- Table 46 Middle East & Africa Carbon Black Market Estimates and Forecast, by Application, 2018 - 2030 (USD Million)
- Table 47 UAE macro-economic outlay
- Table 48 UAE Carbon Black Market Estimates and Forecast, by Application, 2018 - 2030 (Kilotons)
- Table 49 UAE Carbon Black Market Estimates and Forecast, by Application, 2018 - 2030 (USD Million)
- Table 50 Participant's Overview
- Table 51 Financial Performance
- Table 52 Application Benchmarking
- Table 53 Recent Developments & Impact Analysis, By Key Market Participants
- Table 54 Company Heat Map Analysis
List of Figures
- Fig. 1 Carbon Black Market Segmentation
- Fig. 2 Information Procurement
- Fig. 3 Data Analysis Models
- Fig. 4 Market Formulation And Validation
- Fig. 5 Data Validating & Publishing
- Fig. 6 Market Snapshot
- Fig. 7 Carbon Black Market, Outlook, 2022 (USD Million)
- Fig. 8 Carbon Black Market, Segmental Outlook, 2022 (USD Million)
- Fig. 9 Global Carbon Black Market Volume & Revenue, 2018 - 2030 (Tons) (USD Million)
- Fig. 10 Global Carbon Black Market Value Chain Analysis
- Fig. 11 Global Fertilizer Grade Carbon Black Prices, 2018 - 2030 (USD/Kg)
- Fig. 12 Global Carbon Black Prices, 2018 - 2030 (USD/Kg)
- Fig. 13 Cost structure analysis (%)
- Fig. 14 Carbon Black Market: PORTER's Analysis
- Fig. 15 Carbon Black Market: PESTEL Analysis
- Fig. 16 Global carbon black market revenue share, by application, 2022 & 2030 (%)
- Fig. 17 Tires Market Estimates & Forecasts, 2018 - 2030 (Kilotons) (USD Million)
- Fig. 18 High-performance Coatings Market Estimates & Forecasts, 2018 - 2030 (Kilotons) (USD Million)
- Fig. 19 Plastics Market Estimates & Forecasts, 2018 - 2030 (Kilotons) (USD Million)
- Fig. 20 Other Market Estimates & Forecasts, 2018 - 2030 (Kilotons) (USD Million)
- Fig. 21 Carbon Black Market Estimates & Forecasts, by Application: Key Takeaways (Kilotons) (USD Million)
- Fig. 22 Carbon Black Market Revenue, by Region, 2022 & 2030 (USD Million)
- Fig. 23 North America Carbon Black Market Estimates & Forecasts, 2018 - 2030 (Kilotons) (Kilotons) (USD Million)
- Fig. 24 U.S. Carbon Black Market Estimates & Forecasts, 2018 - 2030 (Kilotons) (USD Million)
- Fig. 25 Canada Carbon Black Market Estimates & Forecasts, 2018 - 2030 (Kilotons) (USD Million)
- Fig. 26 Mexico Carbon Black Market Estimates & Forecasts, 2018 - 2030 (Kilotons) (USD Million)
- Fig. 27 Europe Carbon Black Market Estimates & Forecasts, 2018 - 2030 (Kilotons) (USD Million)
- Fig. 28 Germany Carbon Black Market Estimates & Forecasts, 2018 - 2030 (Kilotons) (USD Million)
- Fig. 29 U.K. Carbon Black Market Estimates & Forecasts, 2018 - 2030 (Kilotons) (USD Million)
- Fig. 30 France Carbon Black Market Estimates & Forecasts, 2018 - 2030 (Kilotons) (USD Million)
- Fig. 31 Asia Pacific Carbon Black Market Estimates & Forecasts, 2018 - 2030 (Kilotons) (USD Million)
- Fig. 32 China Carbon Black Market Estimates & Forecasts, 2018 - 2030 (Kilotons) (USD Million)
- Fig. 33 India Carbon Black Market Estimates & Forecasts, 2018 - 2030 (Kilotons) (USD Million)
- Fig. 34 Japan Carbon Black Market Estimates & Forecasts, 2018 - 2030 (Kilotons) (USD Million)
- Fig. 35 Central & South America Carbon Black Market Estimates & Forecasts, 2018 - 2030 (Kilotons) (USD Million)
- Fig. 36 Brazil Carbon Black Market Estimates & Forecasts, 2018 - 2030 (Kilotons) (USD Million)
- Fig. 37 Middle East & Africa Carbon Black Market Estimates & Forecasts, 2018 - 2030 (Kilotons) (USD Million)
- Fig. 38 UAE Carbon Black Market Estimates & Forecasts, 2018 - 2030 (Kilotons) (USD Million)
- Fig. 39 Key Company Categorization
- Fig. 40 Company Market Positioning
- Fig. 41 Strategy mapping
Carbon Black Market Growth & Trends:
The global carbon black market size is projected to reach USD 31.04 billion by 2030 expanding at a CAGR of 4.8%, according to a new report by Grand View Research, Inc. Increasing tire production on accounted of growing transportation industry is driving the product demand. Carbon black is a highly regulated industry as the manufacturing process is considered harmful owing to the toxic emissions, which have adverse effects on the environment and health. In February 2003, it was added to the California Office of Environmental Health Hazard Assessment (OEHHA) list of substances known to the State that cause cancer.
Major companies in the market are focusing on R&D activities to develop new manufacturing techniques to reduce harmful emissions. Stringent regulations to curb emissions are expected to play a major role in driving the market growth. Emerging countries in Asia Pacific, such as China, Thailand, India, and Indonesia, are projected to generate the maximum product demand in the coming years. Manufacturers in North America and Europe regions are forced to shift their operations to Asian countries owing to low cost in emerging countries. However, recovery in the automotive industry in countries, such as Germany and France, is are anticipated to boost market growth in Europe over the forecast period.
Carbon Black Market Report Highlights:
- In terms of volume, tires segment is anticipated to register a CAGR of 4.8% from 2023 to 20230due to rise in production of tires as a result of high demand from the automotive industry
- Plastics is anticipated to be the fastest-growing application from 2023 to 2030 owing to its rising application scope in the production of high-performance products
- Stable automotive production and a gradually increasing plastics and rubber manufacturing landscape in Brazil is projected to drive the market in Latin America
- Some of the key carbon black manufacturers and suppliers include Evonik, Nippon, Mitsubishi, Jiangxi Black Cat Carbon Black Co. Ltd., Philips Carbon Black, and China Synthetic Rubber Corporation
Table of Contents
Chapter 1 Methodology and Scope
- 1.1 Market Segmentation & Scope
- 1.2 Market Definition
- 1.3 Information Procurement
- 1.3.1 Purchased Database
- 1.3.2 GVR's Internal Database
- 1.3.3 Secondary Sources & Third-Party Perspectives
- 1.4 Information Analysis
- 1.4.1 Data Analysis Models
- 1.5 Market formulation & data visualization
- 1.6 Data validation & publishing
- 1.7 Research Scope and Assumptions
Chapter 2 Executive Summary
- 2.1 Market Snapshot
- 2.2 Segment Snapshot
- 2.3 Competitive Landscape Snapshot
Chapter 2 Market Variables, Trends & Scope
- 3.1 Market Lineage Outlook
- 3.2 Industry Value Chain Analysis
- 3.2.1 Raw Material Trend
- 3.2.2 Manufacturing Trends
- 3.2.3 Sales Channel Analysis
- 3.3 Regulatory Framework
- 3.4 Price Trend Analysis
- 3.4.1 Factors Influencing Prices
- 3.5 Impact of COVID-19
- 3.6 Market Dynamics
- 3.6.1 Market Driver Analysis
- 3.6.2 Market Restraint Analysis
- 3.6.3 Industry Challenges
- 3.6.4 Industry Opportunities
- 3.7 Industry Analysis Tools
- 3.7.1 Porter's Analysis
- 3.7.2 Macro-Environmental Analysis
Chapter 4 Carbon Black Market: Supplier Portfolio Analysis
- 4.1 List of Key Raw Material Suppliers
- 4.2 Raw Material Trends
- 4.3 Portfolio Analysis/Kraljic Matrix
- 4.4 Engagement Model
- 4.5 Negotiation Strategies
- 4.6 Sourcing Best Practices
Chapter 5 Carbon Black Market: Application Estimates & Trend Analysis
- 5.1 Application Movement Analysis & Market Share, 2021 & 2030
- 5.2 Carbon Black Market Size, Forecasts, and Trend Analysis, By Application, 2018 - 2030
- 5.2.1 Tires
- 5.2.2 High-Performance Coatings
- 5.2.3 Plastics
- 5.2.4 Other
Chapter 6 Carbon Black Market: Regional Estimates & Trend Analysis
- 6.1 Carbon Black Market: Regional Outlook
- 6.2 North America
- 6.2.1 North America Carbon Black Market Estimates and Forecasts, by Application, 2018 - 2030 (Kilotons) (USD Million)
- 6.2.2 U.S.
- 6.2.2.1 Key Country Dynamics
- 6.2.2.2 U.S. Carbon Black Market Estimates and Forecasts, by Application, 2018 - 2030 (Kilotons) (USD Million)
- 6.2.3 Canada
- 6.2.3.1 Key Country Dynamics
- 6.2.3.2 Canada Carbon Black Market Estimates and Forecasts, by Application, 2018 - 2030 (Kilotons) (USD Million)
- 6.2.4 Mexico
- 6.2.4.1 Key Country Dynamics
- 6.2.4.2 Mexico Carbon Black Market Estimates and Forecasts, by Application, 2018 - 2030 (Kilotons) (USD Million)
- 6.3 Europe
- 6.3.1 Europe Carbon Black Market Estimates and Forecasts, by Application, 2018 - 2030 (Kilotons) (USD Million)
- 6.3.2 Germany
- 6.3.2.1 Key Country Dynamics
- 6.3.2.2 Germany Carbon Black Market Estimates and Forecasts, by Application, 2018 - 2030 (Kilotons) (USD Million)
- 6.3.3 U.K.
- 6.3.3.1 Key Country Dynamics
- 6.3.3.2 U.K. Carbon Black Market Estimates and Forecasts, by Application, 2018 - 2030 (Kilotons) (USD Million)
- 6.3.4 France
- 6.3.4.1 Key Country Dynamics
- 6.3.4.2 France Carbon Black Market Estimates and Forecasts, by Application, 2018 - 2030 (Kilotons) (USD Million)
- 6.4 Asia Pacific
- 6.4.1 Asia Pacific Carbon Black Market Estimates and Forecasts, by Application, 2018 - 2030 (Kilotons) (USD Million)
- 6.4.2 China
- 6.4.2.1 Key Country Dynamics
- 6.4.2.2 China Carbon Black Market Estimates and Forecasts, by Application, 2018 - 2030 (Kilotons) (USD Million)
- 6.4.3 India
- 6.4.3.1 Key Country Dynamics
- 6.4.3.2 India Carbon Black Market Estimates and Forecasts, by Application, 2018 - 2030 (Kilotons) (USD Million)
- 6.4.4 Japan
- 6.4.4.1 Key Country Dynamics
- 6.4.4.2 Japan Carbon Black Market Estimates and Forecasts, by Application, 2018 - 2030 (Kilotons) (USD Million)
- 6.5 Central & South America
- 6.5.1 Central & South America Carbon Black Market Estimates and Forecasts, by Application, 2018 - 2030 (Kilotons) (USD Million)
- 6.5.2 Brazil
- 6.5.2.1 Key Country Dynamics
- 6.5.2.2 Brazil Carbon Black Market Estimates and Forecasts, by Application, 2018 - 2030 (Kilotons) (USD Million)
- 6.6 Middle East & Africa
- 6.6.1 Middle East & Africa Carbon Black Market Estimates and Forecasts, by Application, 2018 - 2030 (Kilotons) (USD Million)
- 6.6.2 UAE
- 6.6.2.1 Key Country Dynamics
- 6.6.2.2 UAE Carbon Black Market Estimates and Forecasts, by Application, 2018 - 2030 (Kilotons) (USD Million)
Chapter 7 Competitive Landscape
- 7.1 Recent Development & Impact Analysis, By Key Market Participants
- 7.2 Company Categorization
- 7.3 Company Market Share Analysis, 2022
- 7.4 Company Heat Map Analysis
- 7.5 Strategy Mapping
- 7.6 Company Listing (Business Overview, Financial Performance, Application Benchmarking)
- 7.6.1 Orion Engineered Carbons Holdings GmbH
- 7.6.2 OMSK Carbon Group
- 7.6.3 Sid Richardson Carbon & Energy Co.
- 7.6.4 Tokai Carbon Co. Ltd.
- 7.6.5 Asahi Carbon Co. Ltd.
- 7.6.6 Ralson Goodluck Carbon
- 7.6.7 Atlas Organic Pvt. Ltd.
- 7.6.8 Continental Carbon Co.
- 7.6.9 OCI Company Ltd.
- 7.6.10 Birla Carbon
- 7.6.11 Bridgestone Corp.
- 7.6.12 Birla Carbon
- 7.6.13 Cabot Corp.
- 7.6.14 China Synthetic Rubber Corporation (CSRC)
- 7.6.15 Himadri Companies & Industries Ltd. (HCIL)
- 7.6.16 Mitsubishi Chemicals
- 7.6.17 Nippon Steel & Sumikin Chemical Co. Ltd.
- 7.6.18 Jiangxi Black Cat Carbon Black Inc.