|
|
市場調査レポート
商品コード
1268609
ポリビニルアルコール(PVA)市場規模、シェア、動向分析レポート:最終用途別(紙、食品包装、建築、エレクトロニクス)、地域別(北米、欧州、アジア太平洋)、セグメント予測、2023~2030年Polyvinyl Alcohol (PVA) Market Size, Share & Trends Analysis Report By End-use (Paper, Food Packaging, Construction, Electronics), By Region (North America, Europe, Asia Pacific), And Segment Forecasts, 2023 - 2030 |
||||||
|
|
|||||||
|
● お客様のご希望に応じて、既存データの加工や未掲載情報(例:国別セグメント)の追加などの対応が可能です。 詳細はお問い合わせください。 |
|||||||


| ポリビニルアルコール(PVA)市場規模、シェア、動向分析レポート:最終用途別(紙、食品包装、建築、エレクトロニクス)、地域別(北米、欧州、アジア太平洋)、セグメント予測、2023~2030年 |
|
出版日: 2023年04月04日
発行: Grand View Research
ページ情報: 英文 76 Pages
納期: 2~10営業日
|
- 全表示
- 概要
- 図表
- 目次
ポリビニルアルコール(PVA)市場の成長と動向:
Grand View Research, Inc.の最新レポートによると、ポリビニルアルコールの世界市場は、2030年までにCAGR6.4%で16億4,890万米ドルに達すると予測されています。
バイオベースのPVA製品に対するニーズの高まりが、予測期間中の世界産業の成長を促進する主要因になると予想されます。合成水溶性ポリマーであるポリビニルアルコール(PVA)は、さまざまな最終使用産業において、処方プロセスで使用される主要成分となっています。主な最終用途産業には、食品包装、建設、エレクトロニクス、コーティング、印刷、繊維、化粧品、製紙などがあります。PVAは、より優れた水溶性と生分解性を持つ材料であるため、主に食品包装産業からの需要が牽引しています。
PVAには、エタノールや水溶性、油脂に対する耐性などの特性があるため、あまり知られていない代替品も存在します。しかし、厳しい規制がさまざまな用途分野での製品使用を妨げていました。米国労働安全衛生研究所(NIOSH)は、PVA暴露後の予防と環境安全対策についていくつか説明しています。固形廃棄物の発生は、人間の健康、特にこれらの有害な汚染物質の影響を受けやすい子供たちに影響を与える可能性があります。
最終用途に基づき、業界はさらに食品包装、製紙、建設、エレクトロニクス、その他に分類されます。2022年の世界産業は、食品包装分野が大きな市場成長率で支配しています。飲食品業界における生体適合性と無害なパッケージングソリューションへのニーズの高まりが、PVA業界の成長を促進すると予想されます。
生活水準の向上と相まって、消費者の衛生意識の高まりが洗剤の需要を後押ししています。また、病院業界の成長も洗剤の生産に大きく寄与しています。このため、洗剤パッケージング業界では、フィルム状のPVAの需要が増加しています。
この地域の固形廃棄物量の増加は、予測期間中、包装用PVAの需要を促進すると予測されます。また、パッケージングにおける技術革新の高まりや、安全性、利便性、技術、持続可能性に対する消費者のニーズが、予測期間中にこの地域の市場成長を促進すると予想されます。
ポリビニルアルコール(PVA)市場レポートハイライト
- 2022年、食品包装分野が世界産業を支配し、全体の収益シェアの32.4%という最大シェアを占めました。
- アジア太平洋は世界産業をリードし、2022年には全体の収益の53.6%のシェアを占め、2023年から2030年までのCAGRは5.8%でした。紙を中心とした様々な最終用途分野でのPVA需要の増加が、予測期間中の同分野の成長を促進すると予想されます。
目次
第1章 調査手法と範囲
- 調査手法
- 調査範囲と前提条件
- 調査範囲
- 仮定
- データソースのリスト
第2章 エグゼクティブサマリー
- 市場のスナップショット
第3章 ポリビニルアルコール(PVA)市場の変数、動向、および範囲
- 市場セグメンテーションと範囲
- 普及と成長の見通しのマッピング
- バリューチェーン分析
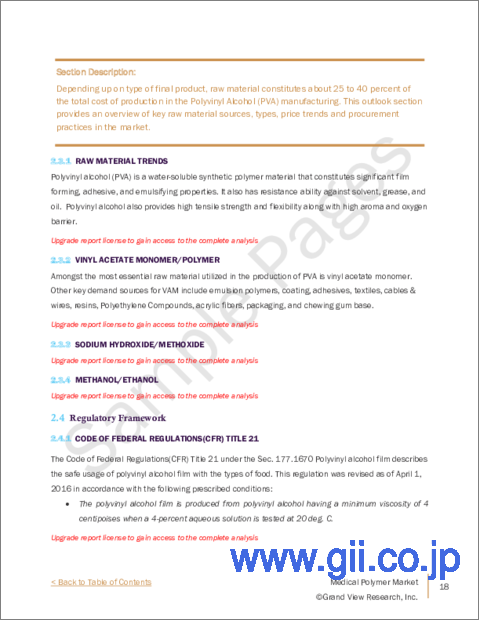
- 原材料分析
- 酢酸ビニルモノマー/ポリマー
- 水酸化ナトリウム/メトキシド
- メタノール/エタノール
- 規制の枠組み
- 連邦規則集(CFR)タイトル21
- 欧州委員会規則(EU)2015/463
- 国立労働安全衛生研究所(NIOSH)
- REACH規則(EC)No. 1907/2006
- ポリビニルアルコール(PVA)市場力学
- 市場促進要因の分析
- アジア太平洋地域からの需要の拡大
- バイオベースの包装のニーズの高まり
- 市場抑制要因分析
- 原材料価格の変動が激しい
- ポリビニルアルコール(PVA)市場- ポーターの分析
- ポリビニルアルコール(PVA)市場-PESTEL分析
第4章 ポリビニルアルコール(PVA)市場:最終用途の推定・動向分析
- 最終用途の変動分析と市場シェア、2022年と2030年
- 紙
- 地域別、2018~2030年
- 地域別、2018~2030年
- 食品包装
- 地域別、2018~2030年
- 地域別、2018~2030年
- 建設
- 地域別、2018~2030年
- 地域別、2018~2030年
- エレクトロニクス
- 地域別、2018~2030年
- 地域別、2018~2030年
- その他
- 地域別、2018~2030年
- 地域別、2018~2030年
第5章 ポリビニルアルコール(PVA)市場:地域推定・動向分析
- 地域変動分析と市場シェア、2022年と2030年
- 世界のポリビニルアルコール(PVA)市場推計・予測、2018~2030年(数量・金額)
- 世界のポリビニルアルコール(PVA)市場推計・予測、2018~2030年(数量・金額)
- 北米
- 最終用途別、2018~2030年
- 米国
- 最終用途別、2018~2030年
- 欧州
- 最終用途別、2018~2030年
- ドイツ
- 最終用途別、2018~2030年
- 英国
- 最終用途別、2018~2030年
- アジア太平洋地域
- 最終用途別、2018~2030年
- 中国
- 最終用途別、2018~2030年
- 日本
- 最終用途別、2018~2030年
- 中南米
- 最終用途別、2018~2030年
- ブラジル
- 最終用途別、2018~2030年
- MEA
- 最終用途別、2018~2030年
第6章 競合情勢
- ベンダー情勢
- 競合環境
- 企業の市場でのポジショニング
- 戦略的枠組み
第7章 企業プロファイル
- Eastman Chemical Company
- 会社概要
- 財務実績
- 製品のベンチマーク
- 戦略的取り組み
- EI du Pont de Nemours and Company
- 会社概要
- 財務実績
- 製品のベンチマーク
- 戦略的取り組み
- OCI Corporation
- 会社概要
- 財務実績
- 製品のベンチマーク
- Celanese Corporation
- 会社概要
- 財務実績
- 製品のベンチマーク
- Nippon Synthetic Chemical Industry Co., Ltd.
- 会社概要
- 財務実績
- 製品のベンチマーク
- 戦略的取り組み
- Solutia, Inc.
- 会社概要
- 財務実績
- 製品のベンチマーク
- 戦略的取り組み
- Sekisui Chemical Co., Ltd.
- 会社概要
- 財務実績
- 製品のベンチマーク
- Chang Chun Petrochemical Co., Ltd.
- 会社概要
- 財務実績
- 製品のベンチマーク
- Japan VAM &Poval Co., Ltd.
- 会社概要
- 財務実績
- 製品のベンチマーク
- Kuraray Co., Ltd.
- 会社概要
- 財務実績
- 製品のベンチマーク
- 戦略的取り組み
- Sinopec Sichuan Vinylon Works
- 会社概要
- 財務実績
- 製品のベンチマーク
- Anhui Wanwei Group Co., Ltd.
- 会社概要
- 財務実績
- 製品のベンチマーク
- Merck KGaA
- 会社概要
- 財務実績
- 製品のベンチマーク
- 戦略的取り組み
List of Tables
- TABLE 1 Global polyvinyl alcohol in paper market estimates and forecasts, 2018 - 2030 (Kilo Tons) (USD Million)
- TABLE 2 Global polyvinyl alcohol in paper market, by region, 2018 - 2030 (Kilo Tons)
- TABLE 3 Global polyvinyl alcohol in paper market, by region, 2018 - 2030 (USD Million)
- TABLE 4 Global polyvinyl alcohol in food packaging market estimates and forecasts, 2018 - 2030 (Kilo Tons) (USD Million)
- TABLE 5 Global polyvinyl alcohol in food packaging market, by region, 2018 - 2030 (Kilo Tons)
- TABLE 6 Global polyvinyl alcohol in food packaging market, by region, 2018 - 2030 (USD Million)
- TABLE 7 Global polyvinyl alcohol in construction market estimates and forecasts, 2018 - 2030 (Kilo Tons) (USD Million)
- TABLE 8 Global polyvinyl alcohol in construction market, by region, 2018 - 2030 (Kilo Tons)
- TABLE 9 Global polyvinyl alcohol in construction market, by region, 2018 - 2030 (USD Million)
- TABLE 10 Global polyvinyl alcohol in electronics market estimates and forecasts, 2018 - 2030 (Kilo Tons) (USD Million)
- TABLE 11 Global polyvinyl alcohol in electronics market, by region, 2018 - 2030 (Kilo Tons)
- TABLE 12 Global polyvinyl alcohol in electronics market, by region, 2018 - 2030 (USD Million)
- TABLE 13 Global polyvinyl alcohol in others market estimates and forecasts, 2018 - 2030 (Kilo Tons) (USD Million)
- TABLE 14 Global polyvinyl alcohol in others market, by region, 2018 - 2030 (Kilo Tons)
- TABLE 15 Global polyvinyl alcohol in others market, by region, 2018 - 2030 (USD Million)
- TABLE 16 Global polyvinyl alcohol market estimates and forecasts, 2018 - 2030 (Kilo Tons) (USD Million)
- TABLE 17 Global polyvinyl alcohol market volume, by region, 2018 - 2030 (Kilo Tons)
- TABLE 18 Global polyvinyl alcohol market revenue, by region, 2018 - 2030 (USD Million)
- TABLE 19 North America polyvinyl alcohol market estimates and forecast, 2018 - 2030 (Kilo Tons) (USD Million)
- TABLE 20 North America polyvinyl alcohol market volume, by end use, 2018 - 2030 (Kilo Tons)
- TABLE 21 North America polyvinyl alcohol market revenue, by end use, 2018 - 2030 (USD Million)
- TABLE 22 U.S. polyvinyl alcohol market estimates and forecast, 2018 - 2030 (Kilo Tons) (USD Million)
- TABLE 23 U.S. polyvinyl alcohol market volume, by end use, 2018 - 2030 (Kilo Tons)
- TABLE 24 U.S. polyvinyl alcohol market revenue, by end use, 2018 - 2030 (USD Million)
- TABLE 25 Europe polyvinyl alcohol market estimates and forecast, 2018 - 2030 (Kilo Tons) (USD Million)
- TABLE 26 Europe polyvinyl alcohol market volume, by end use, 2018 - 2030 (Kilo Tons)
- TABLE 27 Europe polyvinyl alcohol market revenue, by end use, 2018 - 2030 (USD Million)
- TABLE 28 Germany polyvinyl alcohol market estimates and forecast, 2018 - 2030 (Kilo Tons) (USD Million)
- TABLE 29 Germany polyvinyl alcohol market volume, by end use, 2018 - 2030 (Kilo Tons)
- TABLE 30 Germany polyvinyl alcohol market revenue, by end use, 2018 - 2030 (USD Million)
- TABLE 31 U.K. polyvinyl alcohol market estimates and forecast, 2018 - 2030 (Kilo Tons) (USD Million)
- TABLE 32 U.K. polyvinyl alcohol market volume, by end use, 2018 - 2030 (Kilo Tons)
- TABLE 33 U.K. polyvinyl alcohol market revenue, by end use, 2018 - 2030 (USD Million)
- TABLE 34 Asia Pacific polyvinyl alcohol market estimates and forecast, 2018 - 2030 (Kilo Tons) (USD Million)
- TABLE 35 Asia Pacific polyvinyl alcohol market volume, by end-use, 2018 - 2030 (Kilo Tons)
- TABLE 36 Asia Pacific polyvinyl alcohol market value, by end-use, 2018 - 2030 (USD Million)
- TABLE 37 China polyvinyl alcohol market estimates and forecast, 2018 - 2030 (Kilo Tons) (USD Million)
- TABLE 38 China polyvinyl alcohol market volume, by end-use, 2018 - 2030 (Kilo Tons)
- TABLE 39 China polyvinyl alcohol market revenue, by end-use, 2018 - 2030 (USD Million)
- TABLE 40 Japan polyvinyl alcohol market estimates and forecast, 2018 - 2030 (Kilo Tons) (USD Million)
- TABLE 41 Japan polyvinyl alcohol market volume, by end-use, 2018 - 2030 (Kilo Tons)
- TABLE 42 Japan polyvinyl alcohol market revenue, by end-use, 2018 - 2030 (USD Million)
- TABLE 43 Central & South America polyvinyl alcohol market estimates and forecast, 2018 - 2030 (Kilo Tons) (USD Million)
- TABLE 44 Central & South America polyvinyl alcohol market volume, by end-use, 2018 - 2030 (Kilo Tons)
- TABLE 45 Central & South America polyvinyl alcohol market revenue, by end-use, 2018 - 2030 (USD Million)
- TABLE 46 Brazil polyvinyl alcohol market estimates and forecast, 2018 - 2030 (Kilo Tons) (USD Million)
- TABLE 47 Brazil polyvinyl alcohol market volume, by end-use, 2018 - 2030 (Kilo Tons)
- TABLE 48 Brazil polyvinyl alcohol market revenue, by end-use, 2018 - 2030 (USD Million)
- TABLE 49 MEA polyvinyl alcohol market estimates and forecast, 2018 - 2030 (Kilo Tons) (USD Million)
- TABLE 50 MEA polyvinyl alcohol market volume, by end-use, 2018 - 2030 (Kilo Tons)
- TABLE 51 MEA polyvinyl alcohol market revenue, by end-use, 2018 - 2030 (USD Million)
List of Figures
- FIG. 1 Market snapshot
- FIG. 2 Key market opportunity penetration & growth prospect mapping
- FIG. 3 Polyvinyl Market Value Chain Analysis
- FIG. 4 Polyvinyl Alcohol market dynamics
- FIG. 5 Top global construction markets 2010 - 2030 (USD Million)
- FIG. 6 Urban waste generation by income level 2018 - 2030 (Millions tons)
- FIG. 7 U.S. Spot Prices 2018 - 2021 (USD/tons)
- FIG. 8 Polyvinyl alcohol market - Porter's analysis
- FIG. 9 Polyvinyl alcohol market- PESTEL analysis
- FIG. 10 Polyvinyl alcohol end use market outlook: Key takeaways
- FIG. 11 Polyvinyl alcohol market: End use movement analysis, 2022 and 2030
- FIG. 12 Regional market place: Key takeaways
- FIG. 13 Regional outlook, 2022 & 2030 (Kilo Tons)
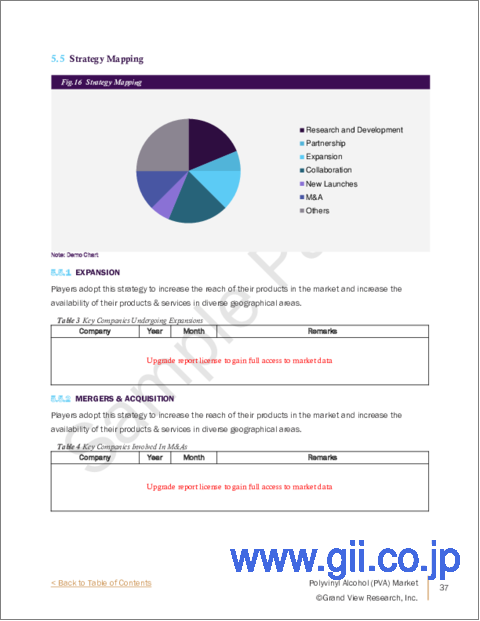
- FIG. 14 Strategy mapping of key market players
Polyvinyl Alcohol Market Growth & Trends:
The global polyvinyl alcohol market is anticipated to reach USD 1,648.9 million by 2030 registering a CAGR of 6.4% according to a new report by Grand View Research, Inc. The increasing need for bio-based PVA products is expected to be a key factor driving the global industry growth over the forecast period. Polyvinyl alcohol (PVA), a synthetic water-soluble polymer, has been the key ingredient used in the formulation process in various end-use industries. The key end-use industries include food packaging, construction, electronics, coatings, printing, textile, cosmetics, and paper. PVA is mainly driven by the demand from the food packaging industry, as it is a material with better water solubility and biodegradable properties.
There are lesser-known substitutes available for PVA on account of its properties including ethanol and water solubility, coupled with resistance to grease and oil. However, stringent regulations hindered product usage in various application segments. The National Institute for Occupational Safety and Health (NIOSH) described several preventive and environmental safety measures after PVA exposure. The generation of solid waste can affect human health, especially children, who are more susceptible to these hazardous pollutants.
On the basis of end-uses, the industry has been further categorized into food packaging, paper, construction, electronics, and others. The food packaging segment dominated the global industry in 2022 with a significant market growth rate. The increasing need for biocompatible and nontoxic packaging solutions in the food & beverage industry is expected to drive the PVA industry growth.
Growing hygiene consciousness among consumers coupled with rising standard of living is propelling demand for detergents. In addition, growth witnessed by the hospitality industry is also contributing significantly to the production of detergents. This, in turn, supplementing overall demand for PVA in form of film in the detergent packaging industry.
The rising solid waste volumes in this region are projected to fuel the demand for PVA in packaging applications over the forecast period. In addition, rising innovation in packaging, and consumer demand for safety, convenience, technology, and sustainability, are expected to fuel the regional market growth over the forecast period.
Polyvinyl Alcohol Market Report Highlights:
- The food packaging segment dominated the global industry in 2022 and accounted for the maximum share of 32.4% of the overall revenue share.
- Asia Pacific led the global industry and accounted for a share of 53.6% of the overall revenue in 2022 with a CAGR of 5.8% from 2023 to 2030. Increasing demand for PVA from various end-use sectors mainly, paper, is expected to propel the segment growth over the forecast period.
- Prominent players operating in the polyvinyl alcohol (PVA) market are E. I. du Pont de Nemours and Company; Nippon Synthetic Chemical Industry Co.; Eastman Chemical Company; Sekisui Chemical Co. Ltd.; Kuraray Co. Ltd.; Sinopec Sichuan Vinylon; Anhui Wanwei Group Co., Ltd., and others.
Table of Contents
Chapter 1 Methodology and Scope
- 1.1 Research methodology
- 1.2 Research scope & assumptions
- 1.2.1 Research Scope
- 1.2.2 Assumptions
- 1.3 List of data sources
Chapter 2 Executive Summary
- 2.1 Market snapshot
Chapter 3 Polyvinyl Alcohol Market Variables, Trends, and Scope
- 3.1 Market segmentation and scope
- 3.1.1 Penetration and growth prospect mapping
- 3.2 Value chain analysis
- 3.2.1 Raw material analysis
- 3.2.2 Vinyl acetate monomer/polymer
- 3.2.3 sodium hydroxide/methoxide
- 3.2.4 Methanol/Ethanol
- 3.3 Regulatory framework
- 3.3.1 Code of Federal Regulations(CFR) Title 21
- 3.3.2 Commission Regulation (EU) 2015/463
- 3.3.3 The National Institute for Occupational Safety and Health (NIOSH)
- 3.3.4 REACH regulation (EC) No. 1907/2006
- 3.4 Polyvinyl Alcohol market dynamics
- 3.4.1 Market Driver Analysis
- 3.4.2 Growing demand from the Asia Pacific region
- 3.4.3 Increasing need for bio-based packaging
- 3.4.4 Market restraint analysis
- 3.4.5 Volatile prices of raw materials
- 3.5 Polyvinyl alcohol market - Porter's analysis
- 3.6 Polyvinyl alcohol market- PESTEL analysis
Chapter 4 Polyvinyl Alcohol Market: End Use Estimates & Trend Analysis
- 4.1 End Use movement analysis & market share, 2022 & 2030
- 4.2 Paper
- 4.2.1 Global polyvinyl alcohol in paper market estimates and forecasts, 2014 - 2025 (Kilo Tons) (USD Million)
- 4.2.2 Global polyvinyl alcohol in paper market estimates and forecasts, by region, 2018 - 2030 (Kilo Tons)
- 4.2.3 Global polyvinyl alcohol in paper market estimates and forecasts, by region, 2018 - 2030 (USD Million)
- 4.3 Food Packaging
- 4.3.1 Global polyvinyl alcohol in food packaging market estimates and forecasts, 2018 - 2030 (Kilo Tons) (USD Million)
- 4.3.2 Global polyvinyl alcohol in food packaging market estimates and forecasts, by region, 2018 - 2030 (Kilo Tons)
- 4.3.3 Global polyvinyl alcohol in food packaging market estimates and forecasts, by region, 2018 - 2030 (USD Million)
- 4.4 Construction
- 4.4.1 Global polyvinyl alcohol in construction market estimates and forecasts, 2018 - 2030 (Kilo Tons) (USD Million)
- 4.4.2 Global polyvinyl alcohol in construction market estimates and forecasts, by region, 2018 - 2030 (Kilo Tons)
- 4.4.3 Global polyvinyl alcohol in construction market estimates and forecasts, by region, 2018 - 2030 (USD Million)
- 4.5 Electronics
- 4.5.1 Global polyvinyl alcohol in electronics market estimates and forecasts, 2018 - 2030 (Kilo Tons) (USD Million)
- 4.5.2 Global polyvinyl alcohol in electronics market estimates and forecasts, by region, 2018 - 2030 (Kilo Tons)
- 4.5.3 Global polyvinyl alcohol in electronics market estimates and forecasts, by region, 2018 - 2030 (USD Million)
- 4.6 Others
- 4.6.1 Global polyvinyl alcohol in others market estimates and forecasts, 2018 - 2030 (Kilo Tons) (USD Million)
- 4.6.2 Global polyvinyl alcohol in others market estimates and forecasts, by region, 2018 - 2030 (Kilo Tons)
- 4.6.3 Global polyvinyl alcohol in others market estimates and forecasts, by region, 2018 - 2030 (USD Million)
Chapter 5 Polyvinyl Alcohol Market: Regional Estimates & Trend Analysis
- 5.1 Regional movement analysis & market share, 2022 and 2030
- 5.2 Global polyvinyl alcohol market estimates and forecast, 2018 - 2030 (Kilo Tons) (USD Million)
- 5.3 Global polyvinyl alcohol market estimates and forecast, 2018 - 2030 (Kilo Tons) (USD Million)
- 5.4 North America
- 5.4.1 North America polyvinyl alcohol market estimates and forecast, 2018 - 2030 (Kilo Tons) (USD Million)
- 5.4.2 North America polyvinyl alcohol market estimates and forecast, by end use, 2018 - 2030 (Kilo Tons) (USD Million)
- 5.5 U.S.
- 5.5.1 U.S. polyvinyl alcohol market estimates and forecast, 2018 - 2030 (Kilo Tons) (USD Million)
- 5.5.2 U.S. polyvinyl alcohol market estimates and forecast, by end use, 2018 - 2030 (Kilo Tons) (USD Million)
- 5.6 Europe
- 5.6.1 Europe polyvinyl alcohol market estimates and forecast, 2018 - 2030 (Kilo Tons) (USD Million)
- 5.6.2 Europe polyvinyl alcohol market estimates and forecast, by end use, 2018 - 2030 (Kilo Tons) (USD Million)
- 5.7 Germany
- 5.7.1 Germany polyvinyl alcohol market estimates and forecast, 2018 - 2030 (Kilo Tons) (USD Million)
- 5.7.2 Germany polyvinyl alcohol market estimates and forecast, by end use, 2018 - 2030 (Kilo Tons) (USD Million)
- 5.8 U.K.
- 5.8.1 U.K. polyvinyl alcohol market estimates and forecast, 2018 - 2030 (Kilo Tons) (USD Million)
- 5.8.2 U.K. polyvinyl alcohol market estimates and forecast, by end use, 2018 - 2030 (Kilo Tons) (USD Million)
- 5.9 Asia Pacific
- 5.9.1 Asia Pacific polyvinyl alcohol market estimates and forecast, 2018 - 2030 (Kilo Tons) (USD Million)
- 5.9.2 Asia Pacific polyvinyl alcohol market estimates and forecast, by end-use, 2018 - 2030 (Kilo Tons) (USD Million)
- 5.10 China
- 5.10.1 China polyvinyl alcohol market estimates and forecast, 2018 - 2030 (Kilo Tons) (USD Million)
- 5.10.2 China polyvinyl alcohol market estimates and forecast, by end-use, 2018 - 2030 (Kilo Tons) (USD Million)
- 5.11 Japan
- 5.11.1 Japan polyvinyl alcohol market estimates and forecast, 2018 - 2030 (Kilo Tons) (USD Million)
- 5.11.2 Japan polyvinyl alcohol market estimates and forecast, by end-use, 2018 - 2030 (Kilo Tons) (USD Million)
- 5.12 Central & South America
- 5.12.1 Central & South America polyvinyl alcohol market estimates and forecast, 2018 - 2030 (Kilo Tons) (USD Million)
- 5.12.2 Central & South America polyvinyl alcohol market estimates and forecast, by end-use, 2018 - 2030 (Kilo Tons) (USD Million)
- 5.13 Brazil
- 5.13.1 Brazil polyvinyl alcohol market estimates and forecast, 2018 - 2030 (Kilo Tons) (USD Million)
- 5.13.2 Brazil polyvinyl alcohol market estimates and forecast, by end-use, 2018 - 2030 (Kilo Tons) (USD Million)
- 5.14 MEA
- 5.14.1 MEA polyvinyl alcohol market estimates and forecast, 2018 - 2030 (Kilo Tons) (USD Million)
- 5.14.2 MEA polyvinyl alcohol market estimates and forecast, by end-use, 2018 - 2030 (Kilo Tons) (USD Million)
Chapter 6 Competitive Landscape
- 6.1 Vendor landscape
- 6.2 Competitive environment
- 6.3 Company market positioning
- 6.4 Strategic Framework
Chapter 7 Company Profiles
- 7.1 Eastman Chemical Company
- 7.1.1 Company overview
- 7.1.2 Financial performance
- 7.1.3 Product benchmarking
- 7.1.4 Strategic initiatives
- 7.2 E. I. du Pont de Nemours and Company
- 7.2.1 Company overview
- 7.2.2 Financial performance
- 7.2.3 Product benchmarking
- 7.2.4 Strategic initiatives
- 7.3 OCI Corporation
- 7.3.1 Company overview
- 7.3.2 Financial performance
- 7.3.3 Product benchmarking
- 7.4 Celanese Corporation
- 7.4.1 Company overview
- 7.4.2 Financial performance
- 7.4.3 Product benchmarking
- 7.5 Nippon Synthetic Chemical Industry Co., Ltd.
- 7.5.1 Company overview
- 7.5.2 Financial performance
- 7.5.3 Product benchmarking
- 7.5.4 Strategic initiatives
- 7.6 Solutia, Inc.
- 7.6.1 Company overview
- 7.6.2 Financial performance
- 7.6.3 Product Benchmarking
- 7.6.4 Strategic initiatives
- 7.7 Sekisui Chemical Co., Ltd.
- 7.7.1 Company overview
- 7.7.2 Financial performance
- 7.7.3 Product benchmarking
- 7.8 Chang Chun Petrochemical Co., Ltd.
- 7.8.1 Company overview
- 7.8.2 Financial performance
- 7.8.3 Product benchmarking
- 7.9 Japan VAM & Poval Co., Ltd.
- 7.9.1 Company overview
- 7.9.2 Financial performance
- 7.9.3 Product benchmarking
- 7.10 Kuraray Co., Ltd.
- 7.10.1 Company overview
- 7.10.2 Financial performance
- 7.10.3 Product benchmarking
- 7.10.4 Strategic initiatives
- 7.11 Sinopec Sichuan Vinylon Works
- 7.11.1 Company overview
- 7.11.2 Financial performance
- 7.11.3 Product benchmarking
- 7.12 Anhui Wanwei Group Co., Ltd.
- 7.12.1 Company overview
- 7.12.2 Financial performance
- 7.12.3 Product benchmarking
- 7.13 Merck KGaA
- 7.13.1 Company overview
- 7.13.2 Financial performance
- 7.13.3 Product benchmarking
- 7.13.4 Strategic initiatives