|
|
市場調査レポート
商品コード
1233191
建築用断熱材の市場規模、シェア、動向分析レポート製品別(グラスウール、ミネラルウール、EPS、XPS、セルロース)、用途別(屋根、壁、床)、最終用途別、地域別、セグメント別予測、2023~2030年Building Thermal Insulation Market Size, Share & Trends Analysis Report By Product (Glass Wool, Mineral Wool, EPS, XPS, Cellulose), By Application (Roof, Walls, Floor), By End-use,By Region, And Segment Forecasts, 2023 - 2030 |
||||||
|
|
|||||||
|
● お客様のご希望に応じて、既存データの加工や未掲載情報(例:国別セグメント)の追加などの対応が可能です。 詳細はお問い合わせください。 |
|||||||


| 建築用断熱材の市場規模、シェア、動向分析レポート製品別(グラスウール、ミネラルウール、EPS、XPS、セルロース)、用途別(屋根、壁、床)、最終用途別、地域別、セグメント別予測、2023~2030年 |
|
出版日: 2023年02月15日
発行: Grand View Research
ページ情報: 英文 140 Pages
納期: 2~10営業日
|
- 全表示
- 概要
- 図表
- 目次
建築用断熱材市場の成長と動向
Grand View Research, Inc.の新しいレポートによると、世界の建築用断熱材市場規模は、2023年から2030年まで4.5%のCAGRで拡大し、2030年までに446億9000万米ドルに達すると予想されています。
全体的なエネルギー消費の低減に焦点を当てた有利な規制が、建築用断熱材の人気上昇の主な要因になりそうです。断熱材は、建物内の熱の蓄積を軽減し、空調への依存度を下げる効果があります。これは、エネルギーコストの削減に貢献します。
都市部の人口が増加し、手頃な価格の住宅が限られるようになりました。また、道路が混雑し、水や衛生設備が不十分であることも問題となっています。特に中東・アフリカでは、インフラの不足が深刻な地域から、強固なインフラを整備する段階に移行しつつあり、住宅、商業施設、工業施設における断熱材の需要を促進することが期待されます。
ミネラルウールは、最も環境に配慮した断熱材の一つです。建築物の断熱材として広く使われている素材です。ミネラルウールは、エネルギー効率の維持に役立ち、防火効果を発揮し、音響効果も高いです。ミネラルウールは、ドロマイト、ディアベース、玄武岩などの火山岩から製造され、豊富に入手することができます。
壁面断熱用途は、建物内の壁の表面積が大きく、同用途の製品普及率が高いこともあり、2022年の需要全体を支配し、予測期間中もこの傾向が続くと予想されます。学校、病院、劇場、ショッピングモール、ホテルなどの施設建築物は、豪華な建築を採用し、高いエネルギー効率基準を維持しています。このように、壁用断熱材は世界中の建物のエネルギー消費基準を維持する上で重要な役割を果たすため、これらの動向は予測期間中、壁用断熱材製品の需要にプラスの影響を与えると予測されます。
市場の企業は、特性を強化した費用対効果の高い断熱製品を開発することで、製品ポートフォリオの拡充に力を注いでいます。また、世界的に高まる製品需要に対応するため、メーカー各社は製造能力の拡充に注力しています。さらに、これらの企業は、市場の変動や技術的・地理的な変化に対応するために、強力なビジネスモデルを開発しています。
建築用断熱材市場レポートハイライト
- EPS製品セグメントは、2022年のビル用断熱材業界の世界シェアの31%を占めています。EPSは優れた絶縁強度を示し、化学物質、熱、湿気に対する耐性があるため、建築用途の電気部品の絶縁に適した材料となっています。発泡プラスチックは、世界中のさまざまな政府別課されるエネルギー効率規制により、建築物の断熱材用途で大きな需要が見込まれています。
- 床材用途は、2022年に全体量の22%以上を占めています。断熱基準を満たすためには、1階部分の強度が必要であり、床材、下地材、断熱層、土台を含む多層構造の基礎が必要です。床材に使用される断熱材は、優れた遮熱性とともに高い圧縮強度が要求されます。そのため、XPSは床材用途の断熱材として最もよく使われる材料の一つです。
- 断熱材は、住宅、商業施設、オフィス、施設、工業施設など、建築・建設業界で幅広く使用されている重要な部品です。住宅建設分野には、住宅、アパート、複合施設、小規模住宅が含まれます。新興経済諸国における一戸建て住宅の増加や消費者の可処分所得の増加は、住宅建設活動を促進すると予測されています。したがって、住宅建設部門の成長と建築物のエネルギー消費基準の高まりは、上記の用途における断熱材の需要にプラスの影響を与えると予測されます。
- アジア太平洋地域は、この地域の建設産業の大きな可能性と、様々な政府別課されたグリーンエネルギー建築基準の義務化により、最も速い成長率を示すと予測されます。アジア太平洋地域の主要な経済圏は、公共インフラの整備や住宅建設セクターの拡大のために様々な政府が大規模な投資を行っているため、予測期間中に繁栄すると予想され、アジア太平洋地域の製品需要に恩恵をもたらすと考えられています。
目次
第1章 調査手法と範囲
- 市場セグメンテーションと範囲
- 仮定
- 情報調達
- 購入したデータベース
- GVRの内部データベース
- 二次情報と第三者の視点
- 1次調査
- 情報分析
- データ分析モデル
- 市場形成とデータ可視化
- データの検証と公開
第2章 エグゼクティブサマリー
- 市場の見通し
- セグメント別見通し
- 競合考察
第3章 市場変数、動向、および範囲
- 市場系列の見通し
- 業界バリューチェーン分析
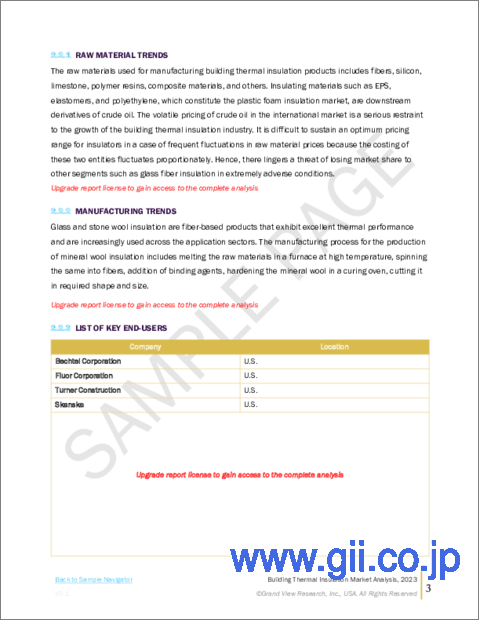
- 原材料の動向
- 製造動向
- 価格動向分析
- 市場力学
- 市場促進要因分析
- 市場抑制要因分析
- 市場機会分析
- 業界の課題
- 規制の枠組み
- 製品分類コード
- 規格とコンプライアンス
- 安全性
- ビジネス環境ツール分析:建築用断熱材市場
- ポーターのファイブフォース分析
- 供給企業の交渉力
- 買い手の交渉力
- 代替の脅威
- 新規参入業者の脅威
- 競争企業間の敵対関係
- SWOTによるPESTLE
- 政治情勢
- 経済情勢
- 社会情勢
- テクノロジー情勢
- 環境情勢
- 法的情勢
- 主要取引と戦略的提携分析
- 合弁事業
- 合併と買収
- ライセンシングとパートナーシップ
- 技術連携
- 戦略的売却
- 市場参入戦略
- 市場の混乱分析
- ポーターのファイブフォース分析
第4章 建築用断熱材市場、製品別、2018~2030年(数量、キロトン、収益、USD Million)
- 重要ポイント
- 製品市場シェア分析、2022年および2030年
- グラスウール
- ミネラルウール
- EPS
- XPS
- セルロース
- その他
第5章 建築用断熱材市場、用途別、2018~2030年(数量、キロトン、収益、百万米ドル)
- 重要ポイント
- 製品市場シェア分析、2022年および2030年
- 屋根
- 壁
- 床
第6章 建築用断熱材市場、2018年から2030年までの最終用途別(数量、キロトン、収益、USD Million)
- 重要ポイント
- アプリケーション市場シェア分析、2022年および2030年
- 住宅
- 商業
第7章 建築用断熱材市場、2018年から2030年までの地域別(量、キロトン、収益、百万米ドル)
- 重要ポイント
- 地域市場シェア分析、2022年および2030年
- 北米
- 米国
- カナダ
- メキシコ
- 欧州
- ドイツ
- 英国
- フランス
- イタリア
- スペイン
- アジア太平洋地域
- インド
- 中国
- 日本
- 韓国
- インドネシア
- マレーシア
- 中南米
- ブラジル
- アルゼンチン
- 中東とアフリカ
- サウジアラビア
- アラブ首長国連邦
- カタール
- 南アフリカ
第8章 建築用断熱材市場のサプライヤーインテリジェンス
- Kraljicマトリックス(ポートフォリオ分析)
- エンゲージメントモデル
- 交渉戦略
- 調達のベストプラクティス
- ベンダーの選択基準
- 原材料サプライヤー一覧
- 設備サプライヤー一覧
- エンドユーザー一覧
第9章 競合情勢
- 主要な世界プレーヤー、その最近の展開、および業界への影響
- 参入企業
- 公開会社
- 企業の市況分析
- 競合ダッシュボード分析
- 市場の差別化要因
- 相乗効果分析:主要取引と戦略的提携
- 非公開会社
- 新興プレーヤーのリスト
第10章 企業プロファイル
- Rockwool International A/S
- 会社概要
- 財務実績
- 製品のベンチマーク
- 戦略的イニシアチブ
- GAF Materials Corporation
- 会社概要
- 財務実績
- 製品のベンチマーク
- 戦略的イニシアチブ
- Guardian Building Products, Inc.
- 会社概要
- 財務実績
- 製品のベンチマーク
- 戦略的イニシアチブ
- Huntsman International LLC
- 会社概要
- 財務実績
- 製品のベンチマーク
- 戦略的イニシアチブ
- Johns Manville Corporation
- 会社概要
- 財務実績
- 製品のベンチマーク
- 戦略的イニシアチブ
- Cellofoam North America, Inc.
- 会社概要
- 財務実績
- 製品のベンチマーク
- 戦略的イニシアチブ
- Atlas Roofing Corporation
- 会社概要
- 財務実績
- 製品のベンチマーク
- 戦略的イニシアチブ
- CertainTeed Corporation
- 会社概要
- 財務実績
- 製品のベンチマーク
- 戦略的イニシアチブ
- Roxul, Inc.
- 会社概要
- 財務実績
- 製品のベンチマーク
- 戦略的イニシアチブ
- Dow Building Solutions
- 会社概要
- 財務実績
- 製品のベンチマーク
- 戦略的イニシアチブ
- Owens Corning Corporation
- 会社概要
- 財務実績
- 製品のベンチマーク
- 戦略的イニシアチブ
- Saint-Gobain SA
- 会社概要
- 財務実績
- 製品のベンチマーク
- 戦略的イニシアチブ
- Byucksan Corporation
- 会社概要
- 財務実績
- 製品のベンチマーク
- 戦略的イニシアチブ
- Kingspan Group PLC
- 会社概要
- 財務実績
- 製品のベンチマーク
- 戦略的イニシアチブ
- BASF Polyurethanes GmbH
- 会社概要
- 財務実績
- 製品のベンチマーク
- 戦略的イニシアチブ
List of Tables
- Table 1. Building thermal insulation market estimates and forecasts, by glass wool, 2014 - 2025 (Kilotons) (USD Million)
- Table 2. Building thermal insulation market estimates and forecasts, by mineral wool, 2014 - 2025 (Kilotons) (USD Million)
- Table 3. Building thermal insulation market estimates and forecasts, by EPS, 2014 - 2025 (Kilotons) (USD Million)
- Table 4. Building thermal insulation market estimates and forecasts, by XPS, 2014 - 2025 (Kilotons) (USD Million)
- Table 5. Building thermal insulation market estimates and forecasts, by other applications, 2014 - 2025 (Kilotons) (USD Million)
- Table 6. Building thermal insulation market estimates and forecasts, for the roof, 2014 - 2025 (Kilotons) (USD Million)
- Table 7. Building thermal insulation market estimates and forecasts, for the wall, 2014 - 2025 (Kilotons) (USD Million)
- Table 8. Building thermal insulation market estimates and forecasts, for the floor, 2014 - 2025 (Kilotons) (USD Million)
- Table 9. Building thermal insulation market estimates and forecasts in residential construction, 2014 - 2025 (Kilotons) (USD Million)
- Table 10. Building thermal insulation market estimates and forecasts in commercial construction, 2014 - 2025 (Kilotons) (USD Million)
- Table 11. North America building thermal insulation market estimates and forecasts, 2014 - 2025 (Kilotons) (USD Million)
- Table 12. North America building thermal insulation market volume estimates and forecasts, by product (Kilotons)
- Table 13. North America building thermal insulation market revenue estimates and forecasts by product, 2014 - 2025 (USD Million)
- Table 14. North America building thermal insulation market volume estimates and forecasts by application, 2014 - 2025 (Kilotons)
- Table 15. North America building thermal insulation market revenue estimates and forecasts by application, 2014 - 2025 (Kilotons)
- Table 16. North America building thermal insulation market volume estimates and forecasts by end-use, 2014 - 2025 (Kilotons)
- Table 17. North America building thermal insulation market revenue estimates and forecasts, by end-use, 2014 - 2025 (USD million)
- Table 18. U.S. building thermal insulation market estimates and forecasts, 2014 - 2025 (Kilotons) (USD Million)
- Table 19. U.S. building thermal insulation market volume estimates and forecasts, by product (Kilotons)
- Table 20. U.S. building thermal insulation market revenue estimates and forecasts by product, 2014 - 2025 (USD Million)
- Table 21. U.S. building thermal insulation market volume estimates and forecasts by application, 2014 - 2025 (Kilotons)
- Table 22. U.S. building thermal insulation market revenue estimates and forecasts by application, 2014 - 2025 (Kilotons)
- Table 23. U.S. building thermal insulation market volume estimates and forecasts by end-use, 2014 - 2025 (Kilotons)
- Table 24. U.S. building thermal insulation market revenue estimates and forecasts, by end-use, 2014 - 2025 (USD million)
- Table 25. Canada building thermal insulation market estimates and forecasts, 2014 - 2025 (Kilotons) (USD Million)
- Table 26. Canada building thermal insulation market volume estimates and forecasts, by product (Kilotons)
- Table 27. Canada building thermal insulation market revenue estimates and forecasts by product, 2014 - 2025 (USD Million)
- Table 28. Canada building thermal insulation market volume estimates and forecasts by application, 2014 - 2025 (Kilotons)
- Table 29. Canada building thermal insulation market revenue estimates and forecasts by application, 2014 - 2025 (Kilotons)
- Table 30. Mexico building thermal insulation market estimates and forecasts, 2014 - 2025 (Kilotons) (USD Million)
- Table 31. Mexico building thermal insulation market volume estimates and forecasts, by product (Kilotons)
- Table 32. Mexico building thermal insulation market revenue estimates and forecasts by product, 2014 - 2025 (USD Million)
- Table 33. Mexico building thermal insulation market volume estimates and forecasts by application, 2014 - 2025 (Kilotons)
- Table 34. Mexico building thermal insulation market revenue estimates and forecasts by application, 2014 - 2025 (Kilotons)
- Table 35. Europe building thermal insulation market estimates and forecasts, 2014 - 2025 (Kilotons) (USD Million)
- Table 36. Europe building thermal insulation market volume estimates and forecasts, by product (Kilotons)
- Table 37. Europe building thermal insulation market revenue estimates and forecasts by product, 2014 - 2025 (USD Million)
- Table 38. Europe building thermal insulation market volume estimates and forecasts by application, 2014 - 2025 (Kilotons)
- Table 39. Europe building thermal insulation market revenue estimates and forecasts by application, 2014 - 2025 (Kilotons)
- Table 40. Germany building thermal insulation market estimates and forecasts, 2014 - 2025 (Kilotons) (USD Million)
- Table 41. Germany building thermal insulation market volume estimates and forecasts, by product (Kilotons)
- Table 42. Germany building thermal insulation market revenue estimates and forecasts by product, 2014 - 2025 (USD Million)
- Table 43. Germany building thermal insulation market volume estimates and forecasts by application, 2014 - 2025 (Kilotons)
- Table 44. Germany building thermal insulation market revenue estimates and forecasts by application, 2014 - 2025 (Kilotons)
- Table 45. U.K. building thermal insulation market estimates and forecasts, 2014 - 2025 (Kilotons) (USD Million)
- Table 46. U.K. building thermal insulation market volume estimates and forecasts, by product (Kilotons)
- Table 47. U.K. building thermal insulation market revenue estimates and forecasts by product, 2014 - 2025 (USD Million)
- Table 48. U.K. building thermal insulation market volume estimates and forecasts by application, 2014 - 2025 (Kilotons)
- Table 49. U.K. building thermal insulation market revenue estimates and forecasts by application, 2014 - 2025 (Kilotons)
- Table 50. France building thermal insulation market estimates and forecasts, 2014 - 2025 (Kilotons) (USD Million)
- Table 51. France building thermal insulation market volume estimates and forecasts, by product (Kilotons)
- Table 52. France building thermal insulation market revenue estimates and forecasts by product, 2014 - 2025 (USD Million)
- Table 53. France building thermal insulation market volume estimates and forecasts by application, 2014 - 2025 (Kilotons)
- Table 54. France building thermal insulation market revenue estimates and forecasts by application, 2014 - 2025 (Kilotons)
- Table 55. Italy building thermal insulation market estimates and forecasts, 2014 - 2025 (Kilotons) (USD Million)
- Table 56. Italy building thermal insulation market volume estimates and forecasts, by product (Kilotons)
- Table 57. Italy building thermal insulation market revenue estimates and forecasts by product, 2014 - 2025 (USD Million)
- Table 58. Italy building thermal insulation market volume estimates and forecasts by application, 2014 - 2025 (Kilotons)
- Table 59. Italy building thermal insulation market revenue estimates and forecasts by application, 2014 - 2025 (Kilotons)
- Table 60. Spain building thermal insulation market estimates and forecasts, 2014 - 2025 (Kilotons) (USD Million)
- Table 61. Spain building thermal insulation market volume estimates and forecasts, by product (Kilotons)
- Table 62. Spain building thermal insulation market revenue estimates and forecasts by product, 2014 - 2025 (USD Million)
- Table 63. Spain building thermal insulation market volume estimates and forecasts by application, 2014 - 2025 (Kilotons)
- Table 64. Spain building thermal insulation market revenue estimates and forecasts by application, 2014 - 2025 (Kilotons)
- Table 65. Asia Pacific building thermal insulation market estimates and forecasts, 2014 - 2025 (Kilotons) (USD Million)
- Table 66. the Asia Pacific building thermal insulation market volume estimates and forecasts, by product (Kilotons)
- Table 67. Asia Pacific building thermal insulation market revenue estimates and forecasts by product, 2014 - 2025 (USD Million)
- Table 68. Asia Pacific building thermal insulation market volume estimates and forecasts by application, 2014 - 2025 (Kilotons)
- Table 69. Asia Pacific building thermal insulation market revenue estimates and forecasts by application, 2014 - 2025 (Kilotons)
- Table 70. China building thermal insulation market estimates and forecasts, 2014 - 2025 (Kilotons) (USD Million)
- Table 71. China building thermal insulation market volume estimates and forecasts, by product (Kilotons)
- Table 72. China building thermal insulation market revenue estimates and forecasts by product, 2014 - 2025 (USD Million)
- Table 73. China building thermal insulation market volume estimates and forecasts by application, 2014 - 2025 (Kilotons)
- Table 74. China building thermal insulation market revenue estimates and forecasts by application, 2014 - 2025 (Kilotons)
- Table 75. India building thermal insulation market estimates and forecasts, 2014 - 2025 (Kilotons) (USD Million)
- Table 76. India building thermal insulation market volume estimates and forecasts, by product (Kilotons)
- Table 77. India building thermal insulation market revenue estimates and forecasts by product, 2014 - 2025 (USD Million)
- Table 78. India building thermal insulation market volume estimates and forecasts by application, 2014 - 2025 (Kilotons)
- Table 79. India building thermal insulation market revenue estimates and forecasts by application, 2014 - 2025 (Kilotons)
- Table 80. Japan building thermal insulation market estimates and forecasts, 2014 - 2025 (Kilotons) (USD Million)
- Table 81. Japan building thermal insulation market volume estimates and forecasts, by product (Kilotons)
- Table 82. Japan building thermal insulation market revenue estimates and forecasts by product, 2014 - 2025 (USD Million)
- Table 83. Japan building thermal insulation market volume estimates and forecasts by application, 2014 - 2025 (Kilotons)
- Table 84. Japan building thermal insulation market revenue estimates and forecasts by application, 2014 - 2025 (Kilotons)
- Table 85. South Korea building thermal insulation market estimates and forecasts, 2014 - 2025 (Kilotons) (USD Million)
- Table 86. South Korea building thermal insulation market volume estimates and forecasts, by product (Kilotons)
- Table 87. South Korea building thermal insulation market revenue estimates and forecasts by product, 2014 - 2025 (USD Million)
- Table 88. South Korea building thermal insulation market volume estimates and forecasts by application, 2014 - 2025 (Kilotons)
- Table 89. South Korea building thermal insulation market revenue estimates and forecasts by application, 2014 - 2025 (Kilotons)
- Table 90. Indonesia building thermal insulation market estimates and forecasts, 2014 - 2025 (Kilotons) (USD Million)
- Table 91. Indonesia building thermal insulation market volume estimates and forecasts, by product (Kilotons)
- Table 92. Indonesia building thermal insulation market revenue estimates and forecasts by product, 2014 - 2025 (USD Million)
- Table 93. Indonesia building thermal insulation market volume estimates and forecasts by application, 2014 - 2025 (Kilotons)
- Table 94. Indonesia building thermal insulation market revenue estimates and forecasts by application, 2014 - 2025 (Kilotons)
- Table 95. Malaysia building thermal insulation market estimates and forecasts, 2014 - 2025 (Kilotons) (USD Million)
- Table 96. Malaysia building thermal insulation market volume estimates and forecasts, by product (Kilotons)
- Table 97. Malaysia building thermal insulation market revenue estimates and forecasts by product, 2014 - 2025 (USD Million)
- Table 98. Malaysia building thermal insulation market volume estimates and forecasts by application, 2014 - 2025 (Kilotons)
- Table 99. Malaysia building thermal insulation market revenue estimates and forecasts by application, 2014 - 2025 (Kilotons)
- Table 100. Central & South America building thermal insulation market estimates and forecasts, 2014 - 2025 (Kilotons) (USD Million)
- Table 101. Central & South America building thermal insulation market volume estimates and forecasts, by product (Kilotons)
- Table 102. Central & South America building thermal insulation market revenue estimates and forecasts by product, 2014 - 2025 (USD Million)
- Table 103. Central & South America building thermal insulation market volume estimates and forecasts by application, 2014 - 2025 (Kilotons)
- Table 104. Central & South America building thermal insulation market revenue estimates and forecasts by application, 2014 - 2025 (Kilotons)
- Table 105. Brazil building thermal insulation market estimates and forecasts, 2014 - 2025 (Kilotons) (USD Million)
- Table 106. Brazil building thermal insulation market volume estimates and forecasts, by product (Kilotons)
- Table 107. Brazil building thermal insulation market revenue estimates and forecasts by product, 2014 - 2025 (USD Million)
- Table 108. Brazil building thermal insulation market volume estimates and forecasts by application, 2014 - 2025 (Kilotons)
- Table 109. Brazil building thermal insulation market revenue estimates and forecasts by application, 2014 - 2025 (Kilotons)
- Table 110. Argentina building thermal insulation market estimates and forecasts, 2014 - 2025 (Kilotons) (USD Million)
- Table 111. Argentina building thermal insulation market volume estimates and forecasts, by product (Kilotons)
- Table 112. Argentina building thermal insulation market revenue estimates and forecasts by product, 2014 - 2025 (USD Million)
- Table 113. Argentina building thermal insulation market volume estimates and forecasts by application, 2014 - 2025 (Kilotons)
- Table 114. Argentina building thermal insulation market revenue estimates and forecasts by application, 2014 - 2025 (Kilotons)
- Table 115. Middle East & Africa building thermal insulation market estimates and forecasts, 2014 - 2025 (Kilotons) (USD Million)
- Table 116. Middle East & Africa building thermal insulation market volume estimates and forecasts, by product (Kilotons)
- Table 117. Middle East & Africa building thermal insulation market revenue estimates and forecasts by product, 2014 - 2025 (USD Million)
- Table 118. Middle East & Africa building thermal insulation market volume estimates and forecasts by application, 2014 - 2025 (Kilotons)
- Table 119. Middle East & Africa building thermal insulation market revenue estimates and forecasts by application, 2014 - 2025 (Kilotons)
- Table 120. Saudi Arabia building thermal insulation market estimates and forecasts, 2014 - 2025 (Kilotons) (USD Million)
- Table 121. Saudi Arabia building thermal insulation market volume estimates and forecasts, by product (Kilotons)
- Table 122. Saudi Arabia building thermal insulation market revenue estimates and forecasts by product, 2014 - 2025 (USD Million)
- Table 123. Saudi Arabia building thermal insulation market volume estimates and forecasts by application, 2014 - 2025 (Kilotons)
- Table 124. Saudi Arabia building thermal insulation market revenue estimates and forecasts by application, 2014 - 2025 (Kilotons)
- Table 125. UAE building thermal insulation market estimates and forecasts, 2014 - 2025 (Kilotons) (USD Million)
- Table 126. UAE building thermal insulation market volume estimates and forecasts, by product (Kilotons)
- Table 127. UAE building thermal insulation market revenue estimates and forecasts by product, 2014 - 2025 (USD Million)
- Table 128. UAE building thermal insulation market volume estimates and forecasts by application, 2014 - 2025 (Kilotons)
- Table 129. UAE building thermal insulation market revenue estimates and forecasts by application, 2014 - 2025 (Kilotons)
- Table 130. Qatar building thermal insulation market estimates and forecasts, 2014 - 2025 (Kilotons) (USD Million)
- Table 131. Qatar building thermal insulation market volume estimates and forecasts, by product (Kilotons)
- Table 132. Qatar building thermal insulation market revenue estimates and forecasts by product, 2014 - 2025 (USD Million)
- Table 133. Qatar building thermal insulation market volume estimates and forecasts by application, 2014 - 2025 (Kilotons)
- Table 134. Qatar building thermal insulation market revenue estimates and forecasts by application, 2014 - 2025 (Kilotons)
- Table 135. South Africa building thermal insulation market estimates and forecasts, 2014 - 2025 (Kilotons) (USD Million)
- Table 136. South Africa building thermal insulation market volume estimates and forecasts, by product (Kilotons)
- Table 137. South Africa building thermal insulation market revenue estimates and forecasts by product, 2014 - 2025 (USD Million)
- Table 138. South Africa building thermal insulation market volume estimates and forecasts by application, 2014 - 2025 (Kilotons)
- Table 139. South Africa building thermal insulation market revenue estimates and forecasts by application, 2014 - 2025 (Kilotons)
List of Figures
- Fig. 1 Building thermal insulation market: Market Snapshot
- Fig. 2 Building thermal insulation market: Market segmentation
- Fig. 3 Building thermal insulation market: Value chain analysis
- Fig. 4 Building thermal Insulation Market: Market Dynamics
- Fig. 5 Market Driver Analysis
- Fig. 6 Market Restraint Analysis
- Fig. 7 Building thermal insulation market: Porter's five forces analysis
- Fig. 8 Building thermal insulation market: PESTEL analysis
- Fig. 9 Building thermal insulation market: Product movement analysis, 2018 & 2025
- Fig. 10 Building thermal insulation market: Application movement analysis, 2018 & 2025
- Fig. 11 Building thermal insulation market: End-use movement analysis, 2018 & 2025
- Fig. 12 Building thermal insulation market: Regional movement analysis, 2018 & 2025
- Fig. 13 Building thermal insulation market: Participant categorization
Building Thermal Insulation Market Growth & Trends:
The global building thermal insulation market size is expected to reach USD 44.69 billion by 2030, expanding at 4.5% CAGR from 2023 to 2030, according to a new report by Grand View Research, Inc. Favorable regulations owing to focus on lowering the overall energy consumption is likely to be a major factor for the rising popularity of building thermal insulation materials. Thermal insulation materials help reduce the heat buildup within the buildings, thus resulting in lower dependence on air conditioning. This contributes to lowering energy costs.
The increasing urban population has led to the limited availability of affordable housing. It has also resulted in crowded roadways and inadequate water & sanitation services. The Middle East & Africa, in particular, is transitioning from places with a severe lack of infrastructure to the development of a robust infrastructure phase, which is expected to fuel demand for thermal insulation in residential, commercial, and industrial buildings.
Mineral wool is one of the most environmentally robust insulation materials. It is a widely used material for thermal insulation in buildings. Mineral wool helps in maintaining energy efficiency and provides fire protection, with good acoustics. Mineral wool is manufactured from volcanic rocks such as dolomite, diabase, and basalt, which are available in abundance.
Wall insulation application dominated the overall demand in 2022 and is expected to continue the trend over the forecast period, on account of the large surface area of the walls in a building, coupled with high product penetration for the application. Institutional buildings such as schools, hospitals, theaters, malls, hotels, etc. are adopting posh architecture and maintaining high energy-efficient standards. Thus, these trends are projected to positively influence the demand for wall insulation products over the forecast period, since it plays a key role in maintaining building energy consumption benchmarks across the globe.
Companies in the market are focusing on expanding their product portfolio by developing cost-effective insulation products with enhanced properties. Manufacturers are also focusing on expanding their manufacturing capabilities to cater to the ascending product demand across the globe. In addition, these companies develop a strong business model to adapt to market volatility and any technological & geographical change.
Building Thermal Insulation Market Report Highlights:
- EPS product segment accounted for 31% of the global building thermal insulation industry share in 2022. EPS exhibits excellent dielectric strength, and resistance to chemicals, heat, and moisture, making it a preferred material for insulation of electric components in building applications. Foamed plastics are expected to witness significant demand for building insulation applications, owing to the energy efficiency regulations imposed by various governments across the globe
- Flooring applications accounted for over 22% of the overall volume in 2022. To meet thermal insulation standards, the ground floor needs to be strong, and multi-layered foundation including flooring, underlayers, insulating layer, and a base. The insulation materials used for flooring applications require high compressive strength along with superior thermal barrier properties. Thus, XPS is one of the most popular materials used for insulation in flooring applications
- Thermal insulation is an essential component used widely in the building & construction industry with applications in residential, commercial, office, institutional, and industrial constructions. The residential construction segment is inclusive of residential buildings, apartments, complexes, and small houses. The growth in the number of single-family houses in developing economies and the rising disposable income of consumers are projected to drive residential construction activities. Thus, the growth of the residential construction sector along with growing building energy consumption norms are projected to positively influence the demand for insulation in above mentioned applications
- Asia Pacific is expected to witness the fastest growth rate, owing to the massive potential of the construction industry in the region, coupled with mandatory green energy building codes imposed by the various governments. The major economies in the region are anticipated to flourish over the forecast period on account of massive investments by various governments for the development of public infrastructure and the expansion of the residential construction sector, which is expected to benefit the product demand in Asia Pacific
Table of Contents
Chapter 1. Methodology and Scope
- 1.1. Market Segmentation & Scope
- 1.2. Assumptions
- 1.3. Information Procurement
- 1.3.1. Purchased Database
- 1.3.2. GVR's Internal Database
- 1.3.3. Secondary Sources & Third-Party Perspectives
- 1.3.4. Primary Research
- 1.4. Information Analysis
- 1.4.1. Data Analysis Models
- 1.5. Market Formulation & Data Visualization
- 1.6. Data Validation & Publishing
Chapter 2. Executive Summary
- 2.1. Market Outlook
- 2.2. Segmental Outlook
- 2.3. Competitive Insights
Chapter 3. Market Variables, Trends, and Scope
- 3.1. Market Lineage Outlook
- 3.2. Industry Value Chain Analysis
- 3.2.1. Raw material trends
- 3.2.2. Manufacturing trends
- 3.2.3. Price Trend Analysis
- 3.3. Market Dynamics
- 3.3.1. Market driver analysis
- 3.3.2. Market restraint analysis
- 3.3.3. Market Opportunity Analysis
- 3.3.4. Industry challenges
- 3.4. Regulatory Framework
- 3.4.1. Product Classification Codes
- 3.4.2. Standards & Compliance
- 3.4.3. Safety
- 3.5. Business Environmental Tools Analysis: Building Thermal Insulation Market
- 3.5.1. Porter's Five Forces Analysis
- 3.5.1.1. Bargaining Power of Suppliers
- 3.5.1.2. Bargaining Power of Buyers
- 3.5.1.3. Threat of Substitution
- 3.5.1.4. Threat of New Entrants
- 3.5.1.5. Competitive Rivalry
- 3.5.2. PESTLE by SWOT
- 3.5.2.1. Political Landscape
- 3.5.2.2. Economic Landscape
- 3.5.2.3. Social Landscape
- 3.5.2.4. Technology Landscape
- 3.5.2.5. Environmental Landscape
- 3.5.2.6. Legal Landscape
- 3.5.3. Major Deals & Strategic Alliances Analysis
- 3.5.3.1. Joint Ventures
- 3.5.3.2. Mergers & Acquisition
- 3.5.3.3. Licensing & Partnership
- 3.5.3.4. Technology Collaboration
- 3.5.3.5. Strategic Divestments
- 3.5.4. Market Entry Strategies
- 3.5.5. Market Disruption Analysis
- 3.5.1. Porter's Five Forces Analysis
Chapter 4. Building Thermal Insulation Market, by Product, 2018 - 2030 (Volume, Kilotons; Revenue, USD Million)
- 4.1. Key Takeaways
- 4.2. Product Market Share Analysis, 2022 & 2030
- 4.3. Glass Wool
- 4.3.1. Market estimates and forecasts, 2018 - 2030 (Kilotons) (USD Million)
- 4.4. Mineral Wool
- 4.4.1. Market estimates and forecasts, 2018 - 2030 (Kilotons) (USD Million)
- 4.5. EPS
- 4.5.1. Market estimates and forecasts, 2018 - 2030 (Kilotons) (USD Million)
- 4.6. XPS
- 4.6.1. Market estimates and forecasts, 2018 - 2030 (Kilotons) (USD Million)
- 4.7. Cellulose
- 4.7.1. Market estimates and forecasts, 2018 - 2030 (Kilotons) (USD Million)
- 4.8. Others
- 4.8.1. Market estimates and forecasts, 2018 - 2030 (Kilotons) (USD Million)
Chapter 5. Building Thermal Insulation Market, by Application, 2018 - 2030 (Volume, Kilotons; Revenue, USD Million)
- 5.1. Key Takeaways
- 5.2. Product Market Share Analysis, 2022 & 2030
- 5.3. Roof
- 5.3.1. Market estimates and forecasts, 2018 - 2030 (Kilotons) (USD Million)
- 5.4. Walls
- 5.4.1. Market estimates and forecasts, 2018 - 2030 (Kilotons) (USD Million)
- 5.5. Floor
- 5.6. Market estimates and forecasts, 2018 - 2030 (Kilotons) (USD Million)
Chapter 6. Building Thermal Insulation Market, by End-Use, 2018 - 2030 (Volume, Kilotons; Revenue, USD Million)
- 6.1. Key Takeaways
- 6.2. Application Market Share Analysis, 2022 & 2030
- 6.3. Residential
- 6.3.1. Market estimates and forecasts, 2018 - 2030 (Kilotons) (USD Million)
- 6.4. Commercial
- 6.4.1. Market estimates and forecasts, 2018 - 2030 (Kilotons) (USD Million)
Chapter 7. Building Thermal Insulation Market, by Region, 2018 - 2030 (Volume, Kilotons; Revenue, USD Million)
- 7.1. Key Takeaways
- 7.2. Regional Market Share Analysis, 2022 & 2030
- 7.3. North America
- 7.3.1. Market estimates and forecasts, 2018 - 2030 (Kilotons) (USD Million)
- 7.3.2. Market estimates and forecasts, by product, 2018 - 2030 (Kilotons) (USD Million)
- 7.3.3. Market estimates and forecasts, by application, 2018 - 2030 (Kilotons) (USD Million)
- 7.3.4. Market estimates and forecasts, by end-use, 2018 - 2030 (Kilotons) (USD Million)
- 7.3.5. U.S.
- 7.3.5.1. Market estimates and forecasts, 2018 - 2030 (Kilotons) (USD Million)
- 7.3.5.2. Market estimates and forecasts, by product, 2018 - 2030 (Kilotons) (USD Million)
- 7.3.5.3. Market estimates and forecasts, by application, 2018 - 2030 (Kilotons) (USD Million)
- 7.3.5.4. Market estimates and forecasts, by end-use, 2018 - 2030 (Kilotons) (USD Million)
- 7.3.6. Canada
- 7.3.6.1. Market estimates and forecasts, 2018 - 2030 (Kilotons) (USD Million)
- 7.3.6.2. Market estimates and forecasts, by product, 2018 - 2030 (Kilotons) (USD Million)
- 7.3.6.3. Market estimates and forecasts, by application, 2018 - 2030 (Kilotons) (USD Million)
- 7.3.6.4. Market estimates and forecasts, by end-use, 2018 - 2030 (Kilotons) (USD Million)
- 7.3.7. Mexico
- 7.3.7.1. Market estimates and forecasts, 2018 - 2030 (Kilotons) (USD Million)
- 7.3.7.2. Market estimates and forecasts, by product, 2018 - 2030 (Kilotons) (USD Million)
- 7.3.7.3. Market estimates and forecasts, by application, 2018 - 2030 (Kilotons) (USD Million)
- 7.3.7.4. Market estimates and forecasts, by end-use, 2018 - 2030 (Kilotons) (USD Million)
- 7.4. Europe
- 7.4.1. Market estimates and forecasts, 2018 - 2030 (Kilotons) (USD Million)
- 7.4.2. Market estimates and forecasts, by product, 2018 - 2030 (Kilotons) (USD Million)
- 7.4.3. Market estimates and forecasts, by application, 2018 - 2030 (Kilotons) (USD Million)
- 7.4.4. Market estimates and forecasts, by end-use, 2018 - 2030 (Kilotons) (USD Million)
- 7.4.5. Germany
- 7.4.5.1. Market estimates and forecasts, 2018 - 2030 (Kilotons) (USD Million)
- 7.4.5.2. Market estimates and forecasts, by product, 2018 - 2030 (Kilotons) (USD Million)
- 7.4.5.3. Market estimates and forecasts, by application, 2018 - 2030 (Kilotons) (USD Million)
- 7.4.5.4. Market estimates and forecasts, by end-use, 2018 - 2030 (Kilotons) (USD Million)
- 7.4.6. U.K.
- 7.4.6.1. Market estimates and forecasts, 2018 - 2030 (Kilotons) (USD Million)
- 7.4.6.2. Market estimates and forecasts, by product, 2018 - 2030 (Kilotons) (USD Million)
- 7.4.6.3. Market estimates and forecasts, by application, 2018 - 2030 (Kilotons) (USD Million)
- 7.4.6.4. Market estimates and forecasts, by end-use, 2018 - 2030 (Kilotons) (USD Million)
- 7.4.7. France
- 7.4.7.1. Market estimates and forecasts, 2018 - 2030 (Kilotons) (USD Million)
- 7.4.7.2. Market estimates and forecasts, by product, 2018 - 2030 (Kilotons) (USD Million)
- 7.4.7.3. Market estimates and forecasts, by application, 2018 - 2030 (Kilotons) (USD Million)
- 7.4.7.4. Market estimates and forecasts, by end-use, 2018 - 2030 (Kilotons) (USD Million)
- 7.4.8. Italy
- 7.4.8.1. Market estimates and forecasts, 2018 - 2030 (Kilotons) (USD Million)
- 7.4.8.2. Market estimates and forecasts, by product, 2018 - 2030 (Kilotons) (USD Million)
- 7.4.8.3. Market estimates and forecasts, by application, 2018 - 2030 (Kilotons) (USD Million)
- 7.4.8.4. Market estimates and forecasts, by end-use, 2018 - 2030 (Kilotons) (USD Million)
- 7.4.9. Spain
- 7.4.9.1. Market estimates and forecasts, 2018 - 2030 (Kilotons) (USD Million)
- 7.4.9.2. Market estimates and forecasts, by product, 2018 - 2030 (Kilotons) (USD Million)
- 7.4.9.3. Market estimates and forecasts, by application, 2018 - 2030 (Kilotons) (USD Million)
- 7.4.9.4. Market estimates and forecasts, by end-use, 2018 - 2030 (Kilotons) (USD Million)
- 7.5. Asia Pacific
- 7.5.1. Market estimates and forecasts, 2018 - 2030 (Kilotons) (USD Million)
- 7.5.2. Market estimates and forecasts, by product, 2018 - 2030 (Kilotons) (USD Million)
- 7.5.3. Market estimates and forecasts, by application, 2018 - 2030 (Kilotons) (USD Million)
- 7.5.4. Market estimates and forecasts, by end-use, 2018 - 2030 (Kilotons) (USD Million)
- 7.5.5. India
- 7.5.5.1. Market estimates and forecasts, 2018 - 2030 (Kilotons) (USD Million)
- 7.5.5.2. Market estimates and forecasts, by product, 2018 - 2030 (Kilotons) (USD Million)
- 7.5.5.3. Market estimates and forecasts, by application, 2018 - 2030 (Kilotons) (USD Million)
- 7.5.5.4. Market estimates and forecasts, by end-use, 2018 - 2030 (Kilotons) (USD Million)
- 7.5.6. China
- 7.5.6.1. Market estimates and forecasts, 2018 - 2030 (Kilotons) (USD Million)
- 7.5.6.2. Market estimates and forecasts, by product, 2018 - 2030 (Kilotons) (USD Million)
- 7.5.6.3. Market estimates and forecasts, by application, 2018 - 2030 (Kilotons) (USD Million)
- 7.5.6.4. Market estimates and forecasts, by end-use, 2018 - 2030 (Kilotons) (USD Million)
- 7.5.7. Japan
- 7.5.7.1. Market estimates and forecasts, 2018 - 2030 (Kilotons) (USD Million)
- 7.5.7.2. Market estimates and forecasts, by product, 2018 - 2030 (Kilotons) (USD Million)
- 7.5.7.3. Market estimates and forecasts, by application, 2018 - 2030 (Kilotons) (USD Million)
- 7.5.7.4. Market estimates and forecasts, by end-use, 2018 - 2030 (Kilotons) (USD Million)
- 7.5.8. South Korea
- 7.5.8.1. Market estimates and forecasts, 2018 - 2030 (Kilotons) (USD Million)
- 7.5.8.2. Market estimates and forecasts, by product, 2018 - 2030 (Kilotons) (USD Million)
- 7.5.8.3. Market estimates and forecasts, by application, 2018 - 2030 (Kilotons) (USD Million)
- 7.5.8.4. Market estimates and forecasts, by end-use, 2018 - 2030 (Kilotons) (USD Million)
- 7.5.9. Indonesia
- 7.5.9.1. Market estimates and forecasts, 2018 - 2030 (Kilotons) (USD Million)
- 7.5.9.2. Market estimates and forecasts, by product, 2018 - 2030 (Kilotons) (USD Million)
- 7.5.9.3. Market estimates and forecasts, by application, 2018 - 2030 (Kilotons) (USD Million)
- 7.5.9.4. Market estimates and forecasts, by end-use, 2018 - 2030 (Kilotons) (USD Million)
- 7.5.10. Malaysia
- 7.5.10.1. Market estimates and forecasts, 2018 - 2030 (Kilotons) (USD Million)
- 7.5.10.2. Market estimates and forecasts, by product, 2018 - 2030 (Kilotons) (USD Million)
- 7.5.10.3. Market estimates and forecasts, by application, 2018 - 2030 (Kilotons) (USD Million)
- 7.5.10.4. Market estimates and forecasts, by end-use, 2018 - 2030 (Kilotons) (USD Million)
- 7.6. Central & South America
- 7.6.1. Market estimates and forecasts, 2018 - 2030 (Kilotons) (USD Million)
- 7.6.2. Market estimates and forecasts, by product, 2018 - 2030 (Kilotons) (USD Million)
- 7.6.3. Market estimates and forecasts, by application, 2018 - 2030 (Kilotons) (USD Million)
- 7.6.4. Market estimates and forecasts, by end-use, 2018 - 2030 (Kilotons) (USD Million)
- 7.6.5. Brazil
- 7.6.5.1. Market estimates and forecasts, 2018 - 2030 (Kilotons) (USD Million)
- 7.6.5.2. Market estimates and forecasts, by product, 2018 - 2030 (Kilotons) (USD Million)
- 7.6.5.3. Market estimates and forecasts, by application, 2018 - 2030 (Kilotons) (USD Million)
- 7.6.5.4. Market estimates and forecasts, by end-use, 2018 - 2030 (Kilotons) (USD Million)
- 7.6.6. Argentina
- 7.6.6.1. Market estimates and forecasts, 2018 - 2030 (Kilotons) (USD Million)
- 7.6.6.2. Market estimates and forecasts, by product, 2018 - 2030 (Kilotons) (USD Million)
- 7.6.6.3. Market estimates and forecasts, by application, 2018 - 2030 (Kilotons) (USD Million)
- 7.6.6.4. Market estimates and forecasts, by end-use, 2018 - 2030 (Kilotons) (USD Million)
- 7.7. Middle East & Africa
- 7.7.1. Market estimates and forecasts, 2018 - 2030 (Kilotons) (USD Million)
- 7.7.2. Market estimates and forecasts, by product, 2018 - 2030 (Kilotons) (USD Million)
- 7.7.3. Market estimates and forecasts, by application, 2018 - 2030 (Kilotons) (USD Million)
- 7.7.4. Market estimates and forecasts, by end-use, 2018 - 2030 (Kilotons) (USD Million)
- 7.7.5. Saudi Arabia
- 7.7.5.1. Market estimates and forecasts, 2018 - 2030 (Kilotons) (USD Million)
- 7.7.5.2. Market estimates and forecasts, by product, 2018 - 2030 (Kilotons) (USD Million)
- 7.7.5.3. Market estimates and forecasts, by application, 2018 - 2030 (Kilotons) (USD Million)
- 7.7.5.4. Market estimates and forecasts, by end-use, 2018 - 2030 (Kilotons) (USD Million)
- 7.7.6. UAE
- 7.7.6.1. Market estimates and forecasts, 2018 - 2030 (Kilotons) (USD Million)
- 7.7.6.2. Market estimates and forecasts, by product, 2018 - 2030 (Kilotons) (USD Million)
- 7.7.6.3. Market estimates and forecasts, by application, 2018 - 2030 (Kilotons) (USD Million)
- 7.7.6.4. Market estimates and forecasts, by end-use, 2018 - 2030 (Kilotons) (USD Million)
- 7.7.7. Qatar
- 7.7.7.1. Market estimates and forecasts, 2018 - 2030 (Kilotons) (USD Million)
- 7.7.7.2. Market estimates and forecasts, by product, 2018 - 2030 (Kilotons) (USD Million)
- 7.7.7.3. Market estimates and forecasts, by application, 2018 - 2030 (Kilotons) (USD Million)
- 7.7.7.4. Market estimates and forecasts, by end-use, 2018 - 2030 (Kilotons) (USD Million)
- 7.7.8. South Africa
- 7.7.8.1. Market estimates and forecasts, 2018 - 2030 (Kilotons) (USD Million)
- 7.7.8.2. Market estimates and forecasts, by product, 2018 - 2030 (Kilotons) (USD Million)
- 7.7.8.3. Market estimates and forecasts, by application, 2018 - 2030 (Kilotons) (USD Million)
- 7.7.8.4. Market estimates and forecasts, by end-use, 2018 - 2030 (Kilotons) (USD Million)
Chapter 8. Building Thermal Insulation Market Supplier Intelligence
- 8.1. Kraljic Matrix (Portfolio Analysis)
- 8.2. Engagement Model
- 8.3. Negotiation Strategies
- 8.4. Sourcing Best Practices
- 8.5. Vendor Selection Criteria
- 8.6. List of Raw Material Suppliers
- 8.7. List of Equipment Suppliers
- 8.8. List of End-user
Chapter 9. Competitive Landscape
- 9.1. Key Global Players, Their Recent Developments, and Their Impact on the Industry
- 9.2. Participant Categorization
- 9.3. Public Companies
- 9.3.1. Company market position analysis
- 9.3.2. Competitive Dashboard Analysis
- 9.3.2.1. Market Differentiators
- 9.3.2.2. Synergy Analysis: Major Deals & Strategic Alliances
- 9.3.3. Private Companies
- 9.3.4. List of emerging players
Chapter 10. Company Profiles
- 10.1. Rockwool International A/S
- 10.1.1. Company overview
- 10.1.2. Financial performance
- 10.1.3. Product benchmarking
- 10.1.4. Strategic initiatives
- 10.2. GAF Materials Corporation
- 10.2.1. Company overview
- 10.2.2. Financial performance
- 10.2.3. Product benchmarking
- 10.2.4. Strategic initiatives
- 10.3. Guardian Building Products, Inc.
- 10.3.1. Company overview
- 10.3.2. Financial performance
- 10.3.3. Product benchmarking
- 10.3.4. Strategic initiatives
- 10.4. Huntsman International LLC
- 10.4.1. Company overview
- 10.4.2. Financial performance
- 10.4.3. Product benchmarking
- 10.4.4. Strategic initiatives
- 10.5. Johns Manville Corporation
- 10.5.1. Company overview
- 10.5.2. Financial performance
- 10.5.3. Product benchmarking
- 10.5.4. Strategic initiatives
- 10.6. Cellofoam North America, Inc.
- 10.6.1. Company overview
- 10.6.2. Financial performance
- 10.6.3. Product benchmarking
- 10.6.4. Strategic initiatives
- 10.7. Atlas Roofing Corporation
- 10.7.1. Company overview
- 10.7.2. Financial performance
- 10.7.3. Product benchmarking
- 10.7.4. Strategic initiatives
- 10.8. CertainTeed Corporation
- 10.8.1. Company overview
- 10.8.2. Financial performance
- 10.8.3. Product benchmarking
- 10.8.4. Strategic initiatives
- 10.9. Roxul, Inc.
- 10.9.1. Company overview
- 10.9.2. Financial performance
- 10.9.3. Product benchmarking
- 10.9.4. Strategic initiatives
- 10.10. Dow Building Solutions
- 10.10.1. Company overview
- 10.10.2. Financial performance
- 10.10.3. Product benchmarking
- 10.10.4. Strategic initiatives
- 10.11. Owens Corning Corporation
- 10.11.1. Company overview
- 10.11.2. Financial performance
- 10.11.3. Product benchmarking
- 10.11.4. Strategic initiatives
- 10.12. Saint-Gobain S.A.
- 10.12.1. Company overview
- 10.12.2. Financial performance
- 10.12.3. Product benchmarking
- 10.12.4. Strategic initiatives
- 10.13. Byucksan Corporation
- 10.13.1. Company overview
- 10.13.2. Financial performance
- 10.13.3. Product benchmarking
- 10.13.4. Strategic initiatives
- 10.14. Kingspan Group PLC
- 10.14.1. Company overview
- 10.14.2. Financial performance
- 10.14.3. Product benchmarking
- 10.14.4. Strategic initiatives
- 10.15. BASF Polyurethanes GmbH
- 10.15.1. Company overview
- 10.15.2. Financial performance
- 10.15.3. Product benchmarking
- 10.15.4. Strategic initiatives