|
|
市場調査レポート
商品コード
1233057
北米の家庭用浄水器市場規模・シェア・動向分析レポート製品別(ROベース、UVベース)、流通チャネル別(オンライン、オフライン)、セグメント別予測、2023年~2030年North America Home Water Filtration Unit Market Size, Share & Trends Analysis Report By Product (RO Based, UV Based), By Distribution Channel (Online, Offline), And Segment Forecasts, 2023 - 2030 |
||||||
|
|
|||||||
|
● お客様のご希望に応じて、既存データの加工や未掲載情報(例:国別セグメント)の追加などの対応が可能です。 詳細はお問い合わせください。 |
|||||||


| 北米の家庭用浄水器市場規模・シェア・動向分析レポート製品別(ROベース、UVベース)、流通チャネル別(オンライン、オフライン)、セグメント別予測、2023年~2030年 |
|
出版日: 2023年02月20日
発行: Grand View Research
ページ情報: 英文 80 Pages
納期: 2~10営業日
|
- 全表示
- 概要
- 図表
- 目次
北米の家庭用浄水器の市場成長・動向
Grand View Research, Inc.の最新レポートによると、北米の家庭用浄水器市場規模は、2023年から2030年にかけて7.4%のCAGRで成長し、2030年には37億1000万米ドルに達すると予測されています。
近年、家庭用浄水器市場全体は、特に都市部でのライフスタイルの変化により、絶大な支持を集めています。また、常にろ過された水を利用できることが、家庭用浄水器の採用を後押ししています。飲料水の不足により、国内当局は国民に十分な供給を行うことが義務付けられています。
米国やカナダなどの先進諸国における浄水ソリューションの普及率は比較的高いです。特に首都圏や都市部では、地表水源の微生物や化学物質による汚染が驚くほど高いため、家庭用浄水器が必要だと考えられています。汚染された水を摂取することによる悪影響に対する消費者の意識の高まりと、飲料水の減少により、煮沸、塩素やヨウ素の添加といった従来の浄水方法から、技術ベースのシステムへと消費者の嗜好が大きく変化しています。
パンデミックは、2020年の第1四半期から、世界中でロックダウンを促しました。2020年及び2021年、パンデミックは、製造事業、サプライチェーン及び流通チャネルに悪影響を及ぼす、著しい事業の混乱と経済の不確実性をもたらしました。COVID-19パンデミックの直接的な影響は評価されていますが、サプライチェーンの混乱やそれに伴う世界の事業活動への影響など、長期的な規模や期間は依然として不明です。米国内の深刻な被害を受けた都市では、厳格な施錠や社会的距離の維持が必要とされ、いくつかの実店舗が大きな損失を被りました。
2022年の市場シェアは、ROベース製品分野が65.2%以上のトップシェアを占めており、近い将来大きな成長が見込まれます。RO浄水システムは、その性能効果、低い電力消費量、高度な技術的特徴により、広く使用されています。低予算の住宅用浄水器の普及が進み、今後数年間は世界の需要を喚起するものと思われます。
オフラインセグメントが市場を独占し、2022年には67.1%を超える収益シェアを占めています。米国では、消費者がオフラインの店舗で浄水器を購入する傾向が強いです。数多くの浄化技術やデザインが、水の団体や水処理の見本市が行う会議、展示会、イベントなどで展示されています。
2022年の収益シェアは、米国が65.2%以上で最大となっています。北米では、家庭用浄水器の主要市場は米国、カナダ、メキシコです。硬水は、ミネラルの存在によりスケーリングが発生します。これはパイプラインの内面に積み重なり、それによって器具の配管やパイプを詰まらせる。そのため、消費者は硬水の貯水やろ過に伴う電気代を削減するため、浄水器への投資を増やしている
製品需要の高まりや動向に対応するため、製造企業は製品のイノベーションに注力しています。M&Aなどの主な発展は、新興経済諸国での足場固めに役立っています。
北米の家庭用浄水器市場レポートハイライト:
- ROベースの製品セグメントは、2022年に65.2%以上の主要な市場シェアを占め、近い将来大きな成長が期待されます。低予算の住宅用浄水器の普及が進み、今後数年間は世界の需要を喚起すると考えられます。
- オフライン部門が市場を独占し、2022年には67.1%以上の収益シェアを占めています。米国では、消費者がオフラインの店舗で浄水器を購入する傾向が強いです。数多くの浄化技術やデザインが、水の団体や水処理の見本市が行う会議、展示会、イベントなどで展示されています。
- 2022年の売上シェアは米国が65.2%以上で最大。硬水は、ミネラルの存在によりスケーリングが発生します。これがパイプラインの内面に積み重なり、それ別器具の配管やパイプが詰まる。
目次
第1章 調査手法と範囲
- 市場セグメンテーションと範囲
- 市場の定義
- 情報調達
- 購入したデータベース
- GVRの内部データベース
- 二次情報と第三者の視点
- 一次調査
- 情報分析
- データ分析モデル
- 市場形成とデータ可視化
- データの検証と公開
第2章 エグゼクティブサマリー
- 市場のスナップショット
- セグメントのスナップショット
- 競合情勢のスナップショット
第3章 北米の家庭用浄水器市場の変数、動向、範囲
- 市場イントロダクション
- 浸透と成長の見通しのマッピング
- 業界バリューチェーン分析
- 販売/小売チェーン分析
- 利益率分析
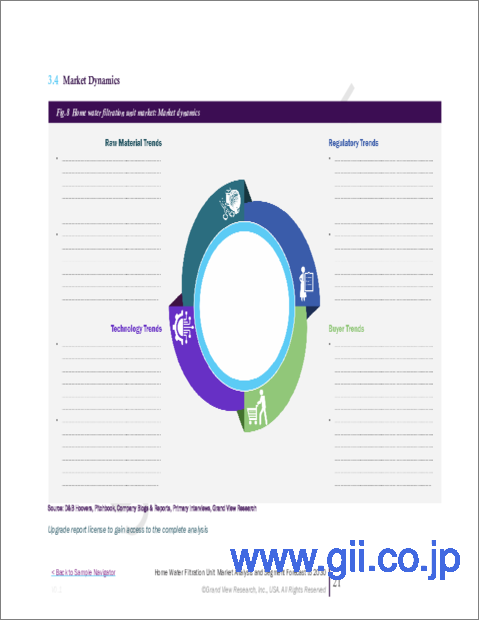
- 市場力学
- 市場促進要因分析
- 精製された飲料水の需要の高まり
- 汚染水の増加
- 家庭用浄水器のメリット
- 市場抑制要因分析
- ボトルウォーター市場の確立
- 業界の課題
- 業界の機会
- 市場促進要因分析
- 事業環境分析
- 業界分析- ポーターの5つの力
- 北米家庭用浄水器市場ユニットのロードマップ
- 市場参入戦略
- COVID-19が北米の家庭用浄水器市場に与える影響
第4章 消費者行動分析
- 消費者の動向と好み
- 購入決定に影響を与える要因
- 消費者製品の採用
- 所見と推奨事項
第5章 北米の家庭用浄水器市場:製品の推定・動向分析
- 製品変動分析と市場シェア、2022年と2030年
- ROベース
- UVベース
第6章 北米の家庭用浄水器市場:流通チャネルの推定とトレンド分析
- 流通チャネルの変動分析と市場シェア、2022年と2030年
- オンライン
- オフライン
第7章 北米の家庭用浄水器市場:国の推定・動向分析
- 国の変動分析と市場シェア、2022年と2030年
- 北米
- 米国
- カナダ
- メキシコ
第8章 競合分析
- 主要な市場参入企業別最近の動向と影響分析
- 主要な会社分類
- ベンダー情勢
- 主要企業の市場シェア分析、2022年
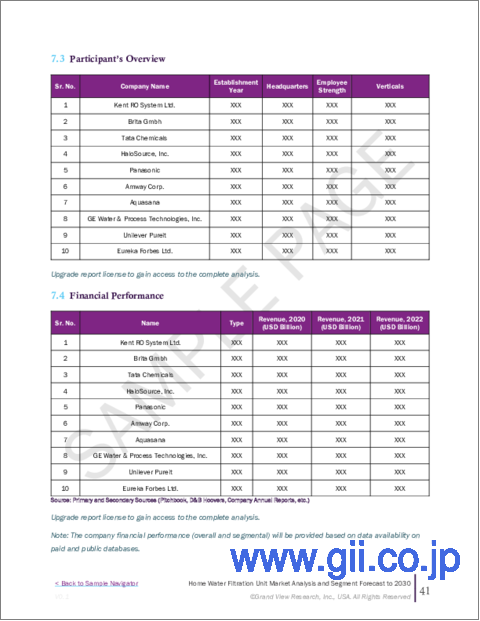
第9章 企業プロファイル
- Trojan Technologies Group ULC
- 会社概要
- 財務実績
- 製品のベンチマーク
- 戦略的イニシアチブ
- Culligan Water
- 会社概要
- 財務実績
- 製品のベンチマーク
- 戦略的イニシアチブ
- Whirlpool Corporation.
- 会社概要
- 財務実績
- 製品のベンチマーク
- 戦略的イニシアチブ
- Brita GmbH.
- 会社概要
- 財務実績
- 製品のベンチマーク
- 戦略的イニシアチブ
- Amway Corporation.
- 会社概要
- 財務実績
- 製品のベンチマーク
- 戦略的イニシアチブ
- Eureka Forbes Ltd.
- 会社概要
- 財務実績
- 製品のベンチマーク
- 戦略的イニシアチブ
- KENT RO SYSTEMS LTD
- 会社概要
- 財務実績
- 製品のベンチマーク
- 戦略的イニシアチブ
- General Electric(GE)
- 会社概要
- 財務実績
- 製品のベンチマーク
- 戦略的イニシアチブ
- LUMINOR Environmental Inc.
- 会社概要
- 財務実績
- 製品のベンチマーク
- 戦略的イニシアチブ
- Hindustan Unilever Limited
- 会社概要
- 財務実績
- 製品のベンチマーク
- 戦略的イニシアチブ
- LG Electronics.
- 会社概要
- 財務実績
- 製品のベンチマーク
- 戦略的イニシアチブ
- Aqua Sana, Inc.(AO Smith Corporation)
- 会社概要
- 財務実績
- 製品のベンチマーク
- 戦略的イニシアチブ
- Panasonic Holdings Corporation
- 会社概要
- 財務実績
- 製品のベンチマーク
- 戦略的イニシアチブ
- Koninklijke Philips NV
- 会社概要
- 財務実績
- 製品のベンチマーク
- 戦略的イニシアチブ
List of Tables
- Table 1 Global home water filtration unit market estimates and forecast, 2017 - 2030 (USD Million)
- Table 2 Global home water filtration unit market estimates and forecast, 2017 - 2030 (Thousand Units)
- Table 3 Europe home water filtration unit market estimates and forecast, 2017 - 2030 (USD Million)
- Table 4 Europe home water filtration unit market estimates and forecast, 2017 - 2030 (Thousand Units)
- Table 5 Germany home water filtration unit market estimates and forecast, 2017 - 2030 (USD Million)
- Table 6 Germany home water filtration unit market estimates and forecast, 2017 - 2030 (Thousand Units)
- Table 7 U.K. home water filtration unit market estimates and forecast, 2017 - 2030 (USD Million)
- Table 8 U.K. home water filtration unit market estimates and forecast, 2017 - 2030 (Thousand Units)
- Table 9 Asia Pacific home water filtration unit market estimates and forecast, 2017 - 2030 (USD Million)
- Table 10 Asia Pacific home water filtration unit market estimates and forecast, 2017 - 2030 (Thousand Units)
- Table 11 China home water filtration unit market estimates and forecast, 2017 - 2030 (USD Million)
- Table 12 China home water filtration unit market estimates and forecast, 2017 - 2030 (Thousand Units)
- Table 13 India home water filtration unit market estimates and forecast, 2017 - 2030 (USD Million)
- Table 14 India home water filtration unit market estimates and forecast, 2017 - 2030 (Thousand Units)
- Table 15 Central & South America home water filtration unit market estimates and forecast, 2017 - 2030 (USD Million)
- Table 16 Central & South America home water filtration unit market estimates and forecast, 2017 - 2030 (Thousand Units)
- Table 17 Argentina home water filtration unit market estimates and forecast, 2017 - 2030 (USD Million)
- Table 18 Argentina home water filtration unit market estimates and forecast, 2017 - 2030 (Thousand Units)
- Table 19 Middle East & Africa home water filtration unit market estimates and forecast, 2017 - 2030 (USD Million)
- Table 20 Middle East & Africa home water filtration unit market estimates and forecast, 2017 - 2030 (Thousand Units)
- Table 21 Israel home water filtration unit market estimates and forecast, 2017 - 2030 (USD Million)
- Table 22 Israel home water filtration unit market estimates and forecast, 2017 - 2030 (Thousand Units)
- Table 23 North America home water filtration unit market - Driving factor market analysis
- Table 24 North America home water filtration unit market - Restraint factor market analysis
- Table 25 North America RO - based home water filtration unit market estimates and forecast, 2017 - 2030 (USD Million)
- Table 26 North America RO - based home water filtration unit market estimates and forecast, 2017 - 2030 (Thousand Units)
- Table 27 North America UV - based home water filtration unit market estimates and forecast, 2017 - 2030 (USD Million)
- Table 28 North America UV - based home water filtration unit market estimates and forecast, 2017 - 2030 (Thousand Units)
- Table 29 North America home water filtration unit market estimates and forecast, through online channels, 2017 - 2030 (USD Million)
- Table 30 North America home water filtration unit market estimates and forecast, through online channels, 2017 - 2030 (Thousand Units)
- Table 31 North America home water filtration unit market estimates and forecast, through offline channels, 2017 - 2030 (USD Million)
- Table 32 North America home water filtration unit market estimates and forecast, through offline channels, 2017 - 2030 (Thousand Units)
- Table 33 North America home water filtration unit market estimates and forecast, 2017 - 2030 (USD Million)
- Table 34 North America home water filtration unit market estimates and forecast, 2017 - 2030 (Thousand Units)
- Table 35 North America home water filtration unit market estimates and forecast, by product, 2017 - 2030 (USD Million)
- Table 36 North America home water filtration unit market estimates and forecast, by product, 2017 - 2030 (Thousand Units)
- Table 37 North America home water filtration unit market estimates and forecast, by distribution channel, 2017 - 2030 (USD Million)
- Table 38 North America home water filtration unit market estimates and forecast, by distribution channel, 2017 - 2030 (Thousand Units)
- Table 39 U.S. home water filtration unit market estimates and forecast, 2017 - 2030 (USD Million)
- Table 40 U.S. home water filtration unit market estimates and forecast, 2017 - 2030 (Thousand Units)
- Table 41 U.S. home water filtration unit market estimates and forecast, by product, 2017 - 2030 (USD Million)
- Table 42 U.S. home water filtration unit market estimates and forecast, by product, 2017 - 2030 (Thousand Units)
- Table 43 U.S. home water filtration unit market estimates and forecast, by distribution channel, 2017 - 2030 (USD Million)
- Table 44 U.S. home water filtration unit market estimates and forecast, by distribution channel, 2017 - 2030 (Thousand Units)
- Table 45 Canada home water filtration unit market estimates and forecast, 2017 - 2030 (USD Million)
- Table 46 Canada home water filtration unit market estimates and forecast, 2017 - 2030 (Thousand Units)
- Table 47 Canada home water filtration unit market estimates and forecast, by product, 2017 - 2030 (USD Million)
- Table 48 Canada home water filtration unit market estimates and forecast, by product, 2017 - 2030 (Thousand Units)
- Table 49 Canada home water filtration unit market estimates and forecast, by distribution channel, 2017 - 2030 (USD Million)
- Table 50 Canada home water filtration unit market estimates and forecast, by distribution channel, 2017 - 2030 (Thousand Units)
- Table 51 Mexico home water filtration unit market estimates and forecast, 2017 - 2030 (USD Million)
- Table 52 Mexico home water filtration unit market estimates and forecast, 2017 - 2030 (Thousand Units)
- Table 53 Mexico home water filtration unit market estimates and forecast, by product, 2017 - 2030 (USD Million)
- Table 54 Mexico home water filtration unit market estimates and forecast, by product, 2017 - 2030 (Thousand Units)
- Table 55 Mexico home water filtration unit market estimates and forecast, by distribution channel, 2017 - 2030 (USD Million)
- Table 56 Mexico home water filtration unit market estimates and forecast, by distribution channel, 2017 - 2030 (Thousand Units)
- Table 57 Company categorization
List of Figures
- Fig. 1 North America home water filtration unit market segmentation
- Fig. 2 Information procurement
- Fig. 3 Primary research pattern
- Fig. 4 Primary research approaches
- Fig. 5 Primary research process
- Fig. 6 Global Market Snapshot
- Fig. 7 North America Market Snapshot
- Fig. 8 North America Segment Snapshot
- Fig. 9 North America Segment Snapshot
- Fig. 10 Competitive Landscape Snapshot
- Fig. 11 North America home water filtration unit market size, 2017 - 2030
- Fig. 12 North America home water filtration unit market- Penetration & growth prospect mapping, by product
- Fig. 13 North America home water filtration unit market - Value chain analysis
- Fig. 14 North America home water filtration unit market sales/retail channel analysis
- Fig. 15 North America home water filtration unit market - Profit margin analysis
- Fig. 16 Annual increase in water demand (municipal and domestic) from 2005 - 2030 (billion m3), by geography
- Fig. 17 North America home water filtration unit market: Porter's Five Forces analysis
- Fig. 18 Roadmap of the North America home water filtration unit market
- Fig. 19 Conventional vs. Under-the-Sink filters
- Fig. 20 North America home water filtration unit market: Product share (%) analysis, 2022 & 2030
- Fig. 21 North America home water filtration units market: Distribution channel share (%) analysis, 2022 & 2030
- Fig. 22 North America home water filtration unit market: Country share (%) analysis, 2022 & 2030
- Fig. 23 Global home water filtration unit market: Company revenue share analysis, 2022 (%)
North America Home Water Filtration Unit Market Growth & Trends:
The North America home water filtration unit market size is expected to reach USD 3.71 billion in 2030, registering a CAGR of 7.4% from 2023 to 2030, according to a new report by Grand View Research, Inc. In recent years, the overall home water filtration market has gained immense traction as a result of changing lifestyles, especially in urban areas. In addition, the availability of filtered water all the time encourages the adoption of home water filtration units. The scarcity of drinking water has obligated the domestic authorities to provide the population with an adequate supply.
The penetration of water purification solutions in developed countries such as the U.S. and Canada is relatively high. Home water filtration is seen as a necessity, especially in metros and urban cities, due to the alarmingly high microbial and chemical contamination of surface water sources. Growing awareness among consumers about the ill effects of consuming contaminated water, along with the declining levels of potable water, has resulted in a significant shift in consumer preferences from conventional water purification methods such as boiling, addition of chlorines or iodine to technology-based systems.
The pandemic prompted lockdowns around the world, starting from the first quarter of 2020. In 2020 and 2021, the pandemic created significant business disruption and economic uncertainty, which adversely impacted manufacturing operations, supply chains, and distribution channels. While the immediate impacts of the COVID-19 pandemic have been assessed, the long-term magnitude and duration of the disruption, including supply chain disruption and resulting impact on global business activity remain uncertain. Several brick-and-mortar stores suffered significant losses as a result of strict lockdowns and the need to maintain social distance in severely affected cities across the U.S.
The RO-based product segment accounted for the leading market share of more than 65.2% in 2022 and is expected to witness significant growth in the near future. RO water purification systems are widely used owing to their performance effectiveness, low electricity consumption, and advanced technological features. Increasing penetration of low-budget residential water purifiers is likely to stimulate global demand during the coming years.
The offline segment dominated the market and held a revenue share of above 67.1% in 2022. Consumers are more likely to purchase water purifiers from offline stores in the US. Numerous purifying technologies and designs are displayed in conferences, exhibitions, and events conducted by the water organization and water treatment trade shows.
The U.S. accounted for the largest revenue share of more than 65.2% in 2022. In North America, the primary markets for home water filtration are U.S, Canada, and Mexico. Hard water results in scaling due to the presence of minerals. This piles up on the inner surfaces of the pipeline, thereby clogging the plumbing and pipes in the appliance. Consumers are therefore increasingly investing in water filtration units to reduce electrical costs associated with hard water storage and filtration
To meet the rising product demand and set trends manufacturing companies focus on product innovations. Strategic initiatives such as mergers and acquisitions help key players to gain a foothold in developing economies.
North America Home Water Filtration Unit Market Report Highlights:
- The RO-based product segment accounted for the leading market share of more than 65.2% in 2022 and is expected to witness significant growth in the near future. Increasing penetration of low-budget residential water purifiers is likely to stimulate global demand during the coming years
- The offline segment dominated the market and held a revenue share of more than 67.1% in 2022. Consumers are more likely to purchase water purifiers from offline stores in the US. Numerous purifying technologies and designs are displayed in conferences, exhibitions, and events conducted by the water organization and water treatment trade shows
- The U.S accounted for the largest revenue share of more than 65.2% in 2022. Hard water results in scaling due to the presence of minerals. This piles up on the inner surfaces of the pipeline, thereby clogging the plumbing and pipes in the appliance
Table of Contents
Chapter 1. Methodology and Scope
- 1.1. Market Segmentation & Scope
- 1.2. Market Definition
- 1.3. Information Procurement
- 1.3.1. Purchased Database
- 1.3.2. GVR's Internal Database
- 1.3.3. Secondary Sources & Third - Party Perspectives
- 1.3.4. Primary Research
- 1.4. Information Analysis
- 1.4.1. Data Analysis Models
- 1.5. Market Formulation & Data Visualization
- 1.6. Data Validation & Publishing
Chapter 2. Executive Summary
- 2.1. Market Snapshot
- 2.2. Segment Snapshot
- 2.3. Competitive Landscape Snapshot
Chapter 3. North America Home Water Filtration Unit Market Variables, Trends & Scope
- 3.1. Market Introduction
- 3.2. Penetration & Growth Prospect Mapping
- 3.3. Industry Value Chain Analysis
- 3.3.1. Sales/Retail Chain Analysis
- 3.3.2. Profit Margin Analysis
- 3.4. Market Dynamics
- 3.4.1. Market Driver Analysis
- 3.4.1.1 Growing demand for purified drinking water
- 3.4.1.2 Increasing instances of contaminated water
- 3.4.1.3 Benefits offered by home water filtration units
- 3.4.2. Market Restraint Analysis
- 3.4.2.1 Established bottled water market
- 3.4.3. Industry Challenges
- 3.4.4. Industry Opportunities
- 3.4.1. Market Driver Analysis
- 3.5. Business Environment Analysis
- 3.5.1. Industry Analysis - Porter's Five Forces
- 3.6. Roadmap of the North America Home Water Filtration Market Unit
- 3.7. Market Entry Strategies
- 3.8. Impact of COVID-19 on the North America Home Water Filtration Unit Market
Chapter 4. Consumer Behavior Analysis
- 4.1. Consumer Trends and Preferences
- 4.2. Factors Affecting Buying Decision
- 4.3. Consumer Product Adoption
- 4.4. Observations & Recommendations
Chapter 5. North America Home Water Filtration Unit Market: Product Estimates & Trend Analysis
- 5.1. Product Movement Analysis & Market Share, 2022 & 2030
- 5.2. RO Based
- 5.2.1 North America RO - Based home water filtration unit market estimates and forecast, 2017 - 2030 (USD Million, Thousand units)
- 5.3. UV Based
- 5.3.1 North America UV - Based home water filtration unit market estimates and forecast, 2017 - 2030 (USD Million, Thousand units)
Chapter 6. North America Home Water Filtration Market: Distribution Channel Estimates& Trend Analysis
- 6.1. Distribution Channel Movement Analysis & Market Share, 2022 & 2030
- 6.2. Online
- 6.2.1. North America home water filtration unit market estimates and forecast, through Online channels, 2017 - 2030 (USD Million, Thousand Units)
- 6.3. Offline
- 6.3.1. North America home water filtration unit market estimates and forecast, through Offline channels, 2017 - 2030 (USD Million, Thousand Units)
Chapter 7. North America Home Water Filtration Market: Country Estimates & Trend Analysis
- 7.1. Country Movement Analysis & Market Share, 2022 & 2030
- 7.2. North America
- 7.2.1 North America home water filtration unit market estimates and forecast market, 2017 - 2030 (USD Million)
- 7.2.2 North America home water filtration unit market estimates and forecast, 2017 - 2030 (Thousand Units)
- 7.2.3 North America home water filtration unit market estimates and forecast, by product, 2017 - 2030 (USD Million)
- 7.2.4 North America home water filtration unit market estimates and forecast, by product, 2017 - 2030 (Thousand Units)
- 7.2.5 North America home water filtration unit market estimates and forecast, by Distribution channel, 2017 - 2030 (USD Million)
- 7.2.6 North America home water filtration unit market estimates and forecast, by Distribution Channel, 2017 - 2030 (Thousand Units)
- 7.2.7. U.S.
- 7.2.7.1 U.S. home water filtration unit market estimates and forecast, 2017 - 2030 (USD Million)
- 7.2.7.2 U.S. home water filtration unit market estimates and forecast, 2017 - 2030 (Thousand Units)
- 7.2.7.3 U.S. home water filtration unit market estimates and forecast, by product, 2017 - 2030 (USD Million)
- 7.2.7.4 U.S. home water filtration unit market estimates and forecast, by product, 2017 - 2030 (Thousand Units)
- 7.2.7.5 U.S. home water filtration unit market estimates and forecast, by distribution channel, 2017 - 2030 (USD Million)
- 7.2.7.6 U.S. home water filtration unit market estimates and forecast, by distribution Channel, 2017 - 2030 (Thousand Units)
- 7.2.8. Canada
- 7.2.8.1 Canada home water filtration unit market estimates and forecast, 2017 - 2030 (USD Million)
- 7.2.8.2 Canada home water filtration unit market estimates and forecast, 2017 - 2030 (Thousand Units)
- 7.2.8.3 Canada home water filtration unit market estimates and forecast, by product, 2017 - 2030 (USD Million)
- 7.2.8.4 Canada home water filtration unit market estimates and forecast, by product, 2017 - 2030 (Thousand Units)
- 7.2.8.5 Canada home water filtration unit market estimates and forecast, by distribution channel, 2017 - 2030 (USD Million)
- 7.2.8.6 Canada home water filtration unit market estimates and forecast, by distribution Channel, 2017 - 2030 (Thousand Units)
- 7.2.9 Mexico
- 7.2.9.1 Mexico home water filtration unit market estimates and forecast, 2017 - 2030 (USD Million)
- 7.2.9.2 Mexico home water filtration unit market estimates and forecast, 2017 - 2030 (Thousand Units)
- 7.2.9.3 Mexico home water filtration unit market estimates and forecast, by product, 2017 - 2030 (USD Million)
- 7.2.9.4 Mexico home water filtration unit market estimates and forecast, by product, 2017 - 2030 (Thousand Units)
- 7.2.9.5 Mexico home water filtration unit market estimates and forecast, by distribution channel, 2017 - 2030 (USD Million)
- 7.2.9.6 Mexico home water filtration unit market estimates and forecast, by distribution Channel, 2017 - 2030 (Thousand Units)
Chapter 8. Competitive Analysis
- 8.1 Recent Developments & Impact Analysis by Key Market Participants
- 8.2 Key Company Categorization
- 8.3 Vendor Landscape
- 8.3.1. Key company market share analysis, 2022
Chapter 9. Company Profiles
- 9.1 Trojan Technologies Group ULC
- 9.1.1. Company Overview
- 9.1.2. Financial Performance
- 9.1.3. Product Benchmarking
- 9.1.4. Strategic Initiatives
- 9.2. Culligan Water
- 9.2.1. Company Overview
- 9.2.2. Financial Performance
- 9.2.3. Product Benchmarking
- 9.2.4. Strategic Initiatives
- 9.3. Whirlpool Corporation.
- 9.3.1. Company Overview
- 9.3.2. Financial Performance
- 9.3.3. Product Benchmarking
- 9.3.4. Strategic Initiatives
- 9.4. Brita GmbH.
- 9.4.1. Company Overview
- 9.4.2. Financial Performance
- 9.4.3. Product Benchmarking
- 9.4.4. Strategic Initiatives
- 9.5. Amway Corporation.
- 9.5.1. Company Overview
- 9.5.2. Financial Performance
- 9.5.3. Product Benchmarking
- 9.5.4. Strategic Initiatives
- 9.6. Eureka Forbes Ltd.
- 9.6.1. Company Overview
- 9.6.2. Financial Performance
- 9.6.3. Product Benchmarking
- 9.6.4. Strategic Initiatives
- 9.7. KENT RO SYSTEMS LTD
- 9.7.1. Company Overview
- 9.7.2. Financial Performance
- 9.7.3. Product Benchmarking
- 9.7.4. Strategic Initiatives
- 9.8. General Electric (GE)
- 9.8.1. Company Overview
- 9.8.2. Financial Performance
- 9.8.3. Product Benchmarking
- 9.8.4. Strategic Initiatives
- 9.9. LUMINOR Environmental Inc.
- 9.9.1. Company Overview
- 9.9.2. Financial Performance
- 9.9.3. Product Benchmarking
- 9.9.4. Strategic Initiatives
- 9.10. Hindustan Unilever Limited
- 9.10.1. Company Overview
- 9.10.2. Financial Performance
- 9.10.3. Product Benchmarking
- 9.10.4. Strategic Initiatives
- 9.11. LG Electronics.
- 9.11.1. Company Overview
- 9.11.2. Financial Performance
- 9.11.3. Product Benchmarking
- 9.11.4. Strategic Initiatives
- 9.12. Aqua Sana, Inc. (A. O. Smith Corporation)
- 9.12.1. Company Overview
- 9.12.2. Financial Performance
- 9.12.3. Product Benchmarking
- 9.12.4. Strategic Initiatives
- 9.13. Panasonic Holdings Corporation
- 9.13.1. Company Overview
- 9.13.2. Financial Performance
- 9.13.3. Product Benchmarking
- 9.13.4. Strategic Initiatives
- 9.14. Koninklijke Philips N.V
- 9.14.1. Company Overview
- 9.14.2. Financial Performance
- 9.14.3. Product Benchmarking
- 9.14.4. Strategic Initiatives