|
|
市場調査レポート
商品コード
1224601
電子処方箋の市場規模、シェア、動向分析レポート:製品別(ソリューション、サービス)、配信モード別、最終用途別、利用方法別、物質別、専門分野別、地域別、セグメント別予測、2023年~2030年E-Prescribing Market Size, Share & Trends Analysis Report By Product (Solutions, Services), By Delivery Mode, By End-use, By Usage Methods, By Substances, By Specialties, By Region, And Segment Forecasts, 2023 - 2030 |
||||||
|
|
|||||||
|
● お客様のご希望に応じて、既存データの加工や未掲載情報(例:国別セグメント)の追加などの対応が可能です。 詳細はお問い合わせください。 |
|||||||


| 電子処方箋の市場規模、シェア、動向分析レポート:製品別(ソリューション、サービス)、配信モード別、最終用途別、利用方法別、物質別、専門分野別、地域別、セグメント別予測、2023年~2030年 |
|
出版日: 2023年01月13日
発行: Grand View Research
ページ情報: 英文 150 Pages
納期: 2~10営業日
|
- 全表示
- 概要
- 図表
- 目次
電子処方箋市場の成長と動向
Grand View Research, Inc.の新しいレポートによると、世界の電子処方箋市場規模は2030年までに192億8000万米ドルに達し、CAGR26.8%で拡大すると予測されています。医薬品の乱用や不正の削減が重視されるようになり、医療システムのデジタル化に向けた政府の取り組みが活発化し、投薬ミスを減らすための取り組みが拡大していることが、成長の主な要因となっています。しかし、初期投資が高いことや、患者とヘルスケアプロバイダーの双方による新技術の採用に対する抵抗が、成長を抑制しています。一方、医療インフラの改善や新興国における医療費の増加は、市場に多くの成長機会をもたらすと予想されます。さらに、電子処方箋を用いた電子ヘルスケア記録(EHR)の利用が、成長の可能性を高めています。
ヘルスケアプロバイダーは、COVID-19の大流行時に、価格の透明性、ヘルスケア管理、特殊薬剤を強化するための相互運用性ツールの採用を増やしました。このパンデミックは、バーチャル・ヘルスケアの導入に火をつけ、電子処方箋市場は、流行が始まった数カ月の間に、遠隔医療の導入とともに、電子処方箋の数が72.5%増加するのを示しました。
電子処方箋は、完全な薬物リストの作成と維持に広く使用されています。さらに、この技術は、継続的なデータ・セキュリティ・チェックにより、完全な患者情報と処方箋の抽出も支援します。これらのサービスは、ヘルスケア分野における技術の応用の拡大と、世界各国の政府からの多大な支援により、人気を集めています。例えば、政府の取り組みとしては、北米のNational Council for Prescription Drugs ProgramやClinical Health Actなど、電子処方箋を促進するためのインセンティブプログラムが挙げられます。
市場の主要プレイヤーは、市場維持のために新製品の発売やコラボレーションに投資しています。例えば、2021年8月、Surescriptsは、医療費の節約を確実にするためのリソースを可能にするアメリカのGoodRx社と協業しました。このコラボレーションでは、保険に加入していない患者に薬を処方する際に、「Surescripts Real-Time Prescription Benefit」を使用して処方者に薬の割引価格情報を配信しました。
電子処方箋市場のレポートハイライト
導入の増加と選好の高まりにより、統合ソリューションはCAGR 26.8%で拡大する見込みです。
スタンドアロン型システム分野は、低価格と簡単なインストールにより、予測期間中に安定した成長を示すと予想される
インプリメンテーションとサポートサービスは、大きなシェアを占めると予想されます。これは、初期投資が高く、継続的なサポートサービスが必要なためと考えられる
2022年の配信モード別市場シェアは、Web/クラウドベースシステムが最多
2022年の市場シェアは、政府の取り組みやインセンティブプログラムにより、北米が40%超を占めました。
米国保健社会福祉省によると、医療ミスは米国で3番目に大きな死因となっています。
エンドユーザーセグメントでは、病院が最大の市場シェアを占めています。
目次
第1章 調査手法と範囲
- 市場セグメンテーションと範囲
- 調査手法
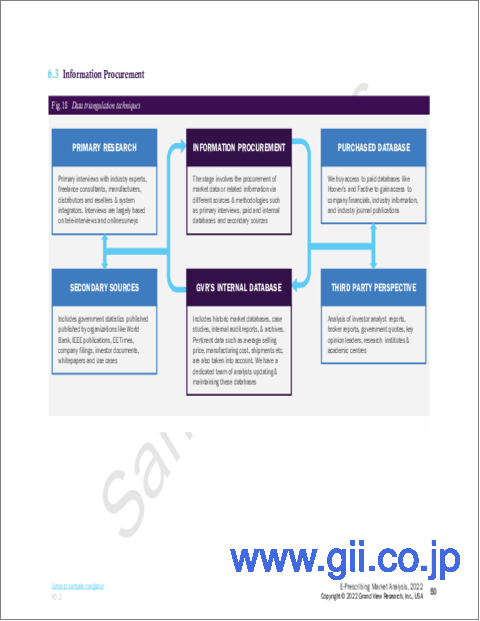
- 情報調達
- 購入したデータベース:
- Gvrの内部データベース
- 二次情報
- 1次調査
- 1次調査の詳細
- 北米での一次インタビューのデータ
- 欧州での一次インタビューのデータ
- アジア太平洋地域の一次インタビューのデータ
- ラテンアメリカでの一次面接のデータ
- 中東およびアフリカでの一次インタビューのデータ
- 情報またはデータ分析
- データ分析モデル
- 市場の策定と検証
- モデルの詳細
- コモディティフロー分析(モデル1)
- 二次情報のリスト
- 一次情報のリスト
- 目的
第2章 エグゼクティブサマリー
- 市場の見通し
- 競合考察
第3章 電子処方箋市場の変数、動向、範囲
- 市場系列の見通し
- 親市場の見通し
- アンシラリー市場の見通し
- 浸透と成長の見通しのマッピング
- 市場力学
- 市場促進要因分析
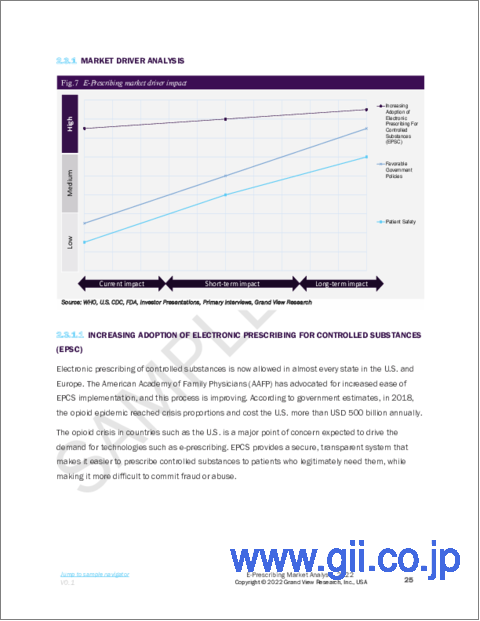
- 規制物質の電子処方箋(Epsc)の採用の増加
- 有利な政府の政策
- 患者の安全
- 市場抑制要因分析
- 不正確な情報
- 市場促進要因分析
- 電子処方箋:市場分析ツール
- 業界分析- ポーターズ
- PESTLE分析
- 価格分析
第4章 電子処方箋市場: COVID-19影響分析
- COVID-19影響分析
- 疾病有病率分析
- 現在の影響分析
- 将来の影響分析
- 市場関係者への影響
第5章 電子処方箋市場:セグメント分析、製品別、2017年から2030年(100万米ドル)
- 定義と範囲
- ソリューション
- 統合ソリューション
- スタンドアロンソリューション
- サービス
- サポートサービス
- 実装
- トレーニング
- 通信網
- ソリューション
第6章 電子処方箋市場:セグメント分析、配信モード別、2017年から2030年(100万米ドル)
- 定義と範囲
- ウェブ/クラウドベース
- オンプレミス
第7章 電子処方箋市場:セグメント分析、最終用途別、2017年から2030年(100万米ドル)
- 定義と範囲
- 病院
- オフィスベースの医師
- 薬局
第8章 電子処方箋市場:セグメント分析、使用方法別、2017年から2030年(100万米ドル)
- 定義と範囲
- ハンドヘルドデバイス
- コンピュータベースのデバイス
第9章 電子処方箋市場:セグメント分析、物質別、2017年から2030年(100万米ドル)
- 定義と範囲
- 規制物質
- 非管理物質
第10章 電子処方箋市場:セグメント分析、専門分野別、2017年から2030年(100万米ドル)
- 定義と範囲
- 腫瘍学
- スポーツ医学
- 神経学
- 心臓病学
- その他
第11章 電子処方箋市場:地域市場分析、製品別、最終用途、使用方法、送達モード、物質、専門、2017年から2030年(100万米ドル)
- 定義と範囲
- 北米
- 米国
- カナダ
- 欧州
- 英国
- ドイツ
- フランス
- イタリア
- スペイン
- オランダ
- アジア太平洋地域
- 日本
- 中国
- インド
- オーストラリア
- シンガポール
- 韓国
- ラテンアメリカ
- ブラジル
- メキシコ
- アルゼンチン
- MEA
- 南アフリカ
- サウジアラビア
- アラブ首長国連邦
第12章 電子処方箋市場-競合分析
- 市場参加の分類
- 会社のダッシュボード分析
- 市況分析
- ヒートマップ分析
- 市場参入企業の詳細リスト
第13章 電子処方箋市場-企業プロファイル
- Cerner Corporation(Oracle)
- 会社概要
- 財務実績
- 製品のベンチマーク
- 戦略的イニシアチブ
- Allscripts Healthcare, Llc
- 会社概要
- 財務実績
- 製品のベンチマーク
- 戦略的イニシアチブ
- Epic Systems Corporation
- 会社概要
- 財務実績
- 製品のベンチマーク
- 戦略的イニシアチブ
- Drfirst
- 会社概要
- 財務実績
- 製品のベンチマーク
- 戦略的イニシアチブ
- Athenahealth
- 会社概要
- 財務実績
- 製品のベンチマーク
- 戦略的イニシアチブ
- Nxgn Management, Llc
- 会社概要
- 財務実績
- 製品のベンチマーク
- 戦略的イニシアチブ
- Mckesson Corporation
- 会社概要
- 財務実績
- 製品のベンチマーク
- 戦略的イニシアチブ
- Surescripts
- 会社概要
- 財務実績
- 製品のベンチマーク
- 戦略的イニシアチブ
- Change Healthcare
- 会社概要
- 財務実績
- 製品のベンチマーク
- 戦略的イニシアチブ
- Practice Fusion, Inc.
- 会社概要
- 財務実績
- 製品のベンチマーク
- 戦略的イニシアチブ
- Networking Technology, Inc.(Rxnt)
- 会社概要
- 財務実績
- 製品のベンチマーク
- 戦略的イニシアチブ
List of Tables
- TABLE 1 List of secondary sources
- TABLE 2 Primary interview details
- TABLE 3 Pricing Analysis
- TABLE 4 Detailed list of market players
- TABLE 5 North America E-Prescribing market, by country, 2017 - 2030 (USD Million)
- TABLE 6 North America E-Prescribing market, by product, 2017 - 2030 (USD Million)
- TABLE 7 North America E-Prescribing market, by delivery mode, 2017 - 2030 (USD Million)
- TABLE 8 North America E-Prescribing market, by usage method, 2017 - 2030 (USD Million)
- TABLE 9 North America E-Prescribing market, by substances, 2017 - 2030 (USD Million)
- TABLE 10 North America E-Prescribing market, by specialties, 2017 - 2030 (USD Million)
- TABLE 11 North America E-Prescribing market, by end-use, 2017 - 2030 (USD Million)
- TABLE 12 U.S. E-Prescribing market, by product, 2017 - 2030 (USD Million)
- TABLE 13 U.S. E-Prescribing market, by delivery mode, 2017 - 2030 (USD Million)
- TABLE 14 U.S. E-Prescribing market, by usage method, 2017 - 2030 (USD Million)
- TABLE 15 U.S. E-Prescribing services market, by substances, 2017 - 2030 (USD Million)
- TABLE 16 U.S. E-Prescribing market, by specialties, 2017 - 2030 (USD Million)
- TABLE 17 U.S. E-Prescribing market, by end-use, 2017 - 2030 (USD Million)
- TABLE 18 Canada E-Prescribing market, by product, 2017 - 2030 (USD Million)
- TABLE 19 Canada E-Prescribing market, by delivery mode, 2017 - 2030 (USD Million)
- TABLE 20 Canada E-Prescribing market, by usage method, 2017 - 2030 (USD Million)
- TABLE 21 Canada E-Prescribing services market, substances, 2017 - 2030 (USD Million)
- TABLE 22 Canada E-Prescribing market, by specialties, 2017 - 2030 (USD Million)
- TABLE 23 Canada E-Prescribing market, by end-use, 2017 - 2030 (USD Million)
- TABLE 24 Europe E-Prescribing market, by country, 2017 - 2030 (USD Million)
- TABLE 25 Europe E-Prescribing market, by product, 2017 - 2030 (USD Million)
- TABLE 26 Europe E-Prescribing market, by delivery mode, 2017 - 2030 (USD Million)
- TABLE 27 Europe E-Prescribing market, by usage method, 2017 - 2030 (USD Million)
- TABLE 28 Europe E-Prescribing market, by substances, 2017 - 2030 (USD Million)
- TABLE 29 Europe E-Prescribing market, by specialties, 2017 - 2030 (USD Million)
- TABLE 30 Europe E-Prescribing services market, end-use, 2017 - 2030 (USD Million)
- TABLE 31 Germany E-Prescribing market, by product, 2017 - 2030 (USD Million)
- TABLE 32 Germany E-Prescribing market, by delivery mode, 2017 - 2030 (USD Million)
- TABLE 33 Germany E-Prescribing market, by usage method, 2017 - 2030 (USD Million)
- TABLE 34 Germany E-Prescribing market, by substances, 2017 - 2030 (USD Million)
- TABLE 35 Germany E-Prescribing services market, by specialties, 2017 - 2030 (USD Million)
- TABLE 36 Germany E-Prescribing market, by end-use, 2017 - 2030 (USD Million)
- TABLE 37 UK E-Prescribing market, by product, 2017 - 2030 (USD Million)
- TABLE 38 UK E-Prescribing market, by delivery mode, 2017 - 2030 (USD Million)
- TABLE 39 UK E-Prescribing market, by usage method, 2017 - 2030 (USD Million)
- TABLE 40 UK E-Prescribing services market, by substances, 2017 - 2030 (USD Million)
- TABLE 41 UK E-Prescribing market, by specialties, 2017 - 2030 (USD Million)
- TABLE 42 UK E-Prescribing market, by end-use, 2017 - 2030 (USD Million)
- TABLE 43 France E-Prescribing market, by product, 2017 - 2030 (USD Million)
- TABLE 44 France E-Prescribing market, by delivery mode, 2017 - 2030 (USD Million)
- TABLE 45 France E-Prescribing market, by usage method, 2017 - 2030 (USD Million)
- TABLE 46 France E-Prescribing services market, by substances, 2017 - 2030 (USD Million)
- TABLE 47 France E-Prescribing market, by specialties, 2017 - 2030 (USD Million)
- TABLE 48 France E-Prescribing market, by end-use, 2017 - 2030 (USD Million)
- TABLE 49 Italy E-Prescribing market, by product, 2017 - 2030 (USD Million)
- TABLE 50 Italy E-Prescribing market, by delivery mode, 2017 - 2030 (USD Million)
- TABLE 51 Italy E-Prescribing market, by usage method, 2017 - 2030 (USD Million)
- TABLE 52 Italy E-Prescribing services market, by substances, 2017 - 2030 (USD Million)
- TABLE 53 Italy E-Prescribing market, by specialties, 2017 - 2030 (USD Million)
- TABLE 54 Italy E-Prescribing market, by end-use, 2017 - 2030 (USD Million)
- TABLE 55 Spain E-Prescribing market, by product, 2017 - 2030 (USD Million)
- TABLE 56 Spain E-Prescribing market, by delivery mode, 2017 - 2030 (USD Million)
- TABLE 57 Spain E-Prescribing market, by usage method, 2017 - 2030 (USD Million)
- TABLE 58 Spain E-Prescribing services market, by substances, 2017 - 2030 (USD Million)
- TABLE 59 Spain E-Prescribing market, by specialties, 2017 - 2030 (USD Million)
- TABLE 60 Spain E-Prescribing market, by end-use, 2017 - 2030 (USD Million)
- TABLE 61 The Netherland E-Prescribing market, by product, 2017 - 2030 (USD Million)
- TABLE 62 The Netherland E-Prescribing market, by delivery mode, 2017 - 2030 (USD Million)
- TABLE 63 The Netherland E-Prescribing market, by usage method, 2017 - 2030 (USD Million)
- TABLE 64 The Netherland E-Prescribing services market, by substances, 2017 - 2030 (USD Million)
- TABLE 65 The Netherland E-Prescribing market, by specialties, 2017 - 2030 (USD Million)
- TABLE 66 The Netherland E-Prescribing market, by end-use, 2017 - 2030 (USD Million)
- TABLE 67 Asia Pacific E-Prescribing market, by country, 2017 - 2030 (USD Million)
- TABLE 68 Asia Pacific E-Prescribing market, by product, 2017 - 2030 (USD Million)
- TABLE 69 Asia Pacific E-Prescribing market, by delivery mode, 2017 - 2030 (USD Million)
- TABLE 70 Asia Pacific E-Prescribing market, by usage method, 2017 - 2030 (USD Million)
- TABLE 71 Asia Pacific E-Prescribing services market, by substances, 2017 - 2030 (USD Million)
- TABLE 72 Asia Pacific E-Prescribing market, by specialties, 2017 - 2030 (USD Million)
- TABLE 73 Asia Pacific E-Prescribing market, by end-use, 2017 - 2030 (USD Million)
- TABLE 74 Japan E-Prescribing market, by product, 2017 - 2030 (USD Million)
- TABLE 75 Japan E-Prescribing market, by delivery mode, 2017 - 2030 (USD Million)
- TABLE 76 Japan E-Prescribing market, by usage method, 2017 - 2030 (USD Million)
- TABLE 77 Japan E-Prescribing services market, substances, 2017 - 2030 (USD Million)
- TABLE 78 Japan E-Prescribing market, by specialties, 2017 - 2030 (USD Million)
- TABLE 79 Japan E-Prescribing market, by end-use, 2017 - 2030 (USD Million)
- TABLE 80 China E-Prescribing market, by product, 2017 - 2030 (USD Million)
- TABLE 81 China E-Prescribing services market, by delivery mode, 2017 - 2030 (USD Million)
- TABLE 82 China E-Prescribing services market, by usage method, 2017 - 2030 (USD Million)
- TABLE 83 China E-Prescribing services market, by substances, 2017 - 2030 (USD Million)
- TABLE 84 China E-Prescribing market, by specialties, 2017 - 2030 (USD Million)
- TABLE 85 China E-Prescribing market, by end-use, 2017 - 2030 (USD Million)
- TABLE 86 India E-Prescribing market, by product, 2017 - 2030 (USD Million)
- TABLE 87 India E-Prescribing market, by delivery mode, 2017 - 2030 (USD Million)
- TABLE 88 India E-Prescribing market, by usage method, 2017 - 2030 (USD Million)
- TABLE 89 India E-Prescribing services market, by substances, 2017 - 2030 (USD Million)
- TABLE 90 India E-Prescribing market, by specialties, 2017 - 2030 (USD Million)
- TABLE 91 India E-Prescribing market, by end-use, 2017 - 2030 (USD Million)
- TABLE 92 South Korea E-Prescribing market, by product, 2017 - 2030 (USD Million)
- TABLE 93 South Korea E-Prescribing services market, by delivery mode, 2017 - 2030 (USD Million)
- TABLE 94 South Korea E-Prescribing services market, by usage method, 2017 - 2030 (USD Million)
- TABLE 95 South Korea E-Prescribing services market, by substances, 2017 - 2030 (USD Million)
- TABLE 96 South Korea E-Prescribing market, by specialties, 2017 - 2030 (USD Million)
- TABLE 97 South Korea E-Prescribing market, by end-use, 2017 - 2030 (USD Million)
- TABLE 98 Singapore E-Prescribing market, by product, 2017 - 2030 (USD Million)
- TABLE 99 Singapore E-Prescribing services market, by delivery mode, 2017 - 2030 (USD Million)
- TABLE 100 Singapore E-Prescribing services market, by usage method, 2017 - 2030 (USD Million)
- TABLE 101 Singapore E-Prescribing services market, by substances, 2017 - 2030 (USD Million)
- TABLE 102 Singapore E-Prescribing market, by specialties, 2017 - 2030 (USD Million)
- TABLE 103 Singapore E-Prescribing market, by end-use, 2017 - 2030 (USD Million)
- TABLE 104 Australia E-Prescribing market, by product, 2017 - 2030 (USD Million)
- TABLE 105 Australia E-Prescribing services market, by delivery mode, 2017 - 2030 (USD Million)
- TABLE 106 Australia E-Prescribing services market, by usage method, 2017 - 2030 (USD Million)
- TABLE 107 Australia E-Prescribing services market, by substances, 2017 - 2030 (USD Million)
- TABLE 108 Australia E-Prescribing market, by specialties, 2017 - 2030 (USD Million)
- TABLE 109 Australia E-Prescribing market, by end-use, 2017 - 2030 (USD Million)
- TABLE 110 Latin America E-Prescribing market, by country, 2017 - 2030 (USD Million)
- TABLE 111 Latin America E-Prescribing market, by product, 2017 - 2030 (USD Million)
- TABLE 112 Latin America E-Prescribing market, by delivery mode, 2017 - 2030 (USD Million)
- TABLE 113 Latin America E-Prescribing market, by usage method, 2017 - 2030 (USD Million)
- TABLE 114 Latin America E-Prescribing services market, by substances, 2017 - 2030 (USD Million)
- TABLE 115 Latin America E-Prescribing market, by specialties, 2017 - 2030 (USD Million)
- TABLE 116 Latin America E-Prescribing market, by end-use, 2017 - 2030 (USD Million)
- TABLE 117 Brazil E-Prescribing market, by product, 2017 - 2030 (USD Million)
- TABLE 118 Brazil E-Prescribing market, by delivery mode, 2017 - 2030 (USD Million)
- TABLE 119 Brazil E-Prescribing market, by usage method, 2017 - 2030 (USD Million)
- TABLE 120 Brazil E-Prescribing services market, by substances, 2017 - 2030 (USD Million)
- TABLE 121 Brazil E-Prescribing market, by specialties, 2017 - 2030 (USD Million)
- TABLE 122 Brazil E-Prescribing market, by end-use, 2017 - 2030 (USD Million)
- TABLE 123 Mexico E-Prescribing market, by product, 2017 - 2030 (USD Million)
- TABLE 124 Mexico E-Prescribing market, by delivery mode, 2017 - 2030 (USD Million)
- TABLE 125 Mexico E-Prescribing market, by usage method, 2017 - 2030 (USD Million)
- TABLE 126 Mexico E-Prescribing services market, by substances, 2017 - 2030 (USD Million)
- TABLE 127 Mexico E-Prescribing market, by specialties, 2017 - 2030 (USD Million)
- TABLE 128 Mexico E-Prescribing market, by end-use, 2017 - 2030 (USD Million)
- TABLE 129 Argentina E-Prescribing market, by product, 2017 - 2030 (USD Million)
- TABLE 130 Argentina E-Prescribing market, by delivery mode, 2017 - 2030 (USD Million)
- TABLE 131 Argentina E-Prescribing market, by usage method, 2017 - 2030 (USD Million)
- TABLE 132 Argentina E-Prescribing services market, by substances, 2017 - 2030 (USD Million)
- TABLE 133 Argentina E-Prescribing market, by specialties, 2017 - 2030 (USD Million)
- TABLE 134 Argentina E-Prescribing market, by end-use, 2017 - 2030 (USD Million)
- TABLE 135 MEA E-Prescribing market, by country, 2017 - 2030 (USD Million)
- TABLE 136 MEA E-Prescribing market, by product, 2017 - 2030 (USD Million)
- TABLE 137 MEA E-Prescribing market, by delivery mode, 2017 - 2030 (USD Million)
- TABLE 138 MEA E-Prescribing market, by usage method, 2017 - 2030 (USD Million)
- TABLE 139 MEA E-Prescribing services market, by substances, 2017 - 2030 (USD Million)
- TABLE 140 MEA E-Prescribing market, by specialties, 2017 - 2030 (USD Million)
- TABLE 141 MEA E-Prescribing market, by end-use, 2017 - 2030 (USD Million)
- TABLE 142 South Africa E-Prescribing market, by product, 2017 - 2030 (USD Million)
- TABLE 143 South Africa E-Prescribing market, by delivery mode, 2017 - 2030 (USD Million)
- TABLE 144 South Africa E-Prescribing market, by usage method, 2017 - 2030 (USD Million)
- TABLE 145 South Africa E-Prescribing services market, by substances, 2017 - 2030 (USD Million)
- TABLE 146 South Africa E-Prescribing market, by specialties, 2017 - 2030 (USD Million)
- TABLE 147 South Africa E-Prescribing market, by end-use, 2017 - 2030 (USD Million)
- TABLE 148 Saudi Arabia E-Prescribing market, by product, 2017 - 2030 (USD Million)
- TABLE 149 Saudi Arabia E-Prescribing market, by delivery mode, 2017 - 2030 (USD Million)
- TABLE 150 Saudi Arabia E-Prescribing market, by usage method, 2017 - 2030 (USD Million)
- TABLE 151 Saudi Arabia E-Prescribing services market, by substances, 2017 - 2030 (USD Million)
- TABLE 152 South Africa E-Prescribing market, by specialties, 2017 - 2030 (USD Million)
- TABLE 153 Saudi Arabia E-Prescribing market, by end-use, 2017 - 2030 (USD Million)
- TABLE 154 UAE E-Prescribing market, by product, 2017 - 2030 (USD Million)
- TABLE 155 UAE E-Prescribing market, by delivery mode, 2017 - 2030 (USD Million)
- TABLE 156 UAE E-Prescribing market, by usage method, 2017 - 2030 (USD Million)
- TABLE 157 UAE E-Prescribing services market, by substances, 2017 - 2030 (USD Million)
- TABLE 158 UAE E-Prescribing market, by specialties, 2017 - 2030 (USD Million)
- TABLE 159 UAE E-Prescribing market, by end-use, 2017 - 2030 (USD Million)
List of Figures
- FIG. 1 E-prescribing market segmentation
- FIG. 2 Market research process
- FIG. 3 Information procurement
- FIG. 4 Primary research pattern
- FIG. 5 Primary interviews in North America
- FIG. 6 Primary interviews in Europe
- FIG. 7 Primary interviews in Asia Pacific
- FIG. 8 Primary interviews in Middle East and Africa
- FIG. 9 Market research approaches
- FIG. 10 Value-chain-based sizing & forecasting
- FIG. 11 Market formulation & validation
- FIG. 12 Commodity flow analysis
- FIG. 13 Volume price analysis
- FIG. 14 Market outlook
- FIG. 15 Strategy framework
- FIG. 16 Market participant categorization
- FIG. 17 Penetration & growth prospect mapping
- FIG. 18 Market driver relevance analysis (Current & future impact)
- FIG. 19 Market restraint relevance analysis (Current & future impact)
- FIG. 20 Porter's five forces analysis
- FIG. 21 PESTLE analysis
- FIG. 22 Strategy mapping
- FIG. 23 E-prescribing market: product movement analysis, 2022 & 2030
- FIG. 24 Product Segment dashboard
- FIG. 25 Solutions market, 2017 - 2030 (USD Million)
- FIG. 26 Integrated solutions market, 2017 - 2030 (USD Million)
- FIG. 27 Standalone solutions market, 2017 - 2030 (USD Million)
- FIG. 28 Services market, 2017 - 2030 (USD Million)
- FIG. 29 Support services market, 2017 - 2030 (USD Million)
- FIG. 30 Implementation services market, 2017 - 2030 (USD Million)
- FIG. 31 Training services market, 2017 - 2030 (USD Million)
- FIG. 32 Network services market, 2017 - 2030 (USD Million)
- FIG. 33 E-prescribing market: delivery mode movement analysis, 2022 & 2030
- FIG. 34 Delivery Mode Segment dashboard
- FIG. 35 Web/Cloud market, 2017 - 2030 (USD Million)
- FIG. 36 On-premise market, 2017 - 2030 (USD Million)
- FIG. 37 E-prescribing market: end-use movement analysis, 2022 & 2030
- FIG. 38 End-use Segment dashboard
- FIG. 39 Hospitals market, 2017 - 2030 (USD Million)
- FIG. 40 Office-based physician market, 2017 - 2030 (USD Million)
- FIG. 41 Pharmacy market, 2017 - 2030 (USD Million)
- FIG. 42 E-prescribing market: Usage methods movement analysis, 2022 & 2030
- FIG. 43 Usage Methods Segment dashboard
- FIG. 44 Handheld devices market, 2017 - 2030 (USD Million)
- FIG. 45 Computer-based devices market, 2017 - 2030 (USD Million)
- FIG. 46 E-prescribing market: substances movement analysis, 2022 & 2030
- FIG. 47 Segment dashboard
- FIG. 48 Controlled substances market, 2017 - 2030 (USD Million)
- FIG. 49 Non-controlled substances market, 2017 - 2030 (USD Million)
- FIG. 50 E-prescribing market: specialties movement analysis, 2022 & 2030
- FIG. 51 Specialties Segment dashboard
- FIG. 52 Oncology market, 2017 - 2030 (USD Million)
- FIG. 53 Sport medicine market, 2017 - 2030 (USD Million)
- FIG. 54 Neurology market, 2017 - 2030 (USD Million)
- FIG. 55 Cardiology market, 2017 - 2030 (USD Million)
- FIG. 56 Others market, 2017 - 2030 (USD Million)
- FIG. 57 Regional outlook, 2022 & 2030
- FIG. 58 Regional market dashboard
- FIG. 59 North America e-prescribing market, by country, 2017 - 2030 (USD Million)
- FIG. 60 U.S. e-prescribing market, 2017 - 2030 (USD Million)
- FIG. 61 Canada e-prescribing market, 2017 - 2030 (USD Million)
- FIG. 62 Europe e-prescribing market, by country, 2017 - 2030 (USD Million)
- FIG. 63 U.K. e-prescribing market, 2017 - 2030 (USD Million)
- FIG. 64 Germany e-prescribing market, 2017 - 2030 (USD Million)
- FIG. 65 France e-prescribing market, 2017 - 2030 (USD Million)
- FIG. 66 Italy e-prescribing market, 2017 - 2030 (USD Million)
- FIG. 67 Spain e-prescribing market, 2017 - 2030 (USD Million)
- FIG. 68 The Netherlands e-prescribing market, 2017 - 2030 (USD Million)
- FIG. 69 Asia Pacific e-prescribing market, by country, 2017 - 2030 (USD Million)
- FIG. 70 Japan e-prescribing market, 2017 - 2030 (USD Million)
- FIG. 71 China e-prescribing market, 2017 - 2030 (USD Million)
- FIG. 72 India e-prescribing market, 2017 - 2030 (USD Million)
- FIG. 73 Australia e-prescribing market, 2017 - 2030 (USD Million)
- FIG. 74 Singapore e-prescribing market, 2017 - 2030 (USD Million)
- FIG. 75 South Korea e-prescribing market, 2017 - 2030 (USD Million)
- FIG. 76 Latin America e-prescribing market, by country, 2017 - 2030 (USD Million)
- FIG. 77 Brazil e-prescribing market, 2017 - 2030 (USD Million)
- FIG. 78 Mexico e-prescribing market, 2017 - 2030 (USD Million)
- FIG. 79 Argentina e-prescribing market, 2017 - 2030 (USD Million)
- FIG. 80 MEA e-prescribing market, by country, 2017 - 2030 (USD Million)
- FIG. 81 South Africa e-prescribing market, 2017 - 2030 (USD Million)
- FIG. 82 Saudi Arabia e-prescribing market, 2017 - 2030 (USD Million)
- FIG. 83 UAE e-prescribing market, 2017 - 2030 (USD Million)
E-Prescribing Market Growth & Trends:
The global E-Prescribing market size is expected to reach USD 19.28 billion by 2030, expanding at a CAGR of 26.8%, according to a new report by Grand View Research, Inc. Increasing emphasis on reduction of drug abuse & fraud, rising initiatives by the government to digitalize healthcare systems, and growing efforts on reducing medication errors are the major factors driving growth. However, high initial investment and resistance to the adoption of new technology, by both patients & healthcare providers, restrain growth. On the other hand, improving healthcare infrastructure and increasing healthcare expenditure in developing countries are anticipated to provide numerous growth opportunities for the market. Moreover, using Electronic Healthcare Records (EHRs) with e-prescribing increases the growth potential.
Healthcare providers have increased interoperability tool adoption for boosting price transparency, healthcare management, and specialty medications, during the COVID-19 pandemic. The pandemic sparked the adoption of virtual healthcare and the e-prescribing market witnessed a 72.5% increase in the number of electronic prescriptions, along with the adoption of telehealth, during the starting months of the outbreak.
E-prescribing is widely used in the preparation and maintenance of complete medication lists. Moreover, the technology also aids the extraction of complete patient information and formulary with continuous data security checks. These services are gaining traction due to the increasing application of technology in the healthcare sector and significant support from governments across the world. For instance, government initiatives include incentive programs to promote e-prescribing, such as the National Council for Prescription Drugs Program and the Clinical Health Act in North America.
Key players in the market are investing in the launch of new products and collaborations for sustaining the market. For instance, in August 2021, Surescripts collaborated with GoodRx, an American company that allows resources to ensure healthcare savings. The collaboration delivered drug discount price information to prescribers using the Surescripts Real-Time Prescription Benefit while prescribing medications for patients who do not have insurance.
E-Prescribing Market Report Highlights:
- As a result of increasing adoption and growing preference, integrated solutions are expected to expand at a CAGR of 26.8%
- The standalone system segment is expected to exhibit steady growth during the forecast period, owing to the lower price and easy installation
- Implementation and support services are expected to hold significant shares. This can be attributed to high initial investment followed by an ongoing need for support services
- Web/cloud-based systems held the maximum market share by delivery mode in 2022
- North America held a major market share of over 40% in 2022, owing to government initiatives and incentive programs
- According to the U.S. Department of Health and Human Services, medical errors are the third biggest cause of death in the U.S.
- Hospitals accounted for the maximum market share in the end-user segment due to the high degree of implementation of the technology in these settings
Table of Contents
Chapter 1 Methodology And Scope
- 1.1 Market Segmentation And Scope
- 1.2 Research Methodology
- 1.3 Information Procurement
- 1.3.1 Purchased Database:
- 1.3.2 Gvr's Internal Database
- 1.3.3 Secondary Sources
- 1.3.4 Primary Research
- 1.3.5 Details Of Primary Research
- 1.3.5.1 Data For Primary Interviews In North America
- 1.3.5.2 Data For Primary Interviews In Europe
- 1.3.5.3 Data For Primary Interviews In Asia Pacific
- 1.3.5.4 Data For Primary Interviews In Latin America
- 1.3.5.5 Data For Primary Interviews In Middle East And Africa
- 1.4 Information Or Data Analysis
- 1.4.1 Data Analysis Models
- 1.5 Market Formulation & Validation
- 1.6 Model Details
- 1.6.1 Commodity Flow Analysis (Model 1)
- 1.7 List Of Secondary Sources
- 1.8 List Of Primary Sources
- 1.9 Objectives
- 1.9.1 Objective 1
- 1.9.2 Objective 2
- 1.9.3 Objective 3
- 1.9.4 Objective 4
Chapter 2 Executive Summary
- 2.1 Market Outlook
- 2.2 Competitive Insights
Chapter 3 E-Prescribing Market Variables, Trends & Scope
- 3.1 Market Lineage Outlook
- 3.1.1 Parent Market Outlook
- 3.1.2 Ancillary Market Outlook
- 3.2 Penetration & Growth Prospect Mapping
- 3.3 Market Dynamics
- 3.3.1 Market Driver Analysis
- 3.3.1.1 Increasing Adoption Of Electronic Prescribing For Controlled Substances (Epsc)
- 3.3.1.2 Favorable Government Policies
- 3.3.1.3 Patient Safety
- 3.3.2 Market Restraint Analysis
- 3.3.2.1 Inaccurate Information
- 3.3.1 Market Driver Analysis
- 3.4 E-Prescription: Market Analysis Tools
- 3.4.1 Industry Analysis - Porter's
- 3.4.2 Pestle Analysis
- 3.5 Pricing Analysis
Chapter 4 E-Prescribing Market: Covid-19 Impact Analysis
- 4.1 Covid-19 Impact Analysis
- 4.1.1 Disease Prevalence Analysis
- 4.1.2 Current Impact Analysis
- 4.1.3 Future Impact Analysis
- 4.1.4 Impact On Market Players
Chapter 5 E-Prescribing Market: Segment Analysis, By Product, 2017 - 2030 (USD Million)
- 5.1 Definition And Scope
- 5.2 Product Market Share Analysis, 2017 - 2030
- 5.3 Global E-Prescribing Market, By Product, 2017 - 2030
- 5.4 Market Size & Forecasts And Trend Analysis, 2017 - 2030
- 5.4.1 Solutions
- 5.4.1.1 Solutions Market, 2017 - 2030 (USD Million)
- 5.4.1.2 Integrated Solutions
- 5.4.1.2.1 Integrated Solutions Market, 2017 - 2030 (USD Million)
- 5.4.1.3 Standalone Solutions
- 5.4.1.3.1 Standalone Solutions Market, 2017 - 2030 (USD Million)
- 5.4.2 Services
- 5.4.2.1 Services Market, 2017 - 2030 (USD Million)
- 5.4.2.2 Support Services
- 5.4.2.2.1 Support Services Market, 2017 - 2030 (USD Million)
- 5.4.2.3 Implementation
- 5.4.2.3.1 Implementation Market, 2017 - 2030 (USD Million)
- 5.4.2.4 Training
- 5.4.2.4.1 Training Market, 2017 - 2030 (USD Million)
- 5.4.2.5 Network
- 5.4.2.5.1 Network Market, 2017 - 2030 (USD Million)
- 5.4.1 Solutions
Chapter 6 E-Prescribing Market: Segment Analysis, By Delivery Mode, 2017 - 2030 (USD Million)
- 6.1 Definition And Scope
- 6.2 Delivery Mode Market Share Analysis, 2017 - 2030
- 6.3 Global E-Prescribing Market, By Delivery Mode, 2017 - 2030
- 6.4 Market Size & Forecasts And Trend Analysis, 2017 - 2030
- 6.4.1 Web/Cloud Based
- 6.4.1.1 Web Market, 2017 - 2030 (USD Million)
- 6.4.2 On-Premise
- 6.4.2.1 On-Premise Market, 2017 - 2030 (USD Million)
- 6.4.1 Web/Cloud Based
Chapter 7 E-Prescribing Market: Segment Analysis, By End-Use, 2017 - 2030 (USD Million)
- 7.1 Definition And Scope
- 7.2 End-Use Market Share Analysis, 2017 - 2030
- 7.3 Global E-Prescribing Market, By End-Use, 2017 - 2030
- 7.4 Market Size & Forecasts And Trend Analysis, 2017 - 2030
- 7.4.1 Hospitals
- 7.4.1.1 Hospitals Market, 2017 - 2030 (USD Million)
- 7.4.2 Office Based Physician
- 7.4.2.1 Office Based Physician Market, 2017 - 2030 (USD Million)
- 7.4.3 Pharmacy
- 7.4.3.1 Pharmacy Market, 2017 - 2030 (USD Million)
- 7.4.1 Hospitals
Chapter 8 E-Prescribing Market: Segment Analysis, By Usage Method, 2017 - 2030 (USD Million)
- 8.1 Definition And Scope
- 8.2 Usage Methods Market Share Analysis, 2017 - 2030
- 8.3 Global E-Prescribing Market, By Usage Methods, 2017 - 2030
- 8.4 Market Size & Forecasts And Trend Analysis, 2017 - 2030
- 8.4.1 Handheld Devices
- 8.4.1.1 Handheld Devices Market, 2017 - 2030 (USD Million)
- 8.4.2 Computer-Based Devices
- 8.4.2.1 Computer-Based Devices Market, 2017 - 2030 (USD Million)
- 8.4.1 Handheld Devices
Chapter 9 E-Prescribing Market: Segment Analysis, By Substances, 2017 - 2030 (USD Million)
- 9.1 Definition And Scope
- 9.2 Substances Market Share Analysis, 2017 - 2030
- 9.3 Global E-Prescribing Market, By Substances, 2017 - 2030
- 9.4 Market Size & Forecasts And Trend Analysis, 2017 - 2030
- 9.4.1 Controlled Substances
- 9.4.1.1 Controlled Substances Market, 2017 - 2030 (USD Million)
- 9.4.2 Non-Controlled Substances
- 9.4.2.1 Non-Controlled Substances Market, 2017 - 2030 (USD Million)
- 9.4.1 Controlled Substances
Chapter 10 E-Prescribing Market: Segment Analysis, By Specialties, 2017 - 2030 (USD Million)
- 10.1 Definition And Scope
- 10.2 Specialties Market Share Analysis, 2017 - 2030
- 10.3 Global E-Prescribing Market, By Specialties, 2017 - 2030
- 10.4 Market Size & Forecasts And Trend Analysis, 2017 - 2030
- 10.4.1 Oncology
- 10.4.1.1 Oncology Market, 2017 - 2030 (USD Million)
- 10.4.2 Sports Medicine
- 10.4.2.1 Sports Medicine Market, 2017 - 2030 (USD Million)
- 10.4.3 Neurology
- 10.4.3.1 Neurology Market, 2017 - 2030 (USD Million)
- 10.4.4 Cardiology
- 10.4.4.1 Cardiology Market, 2017 - 2030 (USD Million)
- 10.4.5 Others
- 10.4.5.1 Others Market, 2017 - 2030 (USD Million)
- 10.4.1 Oncology
Chapter 11 E-Prescribing Market: Regional Market Analysis, By Products, End-Use, Usage Methods, Delivery Mode, Substance, Specialties, 2017 - 2030 (USD Million)
- 11.1 Definition & Scope
- 11.2 North America
- 11.2.1 North America Market Estimates And Forecast, By Country, 2017-2030 (USD Million)
- 11.2.2 U.S.
- 11.2.2.1 U.S. E-Prescribing Market, 2017 - 2030 (USD Million)
- 11.2.3 Canada
- 11.2.3.1 Canada E-Prescribing Market, 2017 - 2030 (USD Million)
- 11.3 Europe
- 11.3.1 Europe E-Prescribing Market, By Country, 2017 - 2030 (USD Million)
- 11.3.2 Uk
- 11.3.2.1 Uk E-Prescribing Market, 2017 - 2030 (USD Million)
- 11.3.3 Germany
- 11.3.3.1 Germany E-Prescribing Market, 2017 - 2030 (USD Million)
- 11.3.4 France
- 11.3.4.1 France E-Prescribing Market, 2017 - 2030 (USD Million)
- 11.3.5 Italy
- 11.3.5.1 Italy E-Prescribing Market, 2017 - 2030 (USD Million)
- 11.3.6 Spain
- 11.3.6.1 Spain E-Prescribing Market, 2017 - 2030 (USD Million)
- 11.3.7 The Netherlands
- 11.3.7.1 The Netherlands E-Prescribing Market, 2017 - 2030 (USD Million)
- 11.4 Asia Pacific
- 11.4.1 Asia Pacific E-Prescribing Market, By Country, 2017 - 2030 (USD Million)
- 11.4.2 Japan
- 11.4.2.1 Japan E-Prescribing Market, 2017 - 2030 (USD Million)
- 11.4.3 China
- 11.4.3.1 China E-Prescribing Market, 2017 - 2030 (USD Million)
- 11.4.4 India
- 11.4.4.1 India E-Prescribing Market, 2017 - 2030 (USD Million)
- 11.4.5 Australia
- 11.4.5.1 Australia E-Prescribing Market, 2017 - 2030 (USD Million)
- 11.4.6 Singapore
- 11.4.6.1 Singapore E-Prescribing Market, 2017 - 2030 (USD Million)
- 11.4.7 South Korea
- 11.4.7.1 South Korea E-Prescribing Market, 2017 - 2030 (USD Million)
- 11.5 Latin America
- 11.5.1 Latin America E-Prescribing Market, By Country, 2017 - 2030 (USD Million)
- 11.5.2 Brazil
- 11.5.2.1 Brazil E-Prescribing Market, 2017 - 2030 (USD Million)
- 11.5.3 Mexico
- 11.5.3.1 Mexico E-Prescribing Market, 2017 - 2030 (USD Million)
- 11.5.4 Argentina
- 11.5.4.1 Argentina E-Prescribing Market, 2017 - 2030 (USD Million)
- 11.6 MEA
- 11.6.1 MEA E-Prescribing Market, By Country2017 - 2030 (USD Million)
- 11.6.2 South Africa
- 11.6.2.1 South Africa E-Prescribing Market, 2017 - 2030 (USD Million)
- 11.6.3 Saudi Arabia
- 11.6.3.1 Saudi Arabia E-Prescribing Market, 2017 - 2030 (USD Million)
- 11.6.4 Uae
- 11.6.4.1 Uae E-Prescribing Market, 2017 - 2030 (USD Million)
Chapter 12 E-Prescribing Market - Competitive Analysis
- 12.1 Market Participation Categorization
- 12.2 Company Dashboard Analysis
- 12.3 Market Position Analysis
- 12.4 Heat Map Analysis
- 12.5 Detailed List Of Market Participants
Chapter 13 E-Prescribing Market- Company Profiles
- 13.1 Cerner Corporation (Oracle)
- 13.1.1 Company Overview
- 13.1.2 Financial Performance
- 13.1.3 Product Benchmarking
- 13.1.4 Strategic Initiatives
- 13.2 Allscripts Healthcare, Llc
- 13.2.1 Company Overview
- 13.2.2 Financial Performance
- 13.2.3 Product Benchmarking
- 13.2.4 Strategic Initiatives
- 13.3 Epic Systems Corporation
- 13.3.1 Company Overview
- 13.3.2 Financial Performance
- 13.3.3 Product Benchmarking
- 13.3.4 Strategic Initiatives
- 13.4 Drfirst
- 13.4.1 Company Overview
- 13.4.2 Financial Performance
- 13.4.3 Product Benchmarking
- 13.4.4 Strategic Initiatives
- 13.5 Athenahealth
- 13.5.1 Company Overview
- 13.5.2 Financial Performance
- 13.5.3 Product Benchmarking
- 13.5.4 Strategic Initiatives
- 13.6 Nxgn Management, Llc
- 13.6.1 Company Overview
- 13.6.2 Financial Performance
- 13.6.3 Product Benchmarking
- 13.6.4 Strategic Initiatives
- 13.7 Mckesson Corporation
- 13.7.1 Company Overview
- 13.7.2 Financial Performance
- 13.7.3 Product Benchmarking
- 13.7.4 Strategic Initiatives
- 13.8 Surescripts
- 13.8.1 Company Overview
- 13.8.2 Financial Performance
- 13.8.3 Product Benchmarking
- 13.8.4 Strategic Initiatives
- 13.9 Change Healthcare
- 13.9.1 Company Overview
- 13.9.2 Financial Performance
- 13.9.3 Product Benchmarking
- 13.9.4 Strategic Initiatives
- 13.10 Practice Fusion, Inc.
- 13.10.1 Company Overview
- 13.10.2 Financial Performance
- 13.10.3 Product Benchmarking
- 13.10.4 Strategic Initiatives
- 13.11 Networking Technology, Inc. (Rxnt)
- 13.11.1 Company Overview
- 13.11.2 Financial Performance
- 13.11.3 Product Benchmarking
- 13.11.4 Strategic Initiatives