|
|
市場調査レポート
商品コード
1345376
電子処方箋の世界市場-2023年~2030年Global E-prescribing Market - 2023-2030 |
||||||
|
|
|||||||
カスタマイズ可能
適宜更新あり
|
|||||||


| 電子処方箋の世界市場-2023年~2030年 |
|
出版日: 2023年09月06日
発行: DataM Intelligence
ページ情報: 英文 195 Pages
納期: 即日から翌営業日
|

- 全表示
- 概要
- 目次
市場概要
世界の電子処方箋市場は、2022年に29億米ドルに達し、2023-2030年の予測期間中にCAGR 16.4%で成長し、2030年には94億米ドルに達すると予測されています。
電子処方箋とは、処方箋の正確性を向上させ、患者の安全性を高め、コストを削減すると同時に、臨床医と薬剤師間の安全でリアルタイムな双方向電子接続を可能にする医療技術の利用です。投薬ミスや薬物有害事象は、毎年およそ7,500人の死者を出し、薬物関連の罹患率と死亡率の年間推定コストは750億米ドルに達します。
さらに、電子カルテ (EHR) ソリューションの採用増加、政府のイニシアティブ、インセンティブプログラム、不正行為や規制薬物/薬物乱用の削減への注目の高まり、医療提供者による電子処方箋の採用増加などの要因が、電子処方箋の市場規模の成長を促進しています。米国やカナダのような国々での技術進歩の大規模な上昇により、市場は北米地域からの需要が増加しています。
ダイナミクス
各社の戦略が市場成長を後押し
各社の製品投入、提携、その他の戦略が市場成長を後押ししています。例えば、2022年8月18日、先進的なバイオテクノロジー企業であるParker Health社は、FDB Vela社との協業を発表しました。FDB Vela社は、新しいクラウドネイティブの電子処方箋(ePrescribing)ネットワークであり、処方者、支払者、薬局、その他の構成員間の重要な薬処方情報、給付確認、臨床判断支援のシームレスな流れを可能にします。
パーカー・ヘルス社は、FDB Velaの完全なAPIを利用することで、パーカー・スイート・ヘルス・マネジメント・システムが処方医向けにウェブやモバイル・アプリケーション内で処方情報を表示する方法をカスタマイズすることができます。
さらに、2023年3月には、臨床医が処方箋を電子的に書き、薬局に送信できるようにするSaaSプラットフォームであるDoseSpotが、Bravado HealthのTreatRxセグメントを買収し、DoseSpotの医療提供者向けソリューションセットを強化・拡大し、電子処方箋ソフトウェアの統合市場での地位向上に貢献しています。このように、各社の取り組みは市場拡大を後押ししています。
老年人口の増加と政府の取り組みが市場成長を後押し
AHIMAのPerspectives in Health Information Managementに掲載された調査によると、電子処方箋は高齢の患者にとって期待される技術であり、また好まれる技術でもあります。患者は、電子処方箋を紙ベースの処方箋よりも安全で便利、かつ効率的であると認識しており、医療従事者とのコミュニケーションも促進されるため、服薬の安全性向上にも貢献する可能性があります。
例えば、WHOによれば、2030年までに世界の約5人に1人が60歳以上の高齢者となります。この時、60歳以上の人口に占める割合は2020年の10億人から14億人に増加します。2050年までに、世界の60歳以上の人口は倍増します。80歳以上の人口は2020年から2050年の間に3倍に増え、4,250億人に達すると予想されます。このように、上記の要因が市場の成長を後押ししています。
ソフトウェア設計の問題が市場成長を妨げる
電子処方箋ソフトのデザイン要素はエラーの可能性を高めるかもしれません。例えば、ドロップダウンメニュー、画面デザインの悪さ、自動入力機能などは、潜在的なエラーの原因として指摘されており、その結果、患者の安全を脅かすことになります。さらに、処方箋の記録や更新を人間が行う必要があり、また、ギャップや不正確さ、明確さの欠如を改善するために医療提供者がフォローアップを行う可能性もあるため、これらのデザイン面はワークフローの問題を助長する可能性があります。
患者が注文を受ける前に薬局に到着する可能性があるため、患者の不満や待ち時間の長さは、新しい電子処方箋の到着の遅れに起因するかもしれません。その結果、上記の要因が市場拡大を制限することになります。
目次
第1章 調査手法と調査範囲
第2章 定義と概要
第3章 エグゼクティブサマリー
第4章 市場力学
- 影響要因
- 促進要因
- 各社の戦略
- 高齢者人口の増加と政府の取り組み
- 抑制要因
- ソフトウェア設計の問題
- 機会
- 新技術の更なる研究開発
- 影響分析
- 促進要因
第5章 業界分析
- ポーターのファイブフォース分析
- サプライチェーン分析
- 価格分析
- 規制分析
- アンメットニーズ
第6章 COVID-19分析
第7章 システムタイプ別
- 統合型システム
- 独立型システム
第8章 提供形態別
- Web/クラウドベース
- オンプレミス
第9章 コンポーネント別
- ソフトウェア
- ハードウェア
- サービス
第10章 エンドユーザー別
- 病院・クリニック
- 開業医
- 薬局
第11章 地域別
- 北米
- 米国
- カナダ
- メキシコ
- 欧州
- ドイツ
- 英国
- フランス
- スペイン
- イタリア
- その他欧州
- 南米
- ブラジル
- アルゼンチン
- その他南米
- アジア太平洋
- 中国
- インド
- 日本
- オーストラリア
- その他アジア太平洋
- 中東・アフリカ
第12章 競合情勢
- 競合シナリオ
- 市況/シェア分析
- M&A分析
第13章 企業プロファイル
- CharmHealth
- 会社概要
- 製品ポートフォリオと説明
- 財務概要
- 主な動向
- Cerner Corporation
- GE Healthcare
- Epic Systems Corporation
- ScriptSure
- Athenahealth
- iCare Billing
- NextGen Healthcare
- DrFirst, Inc
- RelayHealth, LLC.
第14章 付録
Market Overview
Global E-prescribing Market reached US$ 2.9 billion in 2022 and is expected to reach US 9.4 billion by 2030 growing with a CAGR of 16.4% during the forecast period 2023-2030.
E-prescribing is the use of health care technology to improve prescription accuracy, boost patient safety, and lower costs while also enabling secure, real-time, bidirectional electronic connectivity between clinicians and pharmacists. Medication errors and adverse drug events cause roughly 7,500 fatalities each year, with an estimated annual cost of drug-related morbidity and mortality reaching $75 billion.
Additionally, factors such as the rising adoption of EHR solutions, government initiatives, and incentive programs, the rising focus on reducing fraud, controlled substances/drug abuse, and the increasing adoption of e-prescriptions by healthcare providers are driving the growth of the e-prescribing market size. Due to the massive rise in technological advancements in countries like the U.S. and Canada, the market is experincing an rise in demand from North American regions.
Dynamics
The Strategies Followed by the Companies Helps to Drive the Market Growth
The product launches, collabrations and other strategies followed by the companies helps to drive the segment growth. For instance, on August 18, 2022, Parker Health, a forward-thinking biotechnology company, has announced a collaboration with FDB Vela, a new cloud-native electronic prescribing (ePrescribing) network that enables the seamless flow of critical medication prescription information, benefits verification, and clinical decision support between prescribers, payers, pharmacies, and other constituents.
Parker Health can customise how the Parker Suite Health Management System presents prescription information inside the web and mobile applications for prescribers thanks to FDB Vela's full API experience.
Additionally, in March 2023, DoseSpot, a SaaS platform that allows clinicians to electronically write and transmit prescriptions to pharmacies, has acquired the TreatRx segment of Bravado Health to strengthen and expand DoseSpot's solution set for healthcare providers and help advance its position in the ePrescribing software integration market. Thus, the organisations' initiatives aid in driving market expansion.
Growing Geriatric Population and Government Efforts are Pushing the Market Growth
According to a study published in AHIMA's Perspectives in Health Information Management, electronic prescribing is both an expected and preferred technology for elderly patients, the majority of whom must juggle many drugs on a daily basis. Patients perceive ePrescribing to be safer, more convenient, and more efficient than paper-based prescriptions, and it fosters increased communication with healthcare practitioners, which may contribute to enhanced medication safety.
For instance, according to WHO, by 2030, around 1 in 5 people in the world will be aged 60 years or over. At this time the share of the population aged 60 years and over will increase from 1.0 billion in 2020 to 1.4 billion. By 2050, the world's population of people aged 60 years and older will double. The number of persons aged 80 years or older is expected to triple between 2020 and 2050 to reach 425 Billion. Thus above factors helps to drive the market growth.
The Software Design Issues will Hamper the Market Growth
E-prescribing software's design elements may enhance the chance of errors. Drop-down menus, bad screen design, and automatic filling functions, for example, have been noted as potential causes of errors and, as a result, hazards to patient safety. Furthermore, because they need human recording and updating of prescriptions, as well as potential follow-up with providers to remedy gaps, inaccuracies, or lack of clarity, these design aspects may contribute to workflow issues.
Patient dissatisfaction and longer waiting times might come from delays in the arrival of new e-prescriptions, as patients may arrive at the pharmacy before an order has been received. As a result, the above factors restrict market expansion.
For more details on this report - Request for Sample
Segment Analysis
The global E-prescribing market is segmented based on system type, delivery mode, component, end user and region.
The Software Accounted for Approximately 51.7% of the E-prescribing Market Share
Software has grown essential in the healthcare industry. Initially, software was viewed as only a means of digitising a patient's medical document and record. Since then, software has evolved to manage the exponential increase in the amount of data required by modern healthcare practitioners.
E-prescribing has been implemented as a fundamental feature by manufacturers in an effort to increase functionality and attract healthcare systems to use their platforms. This is advantageous because, even if new patients visit a medical practise for the first time, their digital healthcare record may be safely followed. Technological developments contribute to the segment's growth.
For instance, Kareo is one of the most popular software alternatives for healthcare organisations without an EMR system in 2021. According to the Kareo review, the programme is accessible from any device and provides clinicians with various useful options, such as saving frequently prescribed medications as favourites. Other top performers provide e-prescribing software that may be used as a standalone application or that connects with existing EHR platforms. As a result, the aforementioned elements contribute to segment growth.
Geographical Penetration
North America Accounted for Approximately 45.4% of the Market Share in 2022
North America is predicted to be the fastest growing regional market share owing to the increasing adoption of electronic prescribing systems and initiatives encouraging e-prescribing, such as the National Council for Prescription Drugs Program and the Health Information Technology for Economic and Clinical Health (HITECH) Act.
Moreover, the advanced regional healthcare infrastructure, and the presence of established market players such as Surescripts-Rxhub LLC, NextGen Healthcare, Oracle, Epic Systems Corporation, NextGen Healthcare, Inc., and Athenahealth, Inc and rise in healthcare expenditure will helps to drive the region growth .
For instance, according to the National Health Expenditure Account (NHEA), the total annual healthcare expenditure in the United States is increased by 2.7% to $4.3 trillion. Physician spending grew by an average of 3.8% per year while hospital services (4.5%) and clinical services (6.6%) had higher growth rates.
Competitive Landscape
The major global players in the E-prescribing market CharmHealth, Cerner Corporation, GE Healthcare, Epic Systems Corporation, ScriptSure, Athenahealth, iCare Billing, NextGen Healthcare, DrFirst, Inc, RelayHealth, LLC and others.
COVID-19 Impact Analysis
The positive market impact of e-prescribe, which has been widely implemented throughout the world, is the inefficiency of written prescriptions. In a rush, doctors can write trivial mistakes, and chemists may struggle to read the doctor's writing. As a result, the patient is kept at the pharmacy for longer than necessary due to the lengthy decoding procedure. It can also form lines, increasing visitor contact.
E-prescribing has the potential to increase patient access to prescription drugs while also being convenient. The surge in e-prescribing during the lockout revealed how the system may be improved, including better mistake feedback, greater uniformity between practises and pharmacies, more proactive engagement with patients, and more equitable prescribing prices.
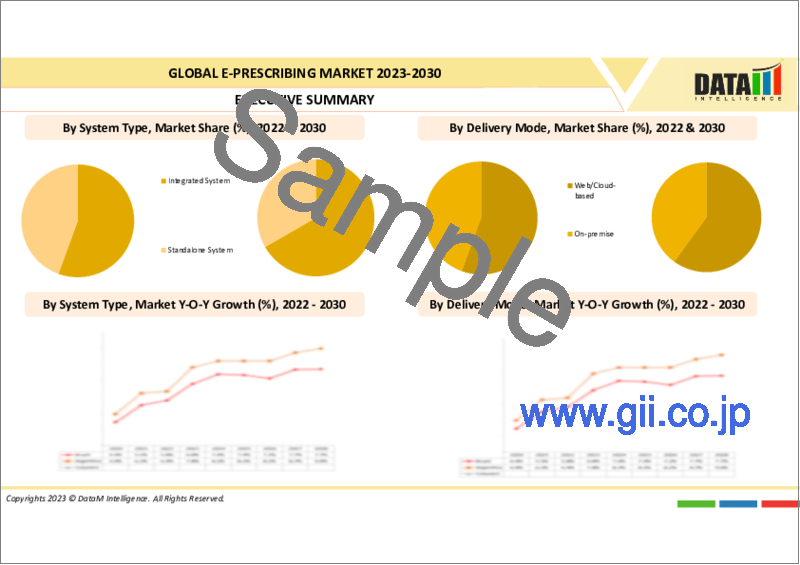
By System Type
- Integrated System
- Standalone System
By Delivery Mode
- Web/Cloud-based
- On-premise
By Component
- Software
- Hardware
- Services
By End User
- Hospitals and Clinics
- Office-based Physicians
- Pharmacy
By Region
- North America
U.S.
Canada
Mexico
- Europe
Germany
U.K.
France
Spain
Italy
Rest of Europe
- South America
Brazil
Argentina
Rest of South America
- Asia-Pacific
China
India
Japan
Australia
Rest of Asia-Pacific
- Middle East and Africa
Key Developments
- In August 2022, CLEO Systems has launched an electronic prescription system with the goal of reducing prescribing errors, increasing sustainability, and simplifying the process for both professionals and patients. CLEO SOLO EPS provides practitioners with immediate prescribing capabilities, eliminating the requirement for system integration. This means that once a patient's prescription is entered, it can be electronically transmitted to a designated community pharmacy.
- On October 11, 2022, Walgreens Boots Alliance, Inc. stated that it has accelerated its intentions to acquire full ownership of CareCentrix, expanding its reach into the booming homecare sector and pursuing its long-term healthcare growth strategy. WBA has entered into a permanent agreement to acquire the remaining 45% ownership in CareCentrix for approximately $392 Billion, based on the exit multiple agreed to when WBA announced its first majority investment in CareCentrix.
- On August 01, 2023, The Central and North West London NHS Foundation Trust's addictions service (CNWL Addictions) has announced the introduction of their EPS. It claims to be the country's first addictions service to introduce an EPS, which means patients will no longer have to wait at the unit for their paper prescriptions to be prepared.
Why Purchase the Report?
- To visualize the global E-prescribing market segmentation based on system type, delivery mode, component, end user and region as well as understand key commercial assets and players.
- Identify commercial opportunities by analyzing trends and co-development.
- Excel data sheet with numerous data points of E-prescribing market-level with all segments.
- PDF report consists of a comprehensive analysis after exhaustive qualitative interviews and an in-depth study.
- Product mapping available as excel consisting of key products of all the major players.
The global E-prescribing market report would provide approximately 53 tables, 54 figures and 195 Pages.
Target Audience 2023
- Manufacturers/ Buyers
- Industry Investors/Investment Bankers
- Research Professionals
- Emerging Companies
Table of Contents
1. Methodology and Scope
- 1.1. Research Methodology
- 1.2. Research Objective and Scope of the Report
2. Definition and Overview
3. Executive Summary
- 3.1. Snippet by System Type
- 3.2. Snippet by Delivery Mode
- 3.3. Snippet by Component
- 3.4. Snippet by End User
- 3.5. Snippet by Region
4. Dynamics
- 4.1. Impacting Factors
- 4.1.1. Drivers
- 4.1.1.1. The strategies followed by the companies
- 4.1.1.2. Growing geriatric population and Government efforts
- 4.1.2. Restraints
- 4.1.2.1. The software design issues
- 4.1.3. Opportunity
- 4.1.3.1. Additional research and development of new technologies
- 4.1.4. Impact Analysis
- 4.1.1. Drivers
5. Industry Analysis
- 5.1. Porter's 5 Forces Analysis
- 5.2. Supply Chain Analysis
- 5.3. Pricing Analysis
- 5.4. Regulatory Analysis
- 5.5. Unmet Needs
6. COVID-19 Analysis
- 6.1. Analysis of COVID-19
- 6.1.1. Scenario Before COVID-19
- 6.1.2. Scenario During COVID-19
- 6.1.3. Scenario Post COVID-19
- 6.2. Pricing Dynamics Amid COVID-19
- 6.3. Demand-Supply Spectrum
- 6.4. Government Initiatives Related to the Market During Pandemic
- 6.5. Manufacturers Strategic Initiatives
- 6.6. Conclusion
7. By System Type
- 7.1. Introduction
- 7.1.1. Market Size Analysis and Y-o-Y Growth Analysis (%), By System Type
- 7.1.2. Market Attractiveness Index, By System Type
- 7.2. Integrated System *
- 7.2.1. Introduction
- 7.2.2. Market Size Analysis and Y-o-Y Growth Analysis (%)
- 7.2.3. Standalone System
8. By Delivery Mode
- 8.1. Introduction
- 8.1.1. Market Size Analysis and Y-o-Y Growth Analysis (%), By Delivery Mode
- 8.1.2. Market Attractiveness Index, By Delivery Mode
- 8.2. Web/Cloud-based *
- 8.2.1. Introduction
- 8.2.2. Market Size Analysis and Y-o-Y Growth Analysis (%)
- 8.3. On-premise
9. By Component
- 9.1. Introduction
- 9.1.1. Market Size Analysis and Y-o-Y Growth Analysis (%), By Component
- 9.1.2. Market Attractiveness Index, By Component
- 9.2. Software*
- 9.2.1. Introduction
- 9.2.2. Market Size Analysis and Y-o-Y Growth Analysis (%)
- 9.3. Hardware
- 9.4. Services
10. By End User
- 10.1. Introduction
- 10.1.1. Market Size Analysis and Y-o-Y Growth Analysis (%), By End User
- 10.1.2. Market Attractiveness Index, By End User
- 10.2. Hospitals and Clinics *
- 10.2.1. Introduction
- 10.2.2. Market Size Analysis and Y-o-Y Growth Analysis (%)
- 10.3. Office-based Physicians
- 10.4. Pharmacy
11. By Region
- 11.1. Introduction
- 11.1.1. Market Size Analysis and Y-o-Y Growth Analysis (%), By Region
- 11.1.2. Market Attractiveness Index, By Region
- 11.2. North America
- 11.2.1. Introduction
- 11.2.2. Key Region-Specific Dynamics
- 11.2.3. Market Size Analysis and Y-o-Y Growth Analysis (%), By System Type
- 11.2.4. Market Size Analysis and Y-o-Y Growth Analysis (%), By Delivery Mode
- 11.2.5. Market Size Analysis and Y-o-Y Growth Analysis (%), By Component
- 11.2.6. Market Size Analysis and Y-o-Y Growth Analysis (%), By End User
- 11.2.7. Market Size Analysis and Y-o-Y Growth Analysis (%), By Country
- 11.2.7.1. U.S.
- 11.2.7.2. Canada
- 11.2.7.3. Mexico
- 11.3. Europe
- 11.3.1. Introduction
- 11.3.2. Key Region-Specific Dynamics
- 11.3.3. Market Size Analysis and Y-o-Y Growth Analysis (%), By System Type
- 11.3.4. Market Size Analysis and Y-o-Y Growth Analysis (%), By Delivery Mode
- 11.3.5. Market Size Analysis and Y-o-Y Growth Analysis (%), By Component
- 11.3.6. Market Size Analysis and Y-o-Y Growth Analysis (%), By End User
- 11.3.7. Market Size Analysis and Y-o-Y Growth Analysis (%), By Country
- 11.3.7.1. Germany
- 11.3.7.2. U.K.
- 11.3.7.3. France
- 11.3.7.4. Spain
- 11.3.7.5. Italy
- 11.3.7.6. Rest of Europe
- 11.4. South America
- 11.4.1. Introduction
- 11.4.2. Key Region-Specific Dynamics
- 11.4.3. Market Size Analysis and Y-o-Y Growth Analysis (%), By System Type
- 11.4.4. Market Size Analysis and Y-o-Y Growth Analysis (%), By Delivery Mode
- 11.4.5. Market Size Analysis and Y-o-Y Growth Analysis (%), By Component
- 11.4.6. Market Size Analysis and Y-o-Y Growth Analysis (%), By End User
- 11.4.7. Market Size Analysis and Y-o-Y Growth Analysis (%), By Country
- 11.4.7.1. Brazil
- 11.4.7.2. Argentina
- 11.4.7.3. Rest of South America
- 11.5. Asia-Pacific
- 11.5.1. Introduction
- 11.5.2. Key Region-Specific Dynamics
- 11.5.3. Market Size Analysis and Y-o-Y Growth Analysis (%), By System Type
- 11.5.4. Market Size Analysis and Y-o-Y Growth Analysis (%), By Delivery Mode
- 11.5.5. Market Size Analysis and Y-o-Y Growth Analysis (%), By Component
- 11.5.6. Market Size Analysis and Y-o-Y Growth Analysis (%), By End User
- 11.5.7. Market Size Analysis and Y-o-Y Growth Analysis (%), By Country
- 11.5.7.1. China
- 11.5.7.2. India
- 11.5.7.3. Japan
- 11.5.7.4. Australia
- 11.5.7.5. Rest of Asia-Pacific
- 11.6. Middle East and Africa
- 11.6.1. Introduction
- 11.6.2. Key Region-Specific Dynamics
- 11.6.3. Market Size Analysis and Y-o-Y Growth Analysis (%), By System Type
- 11.6.4. Market Size Analysis and Y-o-Y Growth Analysis (%), By Delivery Mode
- 11.6.5. Market Size Analysis and Y-o-Y Growth Analysis (%), By Component
- 11.6.6. Market Size Analysis and Y-o-Y Growth Analysis (%), By End User
12. Competitive Landscape
- 12.1. Competitive Scenario
- 12.2. Market Positioning/Share Analysis
- 12.3. Mergers and Acquisitions Analysis
13. Company Profiles
- 13.1. CharmHealth*
- 13.1.1. Company Overview
- 13.1.2. Product Portfolio and Description
- 13.1.3. Financial Overview
- 13.1.4. Key Developments
- 13.2. Cerner Corporation
- 13.3. GE Healthcare
- 13.4. Epic Systems Corporation
- 13.5. ScriptSure
- 13.6. Athenahealth
- 13.7. iCare Billing
- 13.8. NextGen Healthcare
- 13.9. DrFirst, Inc
- 13.10. RelayHealth, LLC.
LIST NOT EXHAUSTIVE
14. Appendix
- 14.1. About Us and Services
- 14.2. Contact Us
