|
|
市場調査レポート
商品コード
1224600
電子データキャプチャ(EDC)システムの市場規模、シェア、動向分析レポート:コンポーネント別、配信モード別(ウェブ&クラウドベース、オンプレミス)、開発フェーズ別(フェーズI、II、III、IV)、最終用途別、地域別、セグメント予測、2023年~2030年Electronic Data Capture Systems Market Size, Share & Trends Analysis Report By Component, By Delivery Mode (Web & Cloud Based, On-premise), By Development Phase (Phase I, II, III, IV), By End-user, By Region, And Segment Forecasts, 2023 - 2030 |
||||||
|
|
|||||||
|
● お客様のご希望に応じて、既存データの加工や未掲載情報(例:国別セグメント)の追加などの対応が可能です。 詳細はお問い合わせください。 |
|||||||


| 電子データキャプチャ(EDC)システムの市場規模、シェア、動向分析レポート:コンポーネント別、配信モード別(ウェブ&クラウドベース、オンプレミス)、開発フェーズ別(フェーズI、II、III、IV)、最終用途別、地域別、セグメント予測、2023年~2030年 |
|
出版日: 2023年01月13日
発行: Grand View Research
ページ情報: 英文 150 Pages
納期: 2~10営業日
|
- 全表示
- 概要
- 図表
- 目次
電子データキャプチャ(EDC)システム市場の成長と動向
Grand View Research, Inc.の最新レポートによると、世界の電子データキャプチャ(EDC)システム市場規模は、2030年までに36億3000万米ドルに達し、CAGR14.6%で拡大すると予測されています。市場成長の主な要因は、臨床試験のデジタル化、研究開発投資の増加、eClinicalソリューションの採用、データ収集と品質チェックの標準化の必要性などです。EDCシステムは、情報の管理と分析を改善し、臨床試験の承認までの期間を短縮し、製品の承認手続きに関わる意思決定の迅速化をサポートします。医療機器メーカー、CRO、バイオ製薬会社は、臨床試験データ管理に費やすコストと時間を削減するために、これらのソリューションを採用しています。
COVID-19の大流行により、臨床試験業務が大きな影響を受けました。実際、2021年にオラクルが発表した調査によると、臨床試験活動の12%が一時停止したと推定されています。しかし、このパンデミックは、遠隔診察、EHR、遠隔モニタリング、デジタル同意、臨床データ取得・管理システムなどの臨床試験自動化、運用、データ管理技術の採用を促進しました。製薬・バイオテクノロジー業界、医療機器業界、CROの代表者からなる回答者の約76%が、COVID-19公衆衛生緊急事態が分散型臨床試験手法の使用を促進したと報告しています。COVID以降、臨床試験管理のデジタル化が進む中、EDCシステムに対する需要はさらに高まると予想されます。
また、eClinicalソリューションや、eClinicalソリューションの一部としてのEDCがもたらすメリットも、今後数年間でこのようなソリューションの採用を増加させると予想されます。これらには、出現した所見の医学的解釈の推奨、AIやアナリティクスの利用、データの不一致の解消などが含まれます。EDCシステムを採用するその他の利点としては、高度な統計解析や、臨床試験の規制上の前提条件を満たすために必要な技術的・科学的データの編集の向上などが挙げられます。紙ベースの臨床情報管理に対するEDCサービスの利点に関する認識が高まっていることが、この市場の成長に大きく寄与しています。
さらに、ヘルスケアITサービス業界全体でアウトソーシングの傾向が高まっていることも、医薬品開発業務受託機関がeClinicalソリューション市場に参入する道を開いています。また、分散型臨床試験の増加も、EDCシステム市場で活動する市場関係者に有利な機会を提供しています。クラウドベースのサービスの採用拡大、相互運用性の向上、製品のアップグレードなども、予測期間中の市場成長の要因となっています。また、大手製薬企業間の競争激化により、研究開発予算が拡大し、その結果、臨床試験の数が増加しています。また、特許切れの増加も、創薬・薬剤開発のための臨床試験数の増加の一因となっています。このような背景から、EDCシステムの需要は拡大すると予想されます。
電子データキャプチャ(EDC)システ市場レポートハイライト
電子データキャプチャ(EDC)システム市場は、2022年に12億5000万米ドルとなり、予測期間中にCAGR14.6%で拡大すると予想されています。
データ収集の効率化と全体的なデータ品質の向上へのニーズが、予測期間中の市場成長を促進すると予想される
2022年、コンポーネント別ではサービスが市場を席巻、ソフトウェア分野が最速で成長すると予測EDC導入のためのコンサルテーションサービスや、データのサポート・管理は、EDCシステムの顧客に提供される主要なサービスの一部である
2022年の配信形態別市場では、ウェブ&クラウド型が最大のシェアを占めました。また、今後数年間は最も速く成長すると予想される
ウェブ・クラウドベースのEDCシステムの成長要因としては、リアルタイムのデータ取得、リアルタイムのデータ転送、即時のフィードバック、迅速なデータクリーニング、スケーラビリティなどが挙げられます。
例えば、Castor社は、EDC、ePRO、eCOA、eConsent、eSource、および分散型試験ソリューションを含む、クラウドベースの臨床データ管理プラットフォームを提供しています。これにより、患者、デバイス、臨床医、ウェアラブル、EHRシステムから受け取ったデータの容易な取り込みと統合が可能になります。
また、EDCシステムは、手動でのデータ入力時に発生する可能性のあるエラーを最小限に抑えるのに役立ちます。また、これらのソリューションを使用することで、時間と研究に関連するコストを大幅に削減することができます。このことが、予測期間中の市場成長を促進すると予想されます。
目次
第1章 調査手法と範囲
- 市場セグメンテーションと範囲
- 調査手法
- 情報調達
- 購入したデータベース
- GVRの内部データベース
- 二次情報
- 1次調査
- 1次調査内容
- 情報またはデータ分析
- データ分析モデル
- 市場の策定と検証
- モデルの詳細
- 二次情報一覧
- 目的
第2章 エグゼクティブサマリー
- 電子データキャプチャ(EDC)システム市場の概要
第3章 電子データキャプチャ(EDC)システム市場の変数、動向、範囲
- 市場系列の見通し
- 親市場の見通し
- 関連/補助的な市場の見通し
- 浸透と成長の見通しマッピング、2022年
- 電子データキャプチャ(EDC)システム市場力学
- 市場促進要因分析
- 市場抑制要因分析
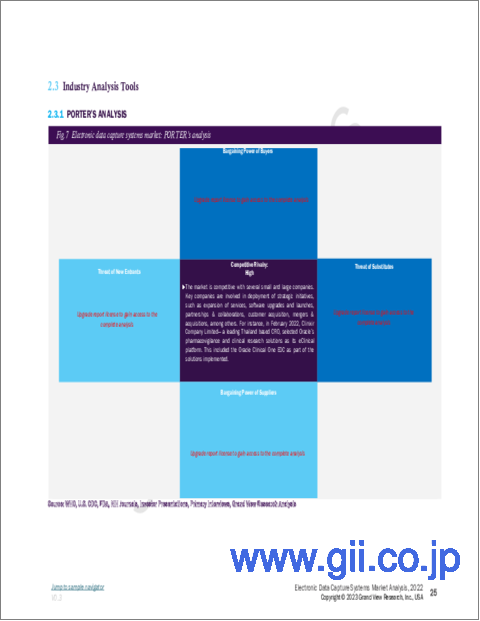
- 電子データキャプチャ(EDC)システム市場分析ツール:ポーター
- サプライヤーの力
- 買い手の交渉力
- 代替の脅威
- 新規参入業者の脅威
- 競争企業間の敵対関係
- 電子データキャプチャ(EDC)システム業界分析-PEST(政治と法律、経済、社会、技術)
- 政治的/法的情勢
- 経済情勢
- 社会情勢
- テクノロジー情勢
第4章 COVID-19の影響分析
- 現在の影響と将来のシナリオ
- 市場関係者への影響
第5章 電子データキャプチャ(EDC)システム市場:セグメント分析、開発段階別、2018年から2030年(百万米ドル)
- 開発段階の市場シェア分析、2022年および2030年
- 電子データキャプチャ(EDC)システム市場、開発段階別、2018年から2030年
- フェーズ I
- フェーズ II
- フェーズ III
- フェーズ IV
第6章 電子データキャプチャ(EDC)システム市場:セグメント分析、配信モード別、2018年から2030年(百万米ドル)
- 配信モードの市場シェア分析、2022年および2030年
- 電子データキャプチャ(EDC)システム市場、配信モード別、2018年から2030年
- Web &クラウドベース
- オンプレミス
第7章 電子データキャプチャ(EDC)システム市場:セグメント分析、コンポーネント別、2018年から2030年(百万米ドル)
- コンポーネント市場シェア分析、2022年および2030年
- 電子データキャプチャ(EDC)システム市場、コンポーネント別、2018年から2030年
- ソフトウェア
- サービス
第8章 電子データキャプチャ(EDC)システム市場:セグメント分析、最終用途別、2018年から2030年(百万米ドル)
- エンドユーザーの市場シェア分析、2022年および2030年
- 電子データキャプチャ(EDC)システム市場、最終用途別、2018年から2030年
- 製薬会社およびバイオテクノロジー会社
- 医療機器会社
- 病院/ヘルスケア提供者
- CRO
- その他
第9章 電子データキャプチャ(EDC)システム市場:地域市場分析2018年から2030年(百万米ドル)
- 定義と範囲
- 地域の変動分析、2022年と2030年
- 地域市場のスナップショット
- 北米
- 米国
- カナダ
- 欧州
- 英国
- ドイツ
- フランス
- イタリア
- スペイン
- アジア太平洋地域
- 日本
- 中国
- インド
- オーストラリア
- 韓国
- ラテンアメリカ
- ブラジル
- メキシコ
- MEA
- 南アフリカ
- サウジアラビア
第10章 電子データキャプチャ(EDC)システム市場-競合分析
- 参加者の概要
- 財務実績
- 製品のベンチマーク
- 参入企業
- 市場のリーダー
- 戦略マッピング
- マーケットプレーヤーのリスト
第11章 電子データキャプチャ(EDC)システム市場-企業プロファイル
- IQVIA Inc.
- 会社概要
- 財務実績
- 製品のベンチマーク
- 戦略的イニシアチブ
- Medidata Solutions, Inc.
- 会社概要
- 財務実績
- 製品のベンチマーク
- 戦略的イニシアチブ
- Oracle
- 会社概要
- 財務実績
- 製品のベンチマーク
- 戦略的イニシアチブ
- DATATRAK International, Inc.
- 会社概要
- 財務実績
- 製品のベンチマーク
- 戦略的イニシアチブ
- Clario
- 会社概要
- 財務実績
- 製品のベンチマーク
- 戦略的イニシアチブ
- Castor
- 会社概要
- 財務実績
- 製品のベンチマーク
- 戦略的イニシアチブ
- Calyx
- 会社概要
- 財務実績
- 製品のベンチマーク
- 戦略的イニシアチブ
- OpenClinica, LLC
- 会社概要
- 財務実績
- 製品のベンチマーク
- 戦略的イニシアチブ
- IBM
- 会社概要
- 財務実績
- 製品のベンチマーク
- 戦略的イニシアチブ
- Veeva Systems
- 会社概要
- 財務実績
- 製品のベンチマーク
- 戦略的イニシアチブ
List of Tables
- TABLE 1 North America Electronic Data Capture (EDC) Systems market revenue, by Development Phase, 2018 - 2030 (USD Million)
- TABLE 2 North America Electronic Data Capture (EDC) Systems market revenue, by Delivery Mode 2018 - 2030 (USD Million)
- TABLE 3 North America Electronic Data Capture (EDC) Systems market revenue, by Component 2018 - 2030 (USD Million)
- TABLE 4 North America Electronic Data Capture (EDC) Systems market revenue, by End-user 2018 - 2030 (USD Million)
- TABLE 5 U.S. Electronic Data Capture (EDC) Systems market revenue, by Development Phase, 2018 - 2030 (USD Million)
- TABLE 6 U.S. Electronic Data Capture (EDC) Systems market revenue, by Delivery Mode 2018 - 2030 (USD Million)
- TABLE 7 U.S. Electronic Data Capture (EDC) Systems market revenue, by Component 2018 - 2030 (USD Million)
- TABLE 8 U.S. Electronic Data Capture (EDC) Systems market revenue, by End-user 2018 - 2030 (USD Million)
- TABLE 9 Canada Electronic Data Capture (EDC) Systems market revenue, by Development Phase, 2018 - 2030 (USD Million)
- TABLE 10 Canada Electronic Data Capture (EDC) Systems market revenue, by Delivery Mode 2018 - 2030 (USD Million)
- TABLE 11 Canada Electronic Data Capture (EDC) Systems market revenue, by Component 2018 - 2030 (USD Million)
- TABLE 12 Canada Electronic Data Capture (EDC) Systems market revenue, by End-user 2018 - 2030 (USD Million)
- TABLE 13 Europe Electronic Data Capture (EDC) Systems market revenue, by Development Phase, 2018 - 2030 (USD Million)
- TABLE 14 Europe Electronic Data Capture (EDC) Systems market revenue, by Delivery Mode 2018 - 2030 (USD Million)
- TABLE 15 Europe Electronic Data Capture (EDC) Systems market revenue, by Component 2018 - 2030 (USD Million)
- TABLE 16 Europe Electronic Data Capture (EDC) Systems market revenue, by End-user 2018 - 2030 (USD Million)
- TABLE 17 Germany Electronic Data Capture (EDC) Systems market revenue, by Development Phase, 2018 - 2030 (USD Million)
- TABLE 18 Germany Electronic Data Capture (EDC) Systems market revenue, by Delivery Mode 2018 - 2030 (USD Million)
- TABLE 19 Germany Electronic Data Capture (EDC) Systems market revenue, by Component 2018 - 2030 (USD Million)
- TABLE 20 Germany Electronic Data Capture (EDC) Systems market revenue, by End-user 2018 - 2030 (USD Million)
- TABLE 21 UK Electronic Data Capture (EDC) Systems market revenue, by Development Phase, 2018 - 2030 (USD Million)
- TABLE 22 UK Electronic Data Capture (EDC) Systems market revenue, by Delivery Mode 2018 - 2030 (USD Million)
- TABLE 23 UK Electronic Data Capture (EDC) Systems market revenue, by Component 2018 - 2030 (USD Million)
- TABLE 24 UK Electronic Data Capture (EDC) Systems market revenue, by End-user 2018 - 2030 (USD Million)
- TABLE 25 France Electronic Data Capture (EDC) Systems market revenue, by Development Phase, 2018 - 2030 (USD Million)
- TABLE 26 France Electronic Data Capture (EDC) Systems market revenue, by Delivery Mode 2018 - 2030 (USD Million)
- TABLE 27 France Electronic Data Capture (EDC) Systems market revenue, by Component 2018 - 2030 (USD Million)
- TABLE 28 France Electronic Data Capture (EDC) Systems market revenue, by End-user 2018 - 2030 (USD Million)
- TABLE 29 Italy Electronic Data Capture (EDC) Systems market revenue, by Development Phase, 2018 - 2030 (USD Million)
- TABLE 30 Italy Electronic Data Capture (EDC) Systems market revenue, by Delivery Mode 2018 - 2030 (USD Million)
- TABLE 31 Italy Electronic Data Capture (EDC) Systems market revenue, by Component 2018 - 2030 (USD Million)
- TABLE 32 Italy Electronic Data Capture (EDC) Systems market revenue, by End-user 2018 - 2030 (USD Million)
- TABLE 33 Spain Electronic Data Capture (EDC) Systems market revenue, by Development Phase, 2018 - 2030 (USD Million)
- TABLE 34 Spain Electronic Data Capture (EDC) Systems market revenue, by Delivery Mode 2018 - 2030 (USD Million)
- TABLE 35 Spain Electronic Data Capture (EDC) Systems market revenue, by Component 2018 - 2030 (USD Million)
- TABLE 36 Spain Electronic Data Capture (EDC) Systems market revenue, by End-user 2018 - 2030 (USD Million)
- TABLE 37 Asia-Pacific Electronic Data Capture (EDC) Systems market revenue, by Development Phase, 2018 - 2030 (USD Million)
- TABLE 38 Asia-Pacific Electronic Data Capture (EDC) Systems market revenue, by Delivery Mode 2018 - 2030 (USD Million)
- TABLE 39 Asia-Pacific Electronic Data Capture (EDC) Systems market revenue, by Component 2018 - 2030 (USD Million)
- TABLE 40 Asia-Pacific Electronic Data Capture (EDC) Systems market revenue, by End-user 2018 - 2030 (USD Million)
- TABLE 41 Japan Electronic Data Capture (EDC) Systems market revenue, by Development Phase, 2018 - 2030 (USD Million)
- TABLE 42 Japan Electronic Data Capture (EDC) Systems market revenue, by Delivery Mode 2018 - 2030 (USD Million)
- TABLE 43 Japan Electronic Data Capture (EDC) Systems market revenue, by Component 2018 - 2030 (USD Million)
- TABLE 44 Japan Electronic Data Capture (EDC) Systems market revenue, by End-user 2018 - 2030 (USD Million)
- TABLE 45 China Electronic Data Capture (EDC) Systems market revenue, by Development Phase, 2018 - 2030 (USD Million)
- TABLE 46 China Electronic Data Capture (EDC) Systems market revenue, by Delivery Mode 2018 - 2030 (USD Million)
- TABLE 47 China Electronic Data Capture (EDC) Systems market revenue, by Component 2018 - 2030 (USD Million)
- TABLE 48 China Electronic Data Capture (EDC) Systems market revenue, by End-user 2018 - 2030 (USD Million)
- TABLE 49 India Electronic Data Capture (EDC) Systems market revenue, by Development Phase, 2018 - 2030 (USD Million)
- TABLE 50 India Electronic Data Capture (EDC) Systems market revenue, by Delivery Mode 2018 - 2030 (USD Million)
- TABLE 51 India Electronic Data Capture (EDC) Systems market revenue, by Component 2018 - 2030 (USD Million)
- TABLE 52 India Electronic Data Capture (EDC) Systems market revenue, by End-user 2018 - 2030 (USD Million)
- TABLE 53 Australia Electronic Data Capture (EDC) Systems market revenue, by Development Phase, 2018 - 2030 (USD Million)
- TABLE 54 Australia Electronic Data Capture (EDC) Systems market revenue, by Delivery Mode 2018 - 2030 (USD Million)
- TABLE 55 Australia Electronic Data Capture (EDC) Systems market revenue, by Component 2018 - 2030 (USD Million)
- TABLE 56 Australia Electronic Data Capture (EDC) Systems market revenue, by End-user 2018 - 2030 (USD Million)
- TABLE 57 South Korea Electronic Data Capture (EDC) Systems market revenue, by Development Phase, 2018 - 2030 (USD Million)
- TABLE 58 South Korea Electronic Data Capture (EDC) Systems market revenue, by Delivery Mode 2018 - 2030 (USD Million)
- TABLE 59 South Korea Electronic Data Capture (EDC) Systems market revenue, by Component 2018 - 2030 (USD Million)
- TABLE 60 South Korea Electronic Data Capture (EDC) Systems market revenue, by End-user 2018 - 2030 (USD Million)
- TABLE 61 Latin America Electronic Data Capture (EDC) Systems market revenue, by Development Phase, 2018 - 2030 (USD Million)
- TABLE 62 Latin America Electronic Data Capture (EDC) Systems market revenue, by Delivery Mode 2018 - 2030 (USD Million)
- TABLE 63 Latin America Electronic Data Capture (EDC) Systems market revenue, by Component 2018 - 2030 (USD Million)
- TABLE 64 Latin America Electronic Data Capture (EDC) Systems market revenue, by End-user 2018 - 2030 (USD Million)
- TABLE 65 Brazil Electronic Data Capture (EDC) Systems market revenue, by Development Phase, 2018 - 2030 (USD Million)
- TABLE 66 Brazil Electronic Data Capture (EDC) Systems market revenue, by Delivery Mode 2018 - 2030 (USD Million)
- TABLE 67 Brazil Electronic Data Capture (EDC) Systems market revenue, by Component 2018 - 2030 (USD Million)
- TABLE 68 Brazil Electronic Data Capture (EDC) Systems market revenue, by End-user 2018 - 2030 (USD Million)
- TABLE 69 Mexico Electronic Data Capture (EDC) Systems market revenue, by Development Phase, 2018 - 2030 (USD Million)
- TABLE 70 Mexico Electronic Data Capture (EDC) Systems market revenue, by Delivery Mode 2018 - 2030 (USD Million)
- TABLE 71 Mexico Electronic Data Capture (EDC) Systems market revenue, by Component 2018 - 2030 (USD Million)
- TABLE 72 Mexico Electronic Data Capture (EDC) Systems market revenue, by End-user 2018 - 2030 (USD Million)
- TABLE 73 Middle East & Africa Electronic Data Capture (EDC) Systems market revenue, by Development Phase, 2018 - 2030 (USD Million)
- TABLE 74 Middle East & Africa Electronic Data Capture (EDC) Systems market revenue, by Delivery Mode 2018 - 2030 (USD Million)
- TABLE 75 Middle East & Africa Electronic Data Capture (EDC) Systems market revenue, by Component 2018 - 2030 (USD Million)
- TABLE 76 Middle East & Africa Electronic Data Capture (EDC) Systems market revenue, by End-user 2018 - 2030 (USD Million)
- TABLE 77 Saudi Arabia Electronic Data Capture (EDC) Systems market revenue, by Development Phase, 2018 - 2030 (USD Million)
- TABLE 78 Saudi Arabia Electronic Data Capture (EDC) Systems market revenue, by Delivery Mode 2018 - 2030 (USD Million)
- TABLE 79 Saudi Arabia Electronic Data Capture (EDC) Systems market revenue, by Component 2018 - 2030 (USD Million)
- TABLE 80 Saudi Arabia Electronic Data Capture (EDC) Systems market revenue, by End-user 2018 - 2030 (USD Million)
- TABLE 81 South Africa Electronic Data Capture (EDC) Systems market revenue, by Development Phase, 2018 - 2030 (USD Million)
- TABLE 82 South Africa Electronic Data Capture (EDC) Systems market revenue, by Delivery Mode 2018 - 2030 (USD Million)
- TABLE 83 South Africa Electronic Data Capture (EDC) Systems market revenue, by Component 2018 - 2030 (USD Million)
- TABLE 84 South Africa Electronic Data Capture (EDC) Systems market revenue, by End-user 2018 - 2030 (USD Million)
- TABLE 85 North America Electronic Data Capture (EDC) Systems market revenue, by Country 2018 - 2030 (USD Million)
- TABLE 86 Europe Electronic Data Capture (EDC) Systems market revenue, by Country 2018 - 2030 (USD Million)
- TABLE 87 Latin America Electronic Data Capture (EDC) Systems market revenue, by Country 2018 - 2030 (USD Million)
- TABLE 88 Asia Pacific Electronic Data Capture (EDC) Systems market revenue, by Country 2018 - 2030 (USD Million)
- TABLE 89 MEA Electronic Data Capture (EDC) Systems market revenue, by Country 2018 - 2030 (USD Million)
- TABLE 90 Global Electronic Data Capture (EDC) Systems market revenue, by Region 2018 - 2030 (USD Million)
- TABLE 91 Global Electronic Data Capture (EDC) Systems market revenue, by Development Phase, 2018 - 2030 (USD Million)
- TABLE 92 Global Electronic Data Capture (EDC) Systems market revenue, by Delivery Mode 2018 - 2030 (USD Million)
- TABLE 93 Global Electronic Data Capture (EDC) Systems market revenue, by Component 2018 - 2030 (USD Million)
- TABLE 94 Global Electronic Data Capture (EDC) Systems market revenue, by End-user 2018 - 2030 (USD Million)
- TABLE 95 List of Secondary Sources
- TABLE 96 List of Key Companies
List of Figures
- FIG. 1 Market research process
- FIG. 2 Data triangulation techniques
- FIG. 3 Primary research pattern
- FIG. 4 Market research approaches
- FIG. 5 Value-chain-based sizing & forecasting
- FIG. 6 QFD modeling for market share assessment
- FIG. 7 Market formulation & validation
- FIG. 8 Commodity workflow analysis
- FIG. 9 Electronic Data Capture (EDC) Systems market snapshot, 2022 (USD Million)
- FIG. 10 Electronic Data Capture (EDC) Systems market segmentation and scope
- FIG. 11 Parent market outlook
- FIG. 12 Ancillary market outlook
- FIG. 13 Penetration & growth prospect mapping, 2022
- FIG. 14 Electronic Data Capture (EDC) Systems market dynamics analysis
- FIG. 15 Electronic Data Capture (EDC) Systems market driver analysis
- FIG. 16 Electronic Data Capture (EDC) Systems market restraint analysis
- FIG. 17 COVID-19 disease prevalence
- FIG. 18 Electronic Data Capture (EDC) Systems market: Development Phase market share analysis, 2022 & 2030
- FIG. 19 Electronic Data Capture (EDC) Systems market Development Phase outlook: Key takeaways
- FIG. 20 Phase I market, 2018 - 2030 (USD Million)
- FIG. 21 Phase II market, 2018 - 2030 (USD Million)
- FIG. 22 Phase III market, 2018 - 2030 (USD Million)
- FIG. 23 Phase IV market, 2018 - 2030 (USD Million)
- FIG. 24 Electronic Data Capture (EDC) Systems market: Delivery Mode market share analysis, 2022 & 2030
- FIG. 25 Electronic Data Capture (EDC) Systems market Delivery Mode outlook: Key takeaways
- FIG. 26 Web & Cloud-based market, 2018 - 2030 (USD Million)
- FIG. 27 On-premise market, 2018 - 2030 (USD Million)
- FIG. 28 Electronic Data Capture (EDC) Systems market: Component market share analysis, 2022 & 2030
- FIG. 29 Electronic Data Capture (EDC) Systems market Component outlook: Key takeaways
- FIG. 30 Software market, 2018 - 2030 (USD Million)
- FIG. 31 Services market, 2018 - 2030 (USD Million)
- FIG. 32 Electronic Data Capture (EDC) Systems market: End-user market share analysis, 2022 & 2030
- FIG. 33 Electronic Data Capture (EDC) Systems market End-user outlook: Key takeaways
- FIG. 34 Pharmaceutical and Biotechnology Firms market, 2018 - 2030 (USD Million)
- FIG. 35 Medical Device Firms market, 2018 - 2030 (USD Million)
- FIG. 36 Hospitals/Healthcare providers market, 2018 - 2030 (USD Million)
- FIG. 37 CROs market, 2018 - 2030 (USD Million)
- FIG. 38 Other End-users market, 2018 - 2030 (USD Million)
- FIG. 39 Electronic Data Capture (EDC) Systems market: Regional movement analysis 2022 & 2030
- FIG. 40 Electronic Data Capture (EDC) Systems market regional outlook: Key takeaways
- FIG. 41 North America Electronic Data Capture (EDC) Systems market share, by country, 2022
- FIG. 42 North America Electronic Data Capture (EDC) Systems market, 2018 - 2030 (USD Million)
- FIG. 43 U.S. Electronic Data Capture (EDC) Systems market, 2018 - 2030 (USD Million)
- FIG. 44 Canada Electronic Data Capture (EDC) Systems market, 2018 - 2030 (USD Million)
- FIG. 45 Europe Electronic Data Capture (EDC) Systems market share, by country, 2022
- FIG. 46 Europe Electronic Data Capture (EDC) Systems market, 2018 - 2030 (USD Million)
- FIG. 47 Germany Electronic Data Capture (EDC) Systems market, 2018 - 2030 (USD Million)
- FIG. 48 France Electronic Data Capture (EDC) Systems market, 2018 - 2030 (USD Million)
- FIG. 49 UK Electronic Data Capture (EDC) Systems market, 2018 - 2030 (USD Million)
- FIG. 50 Italy Electronic Data Capture (EDC) Systems market, 2018 - 2030 (USD Million)
- FIG. 51 Spain Electronic Data Capture (EDC) Systems market, 2018 - 2030 (USD Million)
- FIG. 52 Asia Pacific Electronic Data Capture (EDC) Systems market share, by country, 2022
- FIG. 53 Asia Pacific Electronic Data Capture (EDC) Systems market, 2018 - 2030 (USD Million)
- FIG. 54 Japan Electronic Data Capture (EDC) Systems market, 2018 - 2030 (USD Million)
- FIG. 55 China Electronic Data Capture (EDC) Systems market, 2018 - 2030 (USD Million)
- FIG. 56 India Electronic Data Capture (EDC) Systems market, 2018 - 2030 (USD Million)
- FIG. 57 Australia Electronic Data Capture (EDC) Systems market, 2018 - 2030 (USD Million)
- FIG. 58 South Korea Electronic Data Capture (EDC) Systems market, 2018 - 2030 (USD Million)
- FIG. 59 Latin America Electronic Data Capture (EDC) Systems market share, by country, 2022
- FIG. 60 Latin America Electronic Data Capture (EDC) Systems market, 2018 - 2030 (USD Million)
- FIG. 61 Brazil Electronic Data Capture (EDC) Systems market, 2018 - 2030 (USD Million)
- FIG. 62 Mexico Electronic Data Capture (EDC) Systems market, 2018 - 2030 (USD Million)
- FIG. 63 MEA Electronic Data Capture (EDC) Systems market share, by country, 2022
- FIG. 64 MEA Electronic Data Capture (EDC) Systems market, 2018 - 2030 (USD Million)
- FIG. 65 South Africa Electronic Data Capture (EDC) Systems market, 2018 - 2030 (USD Million)
- FIG. 66 Saudi Arabia Electronic Data Capture (EDC) Systems market, 2018 - 2030 (USD Million)
- FIG. 67 Market participant categorization
- FIG. 68 Company market position analysis
Electronic Data Capture Systems Market Growth & Trends:
The global electronic data capture systems market size is anticipated to reach USD 3.63 billion by 2030, expanding at a CAGR of 14.6%, according to a new report by Grand View Research, Inc. The key factors driving the market growth include the digitalization of clinical trials, increasing R&D investments, adoption of eClinical solutions, and the need to standardize data collection and quality checks. EDC systems improve information management and analysis, accelerate the timeline for clinical trial approval, and support faster decision-making pertaining to product approval procedures. Medical device manufacturers, CROs, and biopharmaceutical companies are adopting these solutions to save the cost and time spent on clinical trial data management.
Clinical trial operations were significantly impacted due to the COVID-19 pandemic. In fact, an estimated 12% of clinical trial activity was paused according to a survey published by Oracle in 2021. However, the pandemic also catalyzed the adoption of clinical trials automation, operation, and data management technologies such as teleconsultations, EHR, remote monitoring, digital consent, and clinical data capture & management systems. Around 76% of the respondents comprising representatives from the pharma & biotech industry, the medical devices industry, and CROs reported that the COVID-19 public health emergency accelerated their usage of decentralized clinical trial methods. This is estimated to fuel the demand for EDC systems as the management of clinical trials continues to undergo digitalization post-COVID.
The associated benefits of an eClinical solution, or EDC as part of an eClinical solution, are also expected to increase the adoption of such solutions in the coming years. These include recommendations on the medical interpretation of emergent findings, the use of AI and analytics, and the elimination of data discrepancies. The other benefits of adopting EDC systems include advanced statistical analysis and improved compilation of technical & scientific data required for the fulfillment of regulatory prerequisites of clinical trials. The growing awareness pertaining to the advantages of EDC services over paper-based clinical information management is a major factor contributing to the growth of this market.
Moreover, the rising trend of outsourcing across the healthcare IT services industry creates more avenues for contract research organizations to enter into the eClinical solutions marketplace. The increasing number of decentralized clinical trials also presents lucrative opportunities for market players active in the EDC systems market. Growing adoption of cloud-based services, rising interoperability, and product upgrades are other factors attributing to the market growth over the forecast period. In addition, increasing competition amongst the major pharmaceutical companies is urging them to expand their R&D budgets, thus resulting in a greater number of clinical studies. Also, the increasing number of patent expirations is another factor contributing to the increase in the number of clinical studies for drug development and discovery. This is anticipated to propel the demand for EDC systems.
Electronic Data Capture Systems Market Report Highlights:
- The Electronic Data Capture (EDC) Systems market was valued at USD 1.25 billion in 2022 and is expected to expand at a CAGR of 14.6% during the forecast period
- The need to increase the efficiency of data collection and enhance the overall data quality is expected to drive market growth during the forecast period
- Services dominated the market by component in 2022, while the software segment is estimated to grow the fastest. Consultation services for EDC installation and data support and management are some of the key services offered to EDC system customers
- The web & cloud-based segment held the largest share of the market by delivery mode in 2022. It is also expected to grow the fastest in the coming years
- Factors attributing to the growth of web & cloud-based EDC systems include real-time data capture, real-time data transfer, immediate feedback, faster data cleaning, and scalability
- Castor, for example, offers a cloud-based clinical data management platform that includes EDC, ePRO, eCOA, eConsent, eSource, and decentralized trial solutions. This facilitates the easy capture and integration of data received from patients, devices, clinicians, wearables, and EHR systems
- EDC systems also help in minimizing the errors that may occur during manual data entry. Also, the use of these solutions enables considerable savings of time and research-associated costs. This is expected to drive market growth during the forecast period
Table of Contents
Chapter 1 Methodology and Scope
- 1.1 Market Segmentation and Scope
- 1.2 Research Methodology
- 1.3 Information procurement
- 1.3.1 Purchased database
- 1.3.2 GVR's internal database
- 1.3.3 Secondary sources
- 1.3.4 Primary research
- 1.3.5 Details of primary research
- 1.4 Information or Data Analysis
- 1.4.1 Data analysis models
- 1.5 Market Formulation & Validation
- 1.6 Model Details
- 1.7 List of Secondary Sources
- 1.8 Objectives
Chapter 2 Executive Summary
- 2.1 Electronic Data Capture (EDC) Systems Market Summary
Chapter 3 Electronic Data Capture (EDC) Systems Market Variables, Trends & Scope
- 3.1 Market Lineage Outlook
- 3.1.1. Parent Market Outlook
- 3.1.2. Related/Ancillary Market Outlook
- 3.2. Penetration & Growth Prospect Mapping, 2022
- 3.3 Electronic Data Capture (EDC) Systems Market Dynamics
- 3.3.1 Market driver analysis
- 3.3.2 Market restraint analysis
- 3.4 Electronic Data Capture (EDC) Systems Market Analysis Tools: Porters
- 3.4.1 Supplier Power
- 3.4.2. Buyer Power
- 3.4.3. Substitution Threat
- 3.4.4. Threat of New Entrants
- 3.4.5. Competitive Rivalry
- 3.5 Electronic Data Capture (EDC) Systems Industry Analysis - PEST (Political & Legal, Economic, Social, and Technological)
- 3.5.1 Political/Legal Landscape
- 3.5.2 Economic Landscape
- 3.5.3 Social Landscape
- 3.5.4 Technology Landscape
Chapter 4 COVID-19 Impact Analysis
- 4.1 Current Impact & Future Scenario
- 4.2. Impact on Market Players
Chapter 5 Electronic Data Capture (EDC) Systems Market: Segment Analysis, By Development Phase, 2018 - 2030 (USD Million)
- 5.1 Development Phase Market Share Analysis, 2022 & 2030
- 5.2 Electronic Data Capture (EDC) Systems market, by Development Phase, 2018 to 2030
- 5.3 Phase I
- 5.3.1 Phase I market, 2018 - 2030 (USD Million)
- 5.4 Phase II
- 5.4.1 Phase II market, 2018 - 2030 (USD Million)
- 5.5 Phase III
- 5.5.1 Phase III market, 2018 - 2030 (USD Million)
- 5.6 Phase IV
- 5.6.1 Phase IV market, 2018 - 2030 (USD Million)
Chapter 6 Electronic Data Capture (EDC) Systems Market: Segment Analysis, By Delivery Mode, 2018 - 2030 (USD Million)
- 6.1 Delivery Mode Market Share Analysis, 2022 & 2030
- 6.2 Electronic Data Capture (EDC) Systems market, by Delivery Mode, 2018 to 2030
- 6.3 Web & Cloud-based
- 6.3.1 Web & Cloud-based market, 2018 - 2030 (USD Million)
- 6.4 On-premise
- 6.4.1 On-premise market, 2018 - 2030 (USD Million)
Chapter 7 Electronic Data Capture (EDC) Systems Market: Segment Analysis, By Component, 2018 - 2030 (USD Million)
- 7.1 Component Market Share Analysis, 2022 & 2030
- 7.2 Electronic Data Capture (EDC) Systems Market, by Component, 2018 to 2030
- 7.3 Software
- 7.3.1 Software market, 2018 - 2030 (USD Million)
- 7.4 Services
- 7.4.1 Services market, 2018 - 2030 (USD Million)
Chapter 8 Electronic Data Capture (EDC) Systems Market: Segment Analysis, By End-user, 2018 - 2030 (USD Million)
- 8.1 End-user Market Share Analysis, 2022 & 2030
- 8.2 Electronic Data Capture (EDC) Systems Market, by End-user, 2018 to 2030
- 8.3 Pharmaceutical and Biotechnology Firms
- 8.3.1 Pharmaceutical and Biotechnology Firms market, 2018 - 2030 (USD Million)
- 8.4 Medical Device Firms
- 8.4.1 Medical Device Firms market, 2018 - 2030 (USD Million)
- 8.5 Hospitals/Healthcare providers
- 8.5.1 Hospitals/Healthcare providers market, 2018 - 2030 (USD Million)
- 8.6 CROs
- 8.6.1 CROs market, 2018 - 2030 (USD Million)
- 8.7 Others
- 8.7.1 Others market, 2018 - 2030 (USD Million)
Chapter 9 Electronic Data Capture (EDC) Systems Market: Regional Market Analysis 2018 - 2030 (USD Million)
- 9.1 Definition & Scope
- 9.2 Regional Movement Analysis, 2022 & 2030
- 9.3 Regional Market Snapshot
- 9.4 North America
- 9.4.1 North America Electronic Data Capture (EDC) Systems Market, 2018 - 2030 (USD Million)
- 9.4.2. U.S.
- 9.4.2.1 U.S. Electronic Data Capture (EDC) Systems Market, 2018 - 2030 (USD Million)
- 9.4.3 Canada
- 9.4.3.1 Canada Electronic Data Capture (EDC) Systems Market, 2018 - 2030 (USD Million)
- 9.5 Europe
- 9.5.1 Europe Electronic Data Capture (EDC) Systems Market, 2018 - 2030 (USD Million)
- 9.5.2 UK
- 9.5.2.1 UK Electronic Data Capture (EDC) Systems Market, 2018 - 2030 (USD Million)
- 9.5.3 Germany
- 9.5.3.1 Germany Electronic Data Capture (EDC) Systems Market, 2018 - 2030 (USD Million)
- 9.5.4 France
- 9.5.4.1 France Electronic Data Capture (EDC) Systems Market, 2018 - 2030 (USD Million)
- 9.5.5 Italy
- 9.5.5.1 Italy Electronic Data Capture (EDC) Systems Market, 2018 - 2030 (USD Million)
- 9.5.6 Spain
- 9.5.6.1 Spain Electronic Data Capture (EDC) Systems Market, 2018 - 2030 (USD Million)
- 9.6 Asia Pacific
- 9.6.1 Asia Pacific Electronic Data Capture (EDC) Systems market, 2018 - 2030 (USD Million)
- 9.6.2 Japan
- 9.6.2.1 Japan Electronic Data Capture (EDC) Systems Market, 2018 - 2030 (USD Million)
- 9.6.3 China
- 9.6.3.1 China Electronic Data Capture (EDC) Systems Market, 2018 - 2030 (USD Million)
- 9.6.4 India
- 9.6.4.1 India Electronic Data Capture (EDC) Systems Market, 2018 - 2030 (USD Million)
- 9.6.5 Australia
- 9.6.5.1 Australia Electronic Data Capture (EDC) Systems Market, 2018 - 2030 (USD Million)
- 9.6.6 South Korea
- 9.6.6.1 South Korea Electronic Data Capture (EDC) Systems Market, 2018 - 2030 (USD Million)
- 9.7 Latin America
- 9.7.1 Latin America Electronic Data Capture (EDC) Systems Market, 2018 - 2030 (USD Million)
- 9.7.2 Brazil
- 9.7.2.1 Brazil Electronic Data Capture (EDC) Systems Market, 2018 - 2030 (USD Million)
- 9.7.3 Mexico
- 9.7.3.1 Mexico Electronic Data Capture (EDC) Systems Market, 2018 - 2030 (USD Million)
- 9.8 MEA
- 9.8.1 MEA Electronic Data Capture (EDC) Systems Market, 2018 - 2030 (USD Million)
- 9.8.2 South Africa
- 9.8.2.1 South Africa Electronic Data Capture (EDC) Systems Market, 2018 - 2030 (USD Million)
- 9.8.3 Saudi Arabia
- 9.8.3.1 Saudi Arabia Electronic Data Capture (EDC) Systems Market, 2018 - 2030 (USD Million)
Chapter 10 Electronic Data Capture (EDC) Systems Market - Competitive Analysis
- 10.1 Participant's Overview
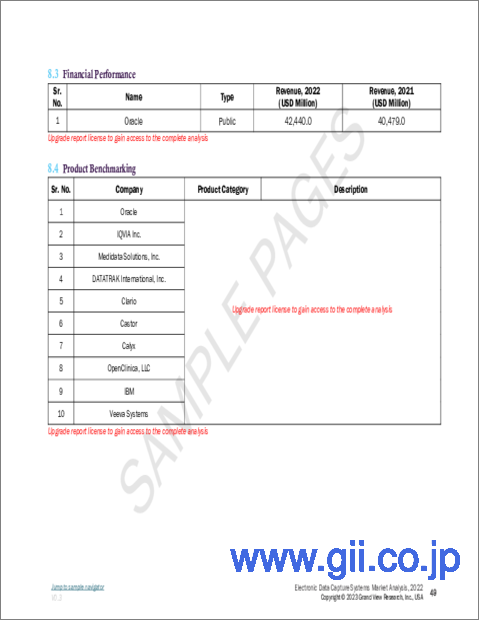
- 10.2 Financial Performance
- 10.3 Product Benchmarking
- 10.4. Participant Categorization
- 10.4.1 Market Leaders
- 10.4.2 Strategy Mapping
- 10.5. List of Market Players
Chapter 11 Electronic Data Capture (EDC) Systems Market - Company Profiles
- 11.1 IQVIA Inc.
- 11.1.1 Company overview
- 11.1.2 Financial performance
- 11.1.3 Product benchmarking
- 11.1.4 Strategic initiatives
- 11.2 Medidata Solutions, Inc.
- 11.2.1 Company overview
- 11.2.2 Financial performance
- 11.2.3 Product benchmarking
- 11.2.4 Strategic initiatives
- 11.3 Oracle
- 11.3.1 Company overview
- 11.3.2 Financial performance
- 11.3.3 Product benchmarking
- 11.3.4 Strategic initiatives
- 11.4 DATATRAK International, Inc.
- 11.4.1 Company overview
- 11.4.2 Financial performance
- 11.4.3 Product benchmarking
- 11.4.4 Strategic initiatives
- 11.5 Clario
- 11.5.1 Company overview
- 11.5.2 Financial performance
- 11.5.3 Product benchmarking
- 11.5.4 Strategic initiatives
- 11.6 Castor
- 11.6.1 Company overview
- 11.6.2 Financial performance
- 11.6.3 Product benchmarking
- 11.6.4 Strategic initiatives
- 11.7 Calyx
- 11.7.1 Company overview
- 11.7.2 Financial performance
- 11.7.3 Product benchmarking
- 11.7.4 Strategic initiatives
- 11.8 OpenClinica, LLC
- 11.8.1 Company overview
- 11.8.2 Financial performance
- 11.8.3 Product benchmarking
- 11.8.4 Strategic initiatives
- 11.9 IBM
- 11.9.1 Company overview
- 11.9.2 Financial performance
- 11.9.3 Product benchmarking
- 11.9.4 Strategic initiatives
- 11.10 Veeva Systems
- 11.10.1 Company overview
- 11.10.2 Financial performance
- 11.10.3 Product benchmarking
- 11.10.4 Strategic initiatives