|
|
市場調査レポート
商品コード
1178651
ネットワーク機器市場の規模、シェア、動向分析レポート:コンポーネント別(ハードウェア、ソフトウェア、サービス)、接続性別(2G/3G、4G LTE、5G)、ネットワークタイプ別、最終用途別、地域別、セグメント別予測、2022年~2030年Network Equipment Market Size, Share & Trends Analysis Report By Component (Hardware, Software, Services), By Connectivity (2G/3G, 4G LTE, 5G), By Network Type, By End-user, By Region, And Segment Forecasts, 2022 - 2030 |
||||||
|
|
|||||||
|
● お客様のご希望に応じて、既存データの加工や未掲載情報(例:国別セグメント)の追加などの対応が可能です。 詳細はお問い合わせください。 |
|||||||


| ネットワーク機器市場の規模、シェア、動向分析レポート:コンポーネント別(ハードウェア、ソフトウェア、サービス)、接続性別(2G/3G、4G LTE、5G)、ネットワークタイプ別、最終用途別、地域別、セグメント別予測、2022年~2030年 |
|
出版日: 2022年12月22日
発行: Grand View Research
ページ情報: 英文 190 Pages
納期: 2~10営業日
|
- 全表示
- 概要
- 図表
- 目次
ネットワーク機器市場の成長と動向
Grand View Research, Inc.の調査によると、ネットワーク機器の世界市場規模は、2022年から2030年にかけてCAGR 3.5%で成長し、2030年には1905億3000万米ドルに達すると予測されています。ネットワーク機器は、ネットワークインフラの設定に使用されるコンポーネントのセットで構成されています。同市場は、ネットワーク機器のハードウェア、ソフトウェア、関連サービスで構成されています。
商業、消費者、産業インフラにまたがるモノのインターネット(IoT)対応デバイスの展開の高まりは、ネットワーク機器の需要を促進する主要因の1つです。また、通信事業者やサービスプロバイダーによるネットワーク機器のインフラやソリューションへの投資の増加も、業界の拡大に拍車をかけています。例えば、シスコシステムズ社は2022年1月、産業用ネットワーク内の重要なインフラを保護しアップグレードするために、エンタープライズグレードのスイッチング機能を拡張することを発表しました。このような進歩も、市場の成長を後押ししています。
さらに、新技術の普及により、次世代5Gネットワーク機器やソフトウェアに投資する企業も出てきています。5G対応のネットワークインフラやソフトウェアアプリケーションは、消費者への迅速なサービスや支援を保証することで、企業に競争上の優位性をもたらす可能性があります。5G対応ネットワークは、企業の業務効率の向上と顧客全体の拡大を支援します。5G技術の登場、インターネット接続の普及拡大、スマートデバイスの採用拡大、技術の進歩などの要因も、ネットワーク機器デバイスやインフラの需要にプラスの影響を及ぼしています。遠隔学習やリモートワークの文化は、5Gネットワークサービスの展開を後押しし、5Gサービスの採用をさらに推進しました。
ハードウェアコンポーネントのうち、RAN機器は2021年に市場を独占しました。これは、5Gネットワークの展開の増加に伴い、RAN機器の採用が進んでいるためです。RANは、プライベート4Gまたはプライベート5Gを利用するネットワーク機器プロバイダやモバイルネットワーク事業者が、公衆モバイルネットワーク内でネットワーク利用を分割するために、個々の企業に容量を割り当てるネットワークスライシングソリューションを提供することを可能にします。市場参加者は、Telefonaktiebolaget LM Ericsson、Huawei Technologies Co.Ltd.、Nokia Corporation、Cisco Systems, Inc.などは、プライベート5Gネットワーク向けのRANソリューションの提供に注力し、顧客が既存のレガシーネットワークインフラを次世代5Gネットワークに変換できるように支援しています。
ネットワーク機器市場のレポートハイライト
ハードウェア分野は、予測期間中に急速な成長を遂げると予想されます。世界中のエンドユーザーによるRANやコアネットワークなどのハードウェアの採用が進んでいることが、同セグメントの成長を牽引すると予測されます。
5G分野は、予測期間中に最も速い成長を記録すると予想されます。この成長は、世界中でネットワークとデータ接続を改善するための5Gサービスに対する需要が増加していることに起因しています。
2021年には、公共ネットワークセグメントが市場を独占しました。このセグメントの優位性は、公共部門全体で改善されたネットワークサービスに対する需要が増加していることに起因することができる
企業向けセグメントは、予測期間中に最も速い成長を記録すると予測されています。これは、ヘルスケア、公共安全、BFSIなどのさまざまな垂直分野で、プライベートインフラ向けのネットワーク機器の展開が増加していることに起因している
アジア太平洋地域は、予測期間中に最も速い成長を遂げると予測されています。同地域では、5G対応サービスへの需要が高まっており、同地域の市場成長を促進する上で重要な役割を果たすと予測されます。
目次
第1章 調査手法と範囲
- 調査手法
- 調査範囲と前提
- データソースのリスト
- 略語一覧
第2章 エグゼクティブサマリー
- 市場の洞察
- 市場のスナップショット
- セグメントの洞察
第3章 市場変数、動向、および範囲の見通し
- 市場セグメンテーション
- ネットワーク機器の市場規模と成長見通し
- ネットワーク機器市場-バリューチェーン分析
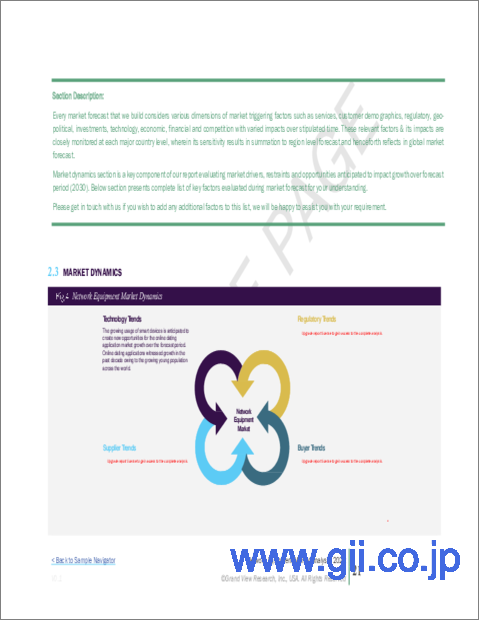
- ネットワーク機器市場力学
- 市場促進要因分析
- 市場抑制要因分析
- 市場機会分析
- ネットワーク機器の普及と成長の見通しのマッピング
- ネットワーク機器市場- ポーターのファイブフォース分析
- サプライヤーの力
- 買い手の交渉力
- 代替の脅威
- 新規参入者からの脅威
- 競争企業間の敵対関係
- ネットワーク機器市場-PEST分析
- 政治情勢
- 経済情勢
- 社会情勢
- テクノロジー情勢
- COVID-19影響分析
第4章 ネットワーク機器市場コンポーネントの見通し
- ネットワーク機器市場、コンポーネント分析と市場シェア別、2021年と2030年
- ハードウェア
- RAN
- コアネットワーク
- 固定アクセス
- その他
- ソフトウェア
- インフラストラクチャソフトウェア
- OSS/BSS
- その他
- サービス
- プロフェッショナルサービス
- アドバイザリー/コンサルティング
- 設計/最適化
- ツールと自動化
- 安全
- 導入サービス
- テスト
- インストール
- 統合
- マネージドサービス
- ネットワークのパフォーマンスと管理
- アプリ/データ管理
- RAN運用サポート
- コア運用サポート
- 安全
- トレーニング
- プロフェッショナルサービス
第5章 ネットワーク機器市場のコネクティビティの見通し
- ネットワーク機器市場、接続性分析と市場シェア別、2021年と2030年
- 2G/3G
- 4G LTE
- 5G
第6章 ネットワーク機器市場ネットワークタイプの見通し
- ネットワーク機器市場、ネットワークタイプ別分析および市場シェア、2021年および2030年
- パブリックネットワーク
- プライベートネットワーク
第7章 ネットワーク機器市場のエンドユーザーの見通し
- ネットワーク機器市場、エンドユーザー分析および市場シェア別、2021年および2030年
- 通信事業者
- 企業
- 公共安全
- ヘルスケア
- 小売およびeコマース
- 銀行、金融サービス、保険
- 政府と防衛
- 製造業
- その他
第8章 ネットワーク機器市場:地域推定・動向分析
- 2021年と2030年の地域別ネットワーク機器市場シェア
- 北米
- 米国
- カナダ
- 欧州
- ドイツ
- 英国
- フランス
- アジア太平洋地域
- 中国
- 日本
- インド
- ラテンアメリカ
- ブラジル
- メキシコ
- 中東とアフリカ
第9章 競合分析
- 主要な市場参入企業別最近の動向と影響分析
- 企業/競合の分類(主要なイノベーター、マーケットリーダー、新興企業、ニッチプレイヤー)
- ベンダー情勢
- 主要企業の市場シェア分析、2021年
- 企業分析ツール
- 市況分析
- 競合ダッシュボード分析
第10章 競合情勢
- 企業プロファイル
- Telefonaktiebolaget LM Ericsson
- 会社概要
- 財務実績
- タイプのベンチマーク
- 戦略的イニシアチブ
- Nokia Corporation
- 会社概要
- 財務実績
- タイプのベンチマーク
- 戦略的イニシアチブ
- Samsung Electronics Co. Ltd
- 会社概要
- 財務実績
- タイプのベンチマーク
- 戦略的イニシアチブ
- ZTE Corporation
- 会社概要
- 財務実績
- タイプのベンチマーク
- 戦略的イニシアチブ
- Juniper Networks Inc
- 会社概要
- 財務実績
- タイプのベンチマーク
- 戦略的イニシアチブ
- Huawei Technologies Co. Ltd
- 会社概要
- 財務実績
- タイプのベンチマーク
- 戦略的イニシアチブ
- Cisco Systems Inc
- 会社概要
- 財務実績
- タイプのベンチマーク
- 戦略的イニシアチブ
- Hewlett Packard Enterprise Development LP.
- 会社概要
- 財務実績
- タイプのベンチマーク
- 戦略的イニシアチブ
- Broadcom.
- 会社概要
- 財務実績
- タイプのベンチマーク
- 戦略的イニシアチブ
- ALE International(Alcatel-Lucent)
- 会社概要
- 財務実績
- タイプのベンチマーク
- 戦略的イニシアチブ
- Check Point Software Technologies Ltd.
- 会社概要
- 財務実績
- タイプのベンチマーク
- 戦略的イニシアチブ
List of Tables
- Table 1 Global Network Equipment market, 2017 - 2030 (USD Million)
- Table 2 Global Network Equipment market, by region, 2017 - 2030 (USD Million)
- Table 3 Global Network Equipment market, by component, 2017 - 2030 (USD Million)
- Table 4 Global Network Equipment market, by hardware 2017 - 2030 (USD Million)
- Table 5 RAN Network Equipment market, by region, 2017 - 2030 (USD Million)
- Table 6 Core Network Equipment market, by region, 2017 - 2030 (USD Million)
- Table 7 Fixed Access Network Equipment market, by region, 2017 - 2030 (USD Million)
- Table 8 Others Network Equipment market, by region, 2017 - 2030 (USD Million)
- Table 9 Global Network Equipment market, by software 2017 - 2030 (USD Million)
- Table 10 Infrastructure Software Network Equipment market, by region, 2017 - 2030 (USD Million)
- Table 11 OSS/BSS Software Network Equipment market, by region, 2017 - 2030 (USD Million)
- Table 12 Others Software Network Equipment market, by region, 2017 - 2030 (USD Million)
- Table 13 Global Network Equipment market, by services 2017 - 2030 (USD Million)
- Table 14 Professional Services Network Equipment market, by services 2017 - 2030 (USD Million)
- Table 15 Advisory/Consulting Network Equipment market, by region, 2017 - 2030 (USD Million)
- Table 16 Design/Optimization Network Equipment market, by region, 2017 - 2030 (USD Million)
- Table 17 Tools & Optimization Network Equipment market, by region, 2017 - 2030 (USD Million)
- Table 18 Security Network Equipment market, by region, 2017 - 2030 (USD Million)
- Table 19 Deployment Services Network Equipment market, by services 2017 - 2030 (USD Million)
- Table 20 Testing Network Equipment market, by region, 2017 - 2030 (USD Million)
- Table 21 Installation Network Equipment market, by region, 2017 - 2030 (USD Million)
- Table 22 Integration Network Equipment market, by region, 2017 - 2030 (USD Million)
- Table 23 Managed Services Network Equipment market, by services 2017 - 2030 (USD Million)
- Table 24 Network Performance Management Network Equipment market, by region, 2017 - 2030 (USD Million)
- Table 25 App/Data Management Network Equipment market, by region, 2017 - 2030 (USD Million)
- Table 26 RAN Operation Support Network Equipment market, by region, 2017 - 2030 (USD Million)
- Table 27 Core Operation Support Network Equipment market, by region, 2017 - 2030 (USD Million)
- Table 28 Security Network Equipment market, by region, 2017 - 2030 (USD Million)
- Table 29 Training Network Equipment market, by region, 2017 - 2030 (USD Million)
- Table 30 Global Network Equipment market, by connectivity, 2017 - 2030 (USD Million)
- Table 31 2G/3G Network Equipment market, by region, 2017 - 2030 (USD Million)
- Table 32 4G LTE Network Equipment market, by region, 2017 - 2030 (USD Million)
- Table 33 5G Network Equipment market, by region, 2017 - 2030 (USD Million)
- Table 34 Global Network Equipment market, by network type, 2017 - 2030 (USD Million)
- Table 35 Public Network Network Equipment market, by region, 2017 - 2030 (USD Million)
- Table 36 Private Network Network Equipment market, by region, 2017 - 2030 (USD Million)
- Table 37 Global Network Equipment market, by end-users, 2017 - 2030 (USD Million)
- Table 38 Telecom Operators Network Equipment market, by region, 2017 - 2030 (USD Million)
- Table 39 Enterprises Network Equipment market, by region, 2017 - 2030 (USD Million)
- Table 40 Public Safety Network Equipment market, by region, 2017 - 2030 (USD Million)
- Table 41 Healthcare Network Equipment market, by region, 2017 - 2030 (USD Million)
- Table 42 Retail and e-Commerce Network Equipment market, by region, 2017 - 2030 (USD Million)
- Table 43 Banking, Financial Services, & Insurance Network Equipment market, by region, 2017 - 2030 (USD Million)
- Table 44 Government & Defense Network Equipment market, by region, 2017 - 2030 (USD Million)
- Table 45 Manufacturing Network Equipment market, by region, 2017 - 2030 (USD Million)
- Table 46 Others Network Equipment market, by region, 2017 - 2030 (USD Million)
- Table 47 North America Network Equipment market, by country, 2017 - 2030 (USD Million)
- Table 48 North America Network Equipment market, by component, 2017 - 2030 (USD Million)
- Table 49 North America Network Equipment market, by hardware 2017 - 2030 (USD Million)
- Table 50 North America Network Equipment market, by software 2017 - 2030 (USD Million)
- Table 51 North America Network Equipment market, by services 2017 - 2030 (USD Million)
- Table 52 North America Network Equipment market, by connectivity, 2017 - 2030 (USD Million)
- Table 53 North America Network Equipment market, by network type, 2017 - 2030 (USD Million)
- Table 54 North America Network Equipment market, by end-users, 2017 - 2030 (USD Million)
- Table 55 U.S. Network Equipment market, by component, 2017 - 2030 (USD Million)
- Table 56 U.S. Network Equipment market, by hardware 2017 - 2030 (USD Million)
- Table 57 U.S. Network Equipment market, by software 2017 - 2030 (USD Million)
- Table 58 U.S. Network Equipment market, by services 2017 - 2030 (USD Million)
- Table 59 U.S. Network Equipment market, by connectivity, 2017 - 2030 (USD Million)
- Table 60 U.S. Network Equipment market, by network type, 2017 - 2030 (USD Million)
- Table 61 U.S. Network Equipment market, by end-users, 2017 - 2030 (USD Million)
- Table 62 Canada Network Equipment market, by component, 2017 - 2030 (USD Million)
- Table 63 Canada Network Equipment market, by hardware 2017 - 2030 (USD Million)
- Table 64 Canada Network Equipment market, by software 2017 - 2030 (USD Million)
- Table 65 Canada Network Equipment market, by services 2017 - 2030 (USD Million)
- Table 66 Canada Network Equipment market, by connectivity, 2017 - 2030 (USD Million)
- Table 67 Canada Network Equipment market, by network type, 2017 - 2030 (USD Million)
- Table 68 Canada Network Equipment market, by end-users, 2017 - 2030 (USD Million)
- Table 69 Mexico Network Equipment market, by component, 2017 - 2030 (USD Million)
- Table 70 Mexico Network Equipment market, by hardware 2017 - 2030 (USD Million)
- Table 71 Mexico Network Equipment market, by software 2017 - 2030 (USD Million)
- Table 72 Mexico Network Equipment market, by services 2017 - 2030 (USD Million)
- Table 73 Mexico Network Equipment market, by connectivity, 2017 - 2030 (USD Million)
- Table 74 Mexico Network Equipment market, by network type, 2017 - 2030 (USD Million)
- Table 75 Mexico Network Equipment market, by end-users, 2017 - 2030 (USD Million)
- Table 76 Europe Network Equipment market, by country, 2017 - 2030 (USD Million)
- Table 77 Europe Network Equipment market, by component, 2017 - 2030 (USD Million)
- Table 78 Europe Network Equipment market, by hardware 2017 - 2030 (USD Million)
- Table 79 Europe Network Equipment market, by software 2017 - 2030 (USD Million)
- Table 80 Europe Network Equipment market, by services 2017 - 2030 (USD Million)
- Table 81 Europe Network Equipment market, by connectivity, 2017 - 2030 (USD Million)
- Table 82 Europe Network Equipment market, by network type, 2017 - 2030 (USD Million)
- Table 83 Europe Network Equipment market, by end-users, 2017 - 2030 (USD Million)
- Table 84 Germany Network Equipment market, by component, 2017 - 2030 (USD Million)
- Table 85 Germany Network Equipment market, by hardware 2017 - 2030 (USD Million)
- Table 86 Germany Network Equipment market, by software 2017 - 2030 (USD Million)
- Table 87 Germany Network Equipment market, by services 2017 - 2030 (USD Million)
- Table 88 Germany Network Equipment market, by connectivity, 2017 - 2030 (USD Million)
- Table 89 Germany Network Equipment market, by network type, 2017 - 2030 (USD Million)
- Table 90 Germany Network Equipment market, by end-users, 2017 - 2030 (USD Million)
- Table 91 U.K. Network Equipment market, by component, 2017 - 2030 (USD Million)
- Table 92 U.K. Network Equipment market, by hardware 2017 - 2030 (USD Million)
- Table 93 U.K. Network Equipment market, by software 2017 - 2030 (USD Million)
- Table 94 U.K. Network Equipment market, by services 2017 - 2030 (USD Million)
- Table 95 U.K. Network Equipment market, by connectivity, 2017 - 2030 (USD Million)
- Table 96 U.K. Network Equipment market, by network type, 2017 - 2030 (USD Million)
- Table 97 U.K. Network Equipment market, by end-users, 2017 - 2030 (USD Million)
- Table 98 France Network Equipment market, by component, 2017 - 2030 (USD Million)
- Table 99 France Network Equipment market, by hardware 2017 - 2030 (USD Million)
- Table 100 France Network Equipment market, by software 2017 - 2030 (USD Million)
- Table 101 France Network Equipment market, by services 2017 - 2030 (USD Million)
- Table 102 France Network Equipment market, by connectivity, 2017 - 2030 (USD Million)
- Table 103 France Network Equipment market, by network type, 2017 - 2030 (USD Million)
- Table 104 France Network Equipment market, by end-users, 2017 - 2030 (USD Million)
- Table 105 Asia Pacific Network Equipment market, by country, 2017 - 2030 (USD Million)
- Table 106 Asia Pacific Network Equipment market, by component, 2017 - 2030 (USD Million)
- Table 107 Asia Pacific Network Equipment market, by hardware 2017 - 2030 (USD Million)
- Table 108 Asia Pacific Network Equipment market, by software 2017 - 2030 (USD Million)
- Table 109 Asia Pacific Network Equipment market, by services 2017 - 2030 (USD Million)
- Table 110 Asia Pacific Network Equipment market, by connectivity, 2017 - 2030 (USD Million)
- Table 111 Asia Pacific Network Equipment market, by network type, 2017 - 2030 (USD Million)
- Table 112 Asia Pacific Network Equipment market, by end-users, 2017 - 2030 (USD Million)
- Table 113 China Network Equipment market, by component, 2017 - 2030 (USD Million)
- Table 114 China Network Equipment market, by hardware 2017 - 2030 (USD Million)
- Table 115 China Network Equipment market, by software 2017 - 2030 (USD Million)
- Table 116 China Network Equipment market, by services 2017 - 2030 (USD Million)
- Table 117 China Network Equipment market, by connectivity, 2017 - 2030 (USD Million)
- Table 118 China Network Equipment market, by network type, 2017 - 2030 (USD Million)
- Table 119 China Network Equipment market, by end-users, 2017 - 2030 (USD Million)
- Table 120 India Network Equipment market, by component, 2017 - 2030 (USD Million)
- Table 121 India Network Equipment market, by hardware 2017 - 2030 (USD Million)
- Table 122 India Network Equipment market, by software 2017 - 2030 (USD Million)
- Table 123 India Network Equipment market, by services 2017 - 2030 (USD Million)
- Table 124 India Network Equipment market, by connectivity, 2017 - 2030 (USD Million)
- Table 125 India Network Equipment market, by network type, 2017 - 2030 (USD Million)
- Table 126 India Network Equipment market, by end-users, 2017 - 2030 (USD Million)
- Table 127 Japan Network Equipment market, by component, 2017 - 2030 (USD Million)
- Table 128 Japan Network Equipment market, by hardware 2017 - 2030 (USD Million)
- Table 129 Japan Network Equipment market, by software 2017 - 2030 (USD Million)
- Table 130 Japan Network Equipment market, by services 2017 - 2030 (USD Million)
- Table 131 Japan Network Equipment market, by connectivity, 2017 - 2030 (USD Million)
- Table 132 Japan Network Equipment market, by network type, 2017 - 2030 (USD Million)
- Table 133 Japan Network Equipment market, by end-users, 2017 - 2030 (USD Million)
- Table 134 Latin America Network Equipment market, by country, 2017 - 2030 (USD Million)
- Table 135 Latin America Network Equipment market, by component, 2017 - 2030 (USD Million)
- Table 136 Latin America Network Equipment market, by hardware 2017 - 2030 (USD Million)
- Table 137 Latin America Network Equipment market, by software 2017 - 2030 (USD Million)
- Table 138 Latin America Network Equipment market, by services 2017 - 2030 (USD Million)
- Table 139 Latin America Network Equipment market, by connectivity, 2017 - 2030 (USD Million)
- Table 140 Latin America Network Equipment market, by network type, 2017 - 2030 (USD Million)
- Table 141 Latin America Network Equipment market, by end-users, 2017 - 2030 (USD Million)
- Table 142 Brazil Network Equipment market, by component, 2017 - 2030 (USD Million)
- Table 143 Brazil Network Equipment market, by hardware 2017 - 2030 (USD Million)
- Table 144 Brazil Network Equipment market, by software 2017 - 2030 (USD Million)
- Table 145 Brazil Network Equipment market, by services 2017 - 2030 (USD Million)
- Table 146 Brazil Network Equipment market, by connectivity, 2017 - 2030 (USD Million)
- Table 147 Brazil Network Equipment market, by network type, 2017 - 2030 (USD Million)
- Table 148 Brazil Network Equipment market, by end-users, 2017 - 2030 (USD Million)
- Table 149 MEA Network Equipment market, by country, 2017 - 2030 (USD Million)
- Table 150 MEA Network Equipment market, by component, 2017 - 2030 (USD Million)
- Table 151 MEA Network Equipment market, by hardware 2017 - 2030 (USD Million)
- Table 152 MEA Network Equipment market, by software 2017 - 2030 (USD Million)
- Table 153 MEA Network Equipment market, by services 2017 - 2030 (USD Million)
- Table 154 MEA Network Equipment market, by connectivity, 2017 - 2030 (USD Million)
- Table 155 MEA Network Equipment market, by network type, 2017 - 2030 (USD Million)
- Table 156 MEA Network Equipment market, by end-users, 2017 - 2030 (USD Million)
List of Figures
- Fig. 1 Market segmentation and scope
- Fig. 2 Global Network Equipment market, 2017 - 2030 (USD Million)
- Fig. 3 Network Equipment market - Value chain analysis
- Fig. 4 Network Equipment market dynamics
- Fig. 5 Key opportunities prioritized
- Fig. 6 Network Equipment market - Porter's five forces analysis
- Fig. 7 Network Equipment market - Key company market share analysis, 2021
- Fig. 8 Network Equipment market - PESTEL analysis
- Fig. 9 Network Equipment market, by component, 2021
- Fig. 10 Network Equipment market, by connectivity, 2021
- Fig. 11 Network Equipment market, by network type, 2021
- Fig. 12 Network Equipment market, by end-users, 2021
- Fig. 13 Network Equipment market, by region, 2021
- Fig. 14 Network Equipment market - Regional takeaways
- Fig. 15 North America Network Equipment market - Key takeaways
- Fig. 16 Europe Network Equipment market - Key takeaways
- Fig. 17 Asia Pacific Network Equipment market - Key takeaways
- Fig. 18 Latin America Network Equipment market - Key takeaways
- Fig. 19 MEA Network Equipment market - Key takeaways
Network Equipment Market Growth & Trends:
The global network equipment market size is expected to reach USD 190.53 billion by 2030, growing at a CAGR of 3.5% from 2022 to 2030, according to a new study conducted by Grand View Research, Inc. The network equipment comprises the set of components used for setting up the network infrastructure. The market consists of network equipment hardware, software, and related services.
The rising deployment of Internet of Things (IoT) enabled devices across commercial, consumer, and industrial infrastructure is one of the leading factors driving demand for network equipment. Rising investments by telecom operators and service providers in network equipment infrastructure and solutions are also fueling industry expansion. Cisco Systems, Inc., for example, announced in January 2022 the extension of its enterprise-grade switching capabilities to protect and upgrade key infrastructure within industrial networks. Such advancements are also encouraging the growth of the market.
Furthermore, the widespread use of new technologies has prompted some firms to invest in next-generation 5G network equipment and software. 5G-enabled network infrastructure and software applications may provide enterprises with a competitive advantage by assuring prompt service and assistance to their consumers. 5G-enabled networks help enterprises to improve operational efficiency and expand their entire customer base. Factors such as the advent of 5G technology, growing penetration of internet connectivity, rising adoption of smart devices, and technological advancements also positively impacted the demand for network equipment devices and infrastructure. The distance learning and remote work culture boosted the rollout of 5G network services and further propelled the adoption of 5G services.
Among hardware components, RAN equipment dominated the market in 2021. This is due to the growing adoption of RAN equipment for the increasing deployment of 5G networks. RAN enables network equipment providers and mobile network operators utilizing private 4G or private 5G to offer network slicing solutions assigning capacities to individual enterprises to split network usage within a public mobile network. Market players such as Telefonaktiebolaget LM Ericsson, Huawei Technologies Co. Ltd., Nokia Corporation, and Cisco Systems, Inc. are focused on providing RAN solutions for private 5G networks to help clients transform their existing legacy network infrastructure into the next generation 5G network.
Network Equipment Market Report Highlights:
- The hardware segment is expected to witness rapid growth over the forecast period. The increasing adoption of hardware such as RAN and core network by the end-users worldwide is anticipated to drive the growth of the segment
- The 5G segment is anticipated to register the fastest growth over the forecast period. The growth can be attributed to the increasing demand for 5G services for improved network and data connectivity across the globe
- The public network segment dominated the market in 2021. The dominance of the segment can be attributed due the increasing demand for improved network services across the public sectors
- The enterprises segment is expected to register the fastest growth over the forecast period, attributed to the increasing deployment of network equipment for private infrastructure across various verticals such as healthcare, public safety, and BFSI
- The Asia Pacific region is projected to witness the fastest growth over the forecast period. The growing demand for 5G-enabled services across the region is anticipated to play a vital role in driving the growth of the regional market
Table of Contents
Chapter 1. Methodology and Scope
- 1.1. Research Methodology
- 1.2. Research Scope and Assumptions
- 1.3. List of Data Sources
- 1.4. List of Abbreviations
Chapter 2. Executive Summary
- 2.1. Market Insights
- 2.2. Market Snapshot
- 2.3. Segmental Insights
- 2.4. Radio Access Network (RAN) Market Revenue Estimates, 2017 - 2030
Chapter 3. Market Variables, Trends, & Scope Outlook
- 3.1. Market Segmentation
- 3.2. Network Equipment Market Size & Growth Prospects
- 3.3. Network Equipment Market - Value Chain Analysis
- 3.4. Network Equipment Market Dynamics
- 3.4.1. Market Driver Analysis
- 3.4.2. Market Restraint Analysis
- 3.4.3. Market Opportunity Analysis
- 3.5. Network Equipment Penetration & Growth Prospects Mapping
- 3.6. Network Equipment Market - Porter's Five Forces Analysis
- 3.6.1. Supplier power
- 3.6.2. Buyer power
- 3.6.3. Substitution threat
- 3.6.4. Threat from new entrant
- 3.6.5. Competitive rivalry
- 3.7. Network Equipment Market - PEST Analysis
- 3.7.1. Political landscape
- 3.7.2. Economic landscape
- 3.7.3. Social landscape
- 3.7.4. Technology landscape
- 3.8. COVID-19 Impact Analysis
Chapter 4. Network Equipment Market Component Outlook
- 4.1. Network Equipment Market, By Component Analysis & Market Share, 2021 & 2030
- 4.2. Hardware
- 4.2.1. Market estimates and forecasts, 2017 - 2030 (USD Million)
- 4.2.2. Market estimates and forecasts, By Region, 2017 - 2030 (USD Million)
- 4.2.3. RAN
- 4.2.3.1. Market estimates and forecasts, 2017 - 2030 (USD Million)
- 4.2.3.2. Market estimates and forecasts, By Region, 2017 - 2030 (USD Million)
- 4.2.4. Core Network
- 4.2.4.1. Market estimates and forecasts, 2017 - 2030 (USD Million)
- 4.2.4.2. Market estimates and forecasts, By Region, 2017 - 2030 (USD Million)
- 4.2.5. Fixed Access
- 4.2.5.1. Market estimates and forecasts, 2017 - 2030 (USD Million)
- 4.2.5.2. Market estimates and forecasts, By Region, 2017 - 2030 (USD Million)
- 4.2.6. Others
- 4.2.6.1. Market estimates and forecasts, 2017 - 2030 (USD Million)
- 4.2.6.2. Market estimates and forecasts, By Region, 2017 - 2030 (USD Million)
- 4.3. Software
- 4.3.1. Market estimates and forecasts, 2017 - 2030 (USD Million)
- 4.3.2. Market estimates and forecasts, By Region, 2017 - 2030 (USD Million)
- 4.3.3. Infrastructure Software
- 4.3.3.1. Market estimates and forecasts, 2017 - 2030 (USD Million)
- 4.3.3.2. Market estimates and forecasts, By Region, 2017 - 2030 (USD Million)
- 4.3.4. OSS/BSS
- 4.3.4.1. Market estimates and forecasts, 2017 - 2030 (USD Million)
- 4.3.4.2. Market estimates and forecasts, By Region, 2017 - 2030 (USD Million)
- 4.3.5. Others
- 4.3.5.1. Market estimates and forecasts, 2017 - 2030 (USD Million)
- 4.3.5.2. Market estimates and forecasts, By Region, 2017 - 2030 (USD Million)
- 4.4. Services
- 4.4.1. Market estimates and forecasts, 2017 - 2030 (USD Million)
- 4.4.2. Market estimates and forecasts, By Region, 2017 - 2030 (USD Million)
- 4.4.3. Professional Services
- 4.4.3.1. Market estimates and forecasts, 2017 - 2030 (USD Million)
- 4.4.3.2. Market estimates and forecasts, By Region, 2017 - 2030 (USD Million)
- 4.4.3.3. Advisory/Consulting
- 4.4.3.3.1. Market estimates and forecasts, 2017 - 2030 (USD Million)
- 4.4.3.3.2. Market estimates and forecasts, By Region, 2017 - 2030 (USD Million)
- 4.4.3.4. Design / Optimization
- 4.4.3.4.1. Market estimates and forecasts, 2017 - 2030 (USD Million)
- 4.4.3.4.2. Market estimates and forecasts, By Region, 2017 - 2030 (USD Million)
- 4.4.3.5. Tools & automation
- 4.4.3.5.1. Market estimates and forecasts, 2017 - 2030 (USD Million)
- 4.4.3.5.2. Market estimates and forecasts, By Region, 2017 - 2030 (USD Million)
- 4.4.3.6. Security
- 4.4.3.6.1. Market estimates and forecasts, 2017 - 2030 (USD Million)
- 4.4.3.6.2. Market estimates and forecasts, By Region, 2017 - 2030 (USD Million)
- 4.4.4. Deployment Services
- 4.4.4.1. Market estimates and forecasts, 2017 - 2030 (USD Million)
- 4.4.4.2. Market estimates and forecasts, By Region, 2017 - 2030 (USD Million)
- 4.4.4.3. Testing
- 4.4.4.3.1. Market estimates and forecasts, 2017 - 2030 (USD Million)
- 4.4.4.3.2. Market estimates and forecasts, By Region, 2017 - 2030 (USD Million)
- 4.4.4.4. Installation
- 4.4.4.4.1. Market estimates and forecasts, 2017 - 2030 (USD Million)
- 4.4.4.4.2. Market estimates and forecasts, By Region, 2017 - 2030 (USD Million)
- 4.4.4.5. Integration
- 4.4.4.5.1. Market estimates and forecasts, 2017 - 2030 (USD Million)
- 4.4.4.5.2. Market estimates and forecasts, By Region, 2017 - 2030 (USD Million)
- 4.4.5. Managed Services
- 4.4.5.1. Market estimates and forecasts, 2017 - 2030 (USD Million)
- 4.4.5.2. Market estimates and forecasts, By Region, 2017 - 2030 (USD Million)
- 4.4.5.3. Network Performance and Management
- 4.4.5.3.1. Market estimates and forecasts, 2017 - 2030 (USD Million)
- 4.4.5.3.2. Market estimates and forecasts, By Region, 2017 - 2030 (USD Million)
- 4.4.5.4. App / Data Management
- 4.4.5.4.1. Market estimates and forecasts, 2017 - 2030 (USD Million)
- 4.4.5.4.2. Market estimates and forecasts, By Region, 2017 - 2030 (USD Million)
- 4.4.5.5. RAN Operation Support
- 4.4.5.5.1. Market estimates and forecasts, 2017 - 2030 (USD Million)
- 4.4.5.5.2. Market estimates and forecasts, By Region, 2017 - 2030 (USD Million)
- 4.4.5.6. Core Operation Support
- 4.4.5.6.1. Market estimates and forecasts, 2017 - 2030 (USD Million)
- 4.4.5.6.2. Market estimates and forecasts, By Region, 2017 - 2030 (USD Million)
- 4.4.5.7. Security
- 4.4.5.7.1. Market estimates and forecasts, 2017 - 2030 (USD Million)
- 4.4.5.7.2. Market estimates and forecasts, By Region, 2017 - 2030 (USD Million)
- 4.4.5.8. Training
- 4.4.5.8.1. Market estimates and forecasts, 2017 - 2030 (USD Million)
- 4.4.5.8.2. Market estimates and forecasts, By Region, 2017 - 2030 (USD Million)
Chapter 5. Network Equipment Market Connectivity Outlook
- 5.1. Network Equipment Market, By Connectivity Analysis & Market Share, 2021 & 2030
- 5.2. 2G/3G
- 5.2.1. Market estimates and forecasts, 2017 - 2030 (USD Million)
- 5.2.2. Market estimates and forecasts, By Region, 2017 - 2030 (USD Million)
- 5.3. 4G LTE
- 5.3.1. Market estimates and forecasts, 2017 - 2030 (USD Million)
- 5.3.2. Market estimates and forecasts, By Region, 2017 - 2030 (USD Million)
- 5.4. 5G
- 5.4.1. Market estimates and forecasts, 2017 - 2030 (USD Million)
- 5.4.2. Market estimates and forecasts, By Region, 2017 - 2030 (USD Million)
Chapter 6. Network Equipment Market Network Type Outlook
- 6.1. Network Equipment Market, By Network Type Analysis & Market Share, 2021 & 2030
- 6.2. Public Network
- 6.2.1. Market estimates and forecasts, 2017 - 2030 (USD Million)
- 6.2.2. Market estimates and forecasts, By Region, 2017 - 2030 (USD Million)
- 6.3. Private Network
- 6.3.1. Market estimates and forecasts, 2017 - 2030 (USD Million)
- 6.3.2. Market estimates and forecasts, By Region, 2017 - 2030 (USD Million)
Chapter 7. Network Equipment Market End-users Outlook
- 7.1. Network Equipment Market, By End-users Analysis & Market Share, 2021 & 2030
- 7.2. Telecom Operators
- 7.2.1. Market estimates and forecasts, 2017 - 2030 (USD Million)
- 7.2.2. Market estimates and forecasts, By Region, 2017 - 2030 (USD Million)
- 7.3. Enterprises
- 7.3.1. Market estimates and forecasts, 2017 - 2030 (USD Million)
- 7.3.2. Market estimates and forecasts, By Region, 2017 - 2030 (USD Million)
- 7.3.3. Public Safety
- 7.3.3.1. Market estimates and forecasts, 2017 - 2030 (USD Million)
- 7.3.3.2. Market estimates and forecasts, By Region, 2017 - 2030 (USD Million)
- 7.3.4. Healthcare
- 7.3.4.1. Market estimates and forecasts, 2017 - 2030 (USD Million)
- 7.3.4.2. Market estimates and forecasts, By Region, 2017 - 2030 (USD Million)
- 7.3.5. Retail and e-Commerce
- 7.3.5.1. Market estimates and forecasts, 2017 - 2030 (USD Million)
- 7.3.5.2. Market estimates and forecasts, By Region, 2017 - 2030 (USD Million)
- 7.3.6. Banking, Financial Services, & Insurance
- 7.3.6.1. Market estimates and forecasts, 2017 - 2030 (USD Million)
- 7.3.6.2. Market estimates and forecasts, By Region, 2017 - 2030 (USD Million)
- 7.3.7. Government & Defense
- 7.3.7.1. Market estimates and forecasts, 2017 - 2030 (USD Million)
- 7.3.7.2. Market estimates and forecasts, By Region, 2017 - 2030 (USD Million)
- 7.3.8. Manufacturing
- 7.3.8.1. Market estimates and forecasts, 2017 - 2030 (USD Million)
- 7.3.8.2. Market estimates and forecasts, By Region, 2017 - 2030 (USD Million)
- 7.3.9. Others
- 7.3.9.1. Market estimates and forecasts, 2017 - 2030 (USD Million)
- 7.3.9.2. Market estimates and forecasts, By Region, 2017 - 2030 (USD Million)
Chapter 8. Network Equipment Market: Regional Estimates & Trend Analysis
- 8.1. Network Equipment Market Share by Region, 2021 & 2030
- 8.2. North America
- 8.2.1. Market estimates and forecasts, 2017 - 2030
- 8.2.2. Market estimates and forecasts, By Component, 2017 - 2030 (USD Million)
- 8.2.3. Market estimates and forecasts, By Connectivity, 2017 - 2030 (USD Million)
- 8.2.4. Market estimates and forecasts, By Network Type, 2017 - 2030 (USD Million)
- 8.2.5. Market estimates and forecasts, By End-user, 2017 - 2030 (USD Million)
- 8.2.6. U.S.
- 8.2.6.1. Market estimates and forecasts, By Component, 2017 - 2030 (USD Million)
- 8.2.6.2. Market estimates and forecasts, By Connectivity, 2017 - 2030 (USD Million)
- 8.2.6.3. Market estimates and forecasts, By Network Type, 2017 - 2030 (USD Million)
- 8.2.6.4. Market estimates and forecasts, By End-user, 2017 - 2030 (USD Million)
- 8.2.7. Canada
- 8.2.7.1. Market estimates and forecasts, By Component, 2017 - 2030 (USD Million)
- 8.2.7.2. Market estimates and forecasts, By Connectivity, 2017 - 2030 (USD Million)
- 8.2.7.3. Market estimates and forecasts, By Network Type, 2017 - 2030 (USD Million)
- 8.2.7.4. Market estimates and forecasts, By End-user, 2017 - 2030 (USD Million)
- 8.3. Europe
- 8.3.1. Market estimates and forecasts, 2017 - 2030
- 8.3.2. Market estimates and forecasts, By Component, 2017 - 2030 (USD Million)
- 8.3.3. Market estimates and forecasts, By Connectivity, 2017 - 2030 (USD Million)
- 8.3.4. Market estimates and forecasts, By Network Type, 2017 - 2030 (USD Million)
- 8.3.5. Market estimates and forecasts, By End-user, 2017 - 2030 (USD Million)
- 8.3.6. Germany
- 8.3.6.1. Market estimates and forecasts, By Component, 2017 - 2030 (USD Million)
- 8.3.6.2. Market estimates and forecasts, By Connectivity, 2017 - 2030 (USD Million)
- 8.3.6.3. Market estimates and forecasts, By Network Type, 2017 - 2030 (USD Million)
- 8.3.6.4. Market estimates and forecasts, By End-user, 2017 - 2030 (USD Million)
- 8.3.7. U.K.
- 8.3.7.1. Market estimates and forecasts, By Component, 2017 - 2030 (USD Million)
- 8.3.7.2. Market estimates and forecasts, By Connectivity, 2017 - 2030 (USD Million)
- 8.3.7.3. Market estimates and forecasts, By Network Type, 2017 - 2030 (USD Million)
- 8.3.7.4. Market estimates and forecasts, By End-user, 2017 - 2030 (USD Million)
- 8.3.8. France
- 8.3.8.1. Market estimates and forecasts, By Component, 2017 - 2030 (USD Million)
- 8.3.8.2. Market estimates and forecasts, By Connectivity, 2017 - 2030 (USD Million)
- 8.3.8.3. Market estimates and forecasts, By Network Type, 2017 - 2030 (USD Million)
- 8.3.8.4. Market estimates and forecasts, By End-user, 2017 - 2030 (USD Million)
- 8.4. Asia Pacific
- 8.4.1. Market estimates and forecasts, 2017 - 2030
- 8.4.2. Market estimates and forecasts, By Component, 2017 - 2030 (USD Million)
- 8.4.3. Market estimates and forecasts, By Connectivity, 2017 - 2030 (USD Million)
- 8.4.4. Market estimates and forecasts, By Network Type, 2017 - 2030 (USD Million)
- 8.4.5. Market estimates and forecasts, By End-user, 2017 - 2030 (USD Million)
- 8.4.6. China
- 8.4.6.1. Market estimates and forecasts, By Component, 2017 - 2030 (USD Million)
- 8.4.6.2. Market estimates and forecasts, By Connectivity, 2017 - 2030 (USD Million)
- 8.4.6.3. Market estimates and forecasts, By Network Type, 2017 - 2030 (USD Million)
- 8.4.6.4. Market estimates and forecasts, By End-user, 2017 - 2030 (USD Million)
- 8.4.7. Japan
- 8.4.7.1. Market estimates and forecasts, By Component, 2017 - 2030 (USD Million)
- 8.4.7.2. Market estimates and forecasts, By Connectivity, 2017 - 2030 (USD Million)
- 8.4.7.3. Market estimates and forecasts, By Network Type, 2017 - 2030 (USD Million)
- 8.4.7.4. Market estimates and forecasts, By End-user, 2017 - 2030 (USD Million)
- 8.4.8. India
- 8.4.8.1. Market estimates and forecasts, By Component, 2017 - 2030 (USD Million)
- 8.4.8.2. Market estimates and forecasts, By Connectivity, 2017 - 2030 (USD Million)
- 8.4.8.3. Market estimates and forecasts, By Network Type, 2017 - 2030 (USD Million)
- 8.4.8.4. Market estimates and forecasts, By End-user, 2017 - 2030 (USD Million)
- 8.5. Latin America
- 8.5.1. Market estimates and forecasts, 2017 - 2030
- 8.5.2. Market estimates and forecasts, By Component, 2017 - 2030 (USD Million)
- 8.5.3. Market estimates and forecasts, By Connectivity, 2017 - 2030 (USD Million)
- 8.5.4. Market estimates and forecasts, By Network Type, 2017 - 2030 (USD Million)
- 8.5.5. Market estimates and forecasts, By End-user, 2017 - 2030 (USD Million)
- 8.5.6. Brazil
- 8.5.6.1. Market estimates and forecasts, By Component, 2017 - 2030 (USD Million)
- 8.5.6.2. Market estimates and forecasts, By Connectivity, 2017 - 2030 (USD Million)
- 8.5.6.3. Market estimates and forecasts, By Network Type, 2017 - 2030 (USD Million)
- 8.5.6.4. Market estimates and forecasts, By End-user, 2017 - 2030 (USD Million)
- 8.5.7. Mexico
- 8.5.7.1. Market estimates and forecasts, By Component, 2017 - 2030 (USD Million)
- 8.5.7.2. Market estimates and forecasts, By Connectivity, 2017 - 2030 (USD Million)
- 8.5.7.3. Market estimates and forecasts, By Network Type, 2017 - 2030 (USD Million)
- 8.5.7.4. Market estimates and forecasts, By End-user, 2017 - 2030 (USD Million)
- 8.6. Middle East & Africa
- 8.6.1. Market estimates and forecasts, 2017 - 2030
- 8.6.2. Market estimates and forecasts, By Component, 2017 - 2030 (USD Million)
- 8.6.3. Market estimates and forecasts, By Connectivity, 2017 - 2030 (USD Million)
- 8.6.4. Market estimates and forecasts, By Network Type, 2017 - 2030 (USD Million)
- 8.6.5. Market estimates and forecasts, By End-user, 2017 - 2030 (USD Million)
Chapter 9. Competitive Analysis
- 9.1. Recent Developments and Impact Analysis, by Key Market Participants
- 9.2. Company/Competition Categorization (Key Innovators, Market Leaders, Emerging, Niche Players)
- 9.3. Vendor Landscape
- 9.3.1. Key company market share analysis, 2021
- 9.4. Company Analysis Tools
- 9.4.1. Market Position Analysis
- 9.4.2. Competitive Dashboard Analysis
Chapter 10. Competitive Landscape
- 10.1. Company Profiles
- 10.2. Telefonaktiebolaget LM Ericsson
- 10.2.1. Company overview
- 10.2.2. Financial performance
- 10.2.3. Type benchmarking
- 10.2.4. Strategic initiatives
- 10.3. Nokia Corporation
- 10.3.1. Company overview
- 10.3.2. Financial performance
- 10.3.3. Type benchmarking
- 10.3.4. Strategic initiatives
- 10.4. Samsung Electronics Co. Ltd
- 10.4.1. Company overview
- 10.4.2. Financial performance
- 10.4.3. Type benchmarking
- 10.4.4. Strategic initiatives
- 10.5. ZTE Corporation
- 10.5.1. Company overview
- 10.5.2. Financial performance
- 10.5.3. Type benchmarking
- 10.5.4. Strategic initiatives
- 10.6. Juniper Networks Inc
- 10.6.1. Company overview
- 10.6.2. Financial performance
- 10.6.3. Type benchmarking
- 10.6.4. Strategic initiatives
- 10.7. Huawei Technologies Co. Ltd
- 10.7.1. Company overview
- 10.7.2. Financial performance
- 10.7.3. Type benchmarking
- 10.7.4. Strategic initiatives
- 10.8. Cisco Systems Inc
- 10.8.1. Company overview
- 10.8.2. Financial performance
- 10.8.3. Type benchmarking
- 10.8.4. Strategic initiatives
- 10.9. Hewlett Packard Enterprise Development LP.
- 10.9.1. Company overview
- 10.9.2. Financial performance
- 10.9.3. Type benchmarking
- 10.9.4. Strategic initiatives
- 10.10. Broadcom.
- 10.10.1. Company overview
- 10.10.2. Financial performance
- 10.10.3. Type benchmarking
- 10.10.4. Strategic initiatives
- 10.11. ALE International (Alcatel-Lucent).
- 10.11.1. Company overview
- 10.11.2. Financial performance
- 10.11.3. Type benchmarking
- 10.11.4. Strategic initiatives
- 10.12. Check Point Software Technologies Ltd.
- 10.12.1. Company overview
- 10.12.2. Financial performance
- 10.12.3. Type benchmarking
- 10.12.4. Strategic initiatives