|
|
市場調査レポート
商品コード
1178648
スポーツツーリズムの市場規模、シェア、動向分析レポート:スポーツタイプ別(サッカー/フットボール、クリケット、バスケットボール、テニス)、観光タイプ別(アクティブ、パッシブ、ノスタルジア)、地域別、セグメント別予測、2023年~2030年Sports Tourism Market Size, Share & Trends Analysis Report By Sports Type (Soccer/Football, Cricket, Basketball, Tennis), By Tourism Type (Active, Passive, Nostalgia), By Region, And Segment Forecasts, 2023 - 2030 |
||||||
|
|
|||||||
|
● お客様のご希望に応じて、既存データの加工や未掲載情報(例:国別セグメント)の追加などの対応が可能です。 詳細はお問い合わせください。 |
|||||||


| スポーツツーリズムの市場規模、シェア、動向分析レポート:スポーツタイプ別(サッカー/フットボール、クリケット、バスケットボール、テニス)、観光タイプ別(アクティブ、パッシブ、ノスタルジア)、地域別、セグメント別予測、2023年~2030年 |
|
出版日: 2022年12月22日
発行: Grand View Research
ページ情報: 英文 80 Pages
納期: 2~10営業日
|
- 全表示
- 概要
- 図表
- 目次
スポーツツーリズムの市場成長・動向
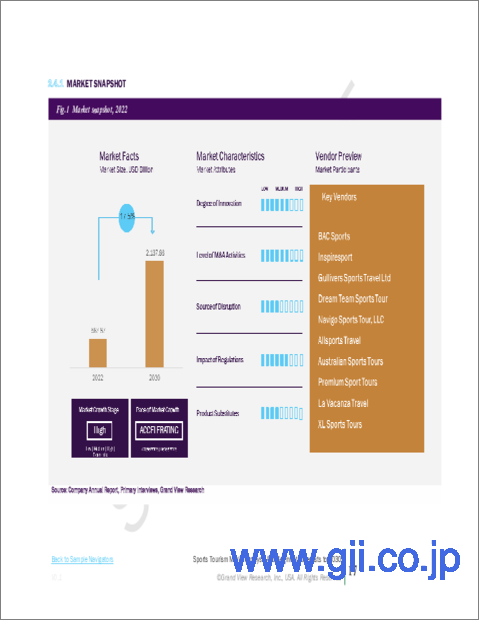
グランドビューリサーチ社の最新レポートによると、世界のスポーツツーリズム市場規模は2030年に2兆1378億6000万米ドルに達すると予測されています。同市場は、2023年から2030年にかけてCAGR17.5%で拡大すると予測されています。成長の原動力は、スポーツイベントやオリンピック、FIFA、ウィンブルドンなどのメガイベントに関連した施設の増加です。スポーツイベントは、その規模や種類を問わず、参加者や観客として観光客を集めるものであり、開催地は、地域の特色を取り入れることで差別化を図り、本物の地域体験を提供することに努めています。
バドミントンの試合やヨガ・リトリート、ビーチでのサーフィンなど、スポーツイベントを目的とした旅行もスポーツ・ツーリズムに含まれます。サッカーのプレミアリーグやF1レースなどのスポーツイベントへの参加もスポーツツーリズムに含まれます。バルセロナのオリンピックスタジアムのような史跡訪問や、リオデジャネイロのマラカナスタジアムの博物館のような好きなスポーツ選手にまつわる品々を見学することも、スポーツ・ツーリズムの一形態です。
スポーツツーリズム市場では、スポーツの種類ではサッカー/フットボール分野が優位を占めており、予測期間中、最大の市場シェアを占めると予想されます。アメリカンフットボールは、世界で最も人気のあるスポーツです。国際的には3億9,000万人から4億1,000万人のサポーターがおり、その大半は米国にいるため、米国で最も注目されているスポーツの一つとなっています。NFL(ナショナル・フットボール・リーグ)は、32のクラブがNFC(ナショナル・フットボール・カンファレンス)とAFC(アメリカン・フットボール・カンファレンス)に均等に分かれて構成されており、アメリカンフットボール(AFC)ではトップリーグです。
パッシブツーリズムは、予測期間中に最も速いCAGRで拡大すると予想されます。このセグメントの拡大傾向は、ミレニアル世代や若年層が、人気のある試合や応援しているスポーツ選手を観戦するためだけに様々な国や都市を旅行することを好むようになっていることに起因しています。また、ブラジル、インド、スリランカなど、多くの発展途上国が観光客を呼び込むためにインフラ整備を進めています。このことは、世界のスポーツツーリズム産業の拡大を促すと予想されます。
2022年、欧州が最大の収益シェアを占めました。人々は、さまざまなスポーツイベントに参加したり、さまざまな観光地を訪れたりするために、地球上のさまざまな地域を訪れます。しかし、スポーツ関連のイベントは、現地の文化に触れたい観光客にとって、欧州の中でも特に魅力的なものが多いです。欧州のスタジアムやスポーツアリーナは、国際大会や年間行事から個人のクラブの試合やマッチングまで、常に素晴らしいスペクタクルで賑わっているのです。
スポーツツーリズム市場レポートハイライト
スポーツツーリズムは2022年に5,878億7,000万米ドルとなり、予測期間中に17%以上のCAGRを記録すると予想されています。スポーツツーリズム産業の成長とスポーツイベントの開催は、世界的にインフラ、雇用の創出、収入、旅行先としての国のプロモーションなどに大きな影響を与えている
サッカー/フットボール分野は、2030年までに8357億米ドルに達すると予想されます。スポーツタイプの成長は、FIFAのようなメガトーナメントが4年ごとに異なる都市で開催されるため、ゲームを体験するだけでなく、1週間かけて都市全体を旅行するために多くの訪問者を惹きつけることに起因している
パッシブツーリズム分野は、2022年から2030年にかけて17%以上の大幅なCAGRを記録すると予想されます。スポーツの人気の高まりや、プレミアリーグの競争の激化と相まって、世界中のスポーツイベント産業の成長にさらに貢献しています。
欧州地域は、2022年に2,234億8,000万米ドルと評価されました。一生に一度の貴重な体験をしたい、有名なスポーツイベントに参加したいなど、スポーツに熱中して特定の場所を訪れる欧州からの観光客が増加しています。
目次
第1章 調査手法と範囲
- 市場セグメンテーションと範囲
- 市場の定義
- 情報調達
- 購入したデータベース
- GVRの内部データベース
- 二次情報と第三者の視点
- 1次調査
- 情報分析
- データ分析モデル
- 市場形成とデータ可視化
- データの検証と公開
第2章 エグゼクティブサマリー
- 市場の見通し
- スポーツタイプの見通し
- 観光タイプの見通し
- 地域の見通し
第3章 スポーツツーリズム市場の変数、動向、範囲
- 市場イントロダクション
- 浸透と成長の見通しのマッピング
- COVID-19のスポーツツーリズム市場への影響
- 業界バリューチェーン分析
- 販売・小売チャネル分析
- 利益率分析
- 市場力学
- 市場促進要因分析
- 市場抑制要因分析
- 業界の課題
- 業界の機会
- 事業環境分析
- 業界分析- ポーターの5つの力
- サプライヤーの力
- 買い手の交渉力
- 代替の脅威
- 新規参入者からの脅威
- 競争企業間の敵対関係
- スポーツツーリズム市場のロードマップ
- 市場参入戦略
第4章 消費者行動分析
- 人口統計分析
- 消費者の動向と好み
- 購入決定に影響を与える要因
- コンシューマー製品タイプの採用
- 所見と推奨事項
第5章 スポーツツーリズム市場:スポーツタイプの推定・動向分析
- スポーツタイプの変動分析と市場シェア、2022年と2030年
- サッカー/フットボール
- クリケット
- バスケットボール
- テニス
- ホッケー
- その他
第6章 スポーツツーリズム市場:タイプの推定・動向分析
- タイプの変動分析と市場シェア、2022年と2030年
- アクティブ
- パッシブ
- ノスタルジア
第7章 スポーツツーリズム市場:地域の推定・動向分析
- 地域別変動分析と市場シェア、2022年と2030年
- 北米
- 米国
- カナダ
- 欧州
- 英国
- ドイツ
- フランス
- アジア太平洋地域
- 中国
- インド
- 日本
- 中南米
- ブラジル
- 中東およびアフリカ
- 南アフリカ
第8章 競合分析
- 主要な世界プレーヤー、最近の動向、業界への影響
- 主要企業/競合の分類(主要なイノベーター、市場リーダー、新興企業)
- ベンダー情勢
- 主要企業の市場シェア分析、2022年
第9章 企業プロファイル
- BAC Sports
- 会社概要
- 財務実績
- 製品タイプベンチマーク
- 戦略的イニシアチブ
- Inspiresport
- 会社概要
- 財務実績
- 製品タイプベンチマーク
- Gullivers Sports Travel Ltd
- 会社概要
- 財務実績
- 製品タイプベンチマーク
- 戦略的イニシアチブ
- Dream Team Sports Tour
- 会社概要
- 財務実績
- 製品タイプベンチマーク
- 戦略的イニシアチブ
- Navigo Sports Tour, LLC
- 会社概要
- 財務実績
- 製品タイプベンチマーク
- 戦略的イニシアチブ
- Allsports Travel
- 会社概要
- 財務実績
- 製品タイプベンチマーク
- 戦略的イニシアチブ
- Australian Sports Tours
- 会社概要
- 財務実績
- 製品タイプベンチマーク
- 戦略的イニシアチブ
- Premium Sport Tours
- 会社概要
- 財務実績
- 製品タイプベンチマーク
- 戦略的イニシアチブ
- La Vacanza Travel
- 会社概要
- 財務実績
- 製品タイプベンチマーク
- 戦略的イニシアチブ
- XL Sports Tours
- 会社概要
- 財務実績
- 製品のベンチマーク
- 戦略的イニシアチブ
List of Tables
- 1. Sports Tourism market - Driving factor market analysis
- 2. Sports Tourism market - Restraint factor market analysis
- 3. Sports Tourism market estimates and forecast for soccer/football, 2017 - 2030 (USD Million)
- 4. Sports Tourism market estimates and forecast for cricket, 2017 - 2030 (USD Million)
- 5. Sports Tourism market estimates and forecast for basketball, 2017 - 2030 (USD Million)
- 6. Sports Tourism market estimates and forecast for tennis, 2017 - 2030 (USD Million)
- 7. Sports Tourism market estimates and forecast for hockey, 2017 - 2030 (USD Million)
- 8. Sports Tourism market estimates and forecast for others, 2017 - 2030 (USD Million)
- 9. Sports Tourism market estimates and forecast, by active, 2017 - 2030 (USD Million)
- 10. Sports Tourism market estimates and forecast, by passive, 2017 - 2030 (USD Million)
- 11. Sports Tourism market estimates and forecast, by nostalgia, 2017 - 2030 (USD Million)
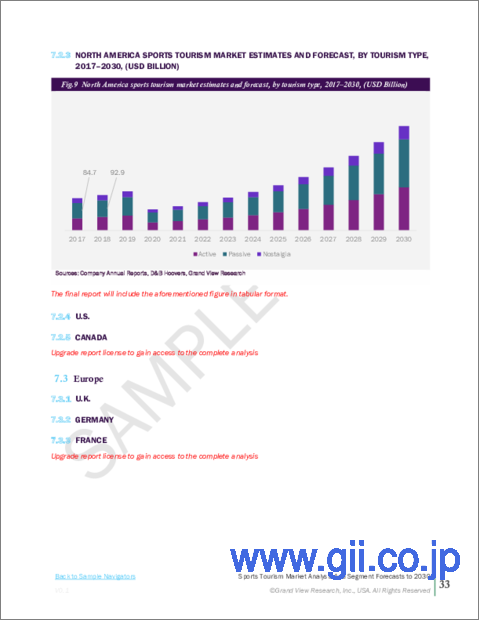
- 12. North America Sports Tourism market estimates and forecast, 2017 - 2030 (USD Million)
- 13. North America Sports Tourism market estimates and forecast, by Sports type, 2017 - 2030 (USD Million)
- 14. North America Sports Tourism market estimates and forecast, by Tourism type, 2017 - 2030 (USD Million)
- 15. U.S. Sports Tourism market estimates and forecast, 2017 - 2030 (USD Million)
- 16. U.S. Sports Tourism market estimates and forecast, by Sports type, 2017 - 2030 (USD Million)
- 17. U.S. Sports Tourism market estimates and forecast, by Tourism type, 2017 - 2030 (USD Million)'
- 18. Canada Sports Tourism market estimates and forecast, 2017 - 2030 (USD Million)
- 19. Canada Sports Tourism market estimates and forecast, by Sports type, 2017 - 2030 (USD Million)
- 20. Canada Sports Tourism market estimates and forecast, by Tourism type, 2017 - 2030 (USD Million)
- 21. Europe Sports Tourism market estimates and forecast, 2017-2030 (USD Million)
- 22. Europe Sports Tourism market estimates and forecast, by Sports type, 2017-2030 (USD Million)
- 23. Europe Sports Tourism market estimates and forecast, by Tourism type, 2017-2030 (USD Million)
- 24. U.K. Sports Tourism market estimates and forecast, 2017-2030 (USD Million)
- 25. U.K. Sports Tourism market estimates and forecast, by Sports type, 2017-2030 (USD Million)
- 26. U.K. Sports Tourism market estimates and forecast, by Tourism type, 2017-2030 (USD Million)
- 27. Germany Sports Tourism market estimates and forecast, 2017-2030 (USD Million)
- 28. Germany Sports Tourism market estimates and forecast, by Sports type, 2017 - 2030 (USD Million)
- 29. Germany Sports Tourism market estimates and forecast, by Tourism type, 2017 - 2030 (USD Million)
- 30. France Sports Tourism market estimates and forecast, 2017-2030 (USD Million)
- 31. France Sports Tourism market estimates and forecast, by Sports type, 2017 - 2030 (USD Million)
- 32. France Sports Tourism market estimates and forecast, by Tourism type, 2017 - 2030 (USD Million)
- 33. Asia Pacific Sports Tourism market estimates and forecast, 2017 - 2030 (USD Million)
- 34. Asia Pacific Sports Tourism market estimates and forecast, by Sports type, 2017 - 2030 (USD Million)
- 35. Asia Pacific Sports Tourism market estimates and forecast, by Tourism type, 2017 - 2030 (USD Million)
- 36. China Sports Tourism market estimates and forecast, 2017 - 2030 (USD Million)
- 37. China Sports Tourism market estimates and forecast, by Sports type, 2017 - 2030 (USD Million)
- 38. China Sports Tourism market estimates and forecast, by Tourism type, 2017 - 2030 (USD Million)
- 39. India Sports Tourism market estimates and forecast, 2017 - 2030 (USD Million)
- 40. India Sports Tourism market estimates and forecast, by Sports type, 2017 - 2030 (USD Million)
- 41. India Sports Tourism market estimates and forecast, by Tourism type, 2017 - 2030 (USD Million)
- 42. Japan Sports Tourism market estimates and forecast, 2017 - 2030 (USD Million)
- 43. Japan Sports Tourism market estimates and forecast, by Sports type, 2017 - 2030 (USD Million)
- 44. Japan Sports Tourism market estimates and forecast, by Tourism type, 2017 - 2030 (USD Million)
- 45. South America Sports Tourism market estimates and forecast, 2017 - 2030 (USD Million)
- 46. South America Sports Tourism market estimates and forecast, by Sports type, 2017 - 2030 (USD Million)
- 47. South America Sports Tourism market estimates and forecast, by Tourism type, 2017 - 2030 (USD Million)
- 48. Brazil Sports Tourism market estimates and forecast, 2017 - 2030 (USD Million)
- 49. Brazil Sports Tourism market estimates and forecast, by Sports type, 2017 - 2030 (USD Million)
- 50. Brazil Sports Tourism market estimates and forecast, by Tourism type, 2017 - 2030 (USD Million)
- 51. Middle East & Africa Sports Tourism market estimates and forecast, 2017 - 2030 (USD Million)
- 52. Middle East & Africa Sports Tourism market estimates and forecast, by Sports type, 2017 - 2030 (USD Million)
- 53. Middle East & Africa Sports Tourism market estimates and forecast, by Tourism type, 2017 - 2030 (USD Million)
- 54. South Africa Sports Tourism market estimates and forecast, 2017 - 2030 (USD Million)
- 55. South Africa Sports Tourism market estimates and forecast, by Sports type, 2017 - 2030 (USD Million)
- 56. South Africa Sports Tourism market estimates and forecast, by Tourism type, 2017 - 2030 (USD Million)
- 57. Company categorization
List of Figures
- 1. Sports Tourism market segmentation
- 2. Information procurement
- 3. Primary research pattern
- 4. Primary research approaches
- 5. Primary research process
- 6. Sports Tourism market - Sports type growth
- 7. Sports Tourism market- Value chain analysis
- 8. Sports Tourism market - Retail chain analysis
- 9. Sports Tourism market - Profit margin analysis
- 10. COVID-19 shifted spending to the home
- 11. Sports Tourism market: Porter's Five Forces Analysis
- 12. Roadmap of Sports Tourism market
- 13. Factors affecting consumer buying decisions in the Sports Tourism market
- 14. Sports Tourism market: Sports type share (%) analysis, 2022 & 2030
- 15. Sports Tourism market: Tourism type share (%) analysis, 2022 & 2030
- 16. Sports Tourism market: Regional share (%) analysis, 2022 & 2030
- 17. Sports Tourism market: Estimated company market share analysis, 2022
Sports Tourism Market Growth & Trends:
The global sports tourism market size is expected to reach USD 2,137.86 billion by 2030, according to a new report by Grand View Research, Inc. The market is anticipated to expand at a CAGR of 17.5% from 2023 to 2030. The growth is fueled by an increase in facilities associated with sports events and mega events such as Olympics, FIFA, and Wimbledon. Sports events of all sizes and types draw tourists as participants or spectators, and locations work to differentiate themselves and offer genuine local experiences by incorporating local flavors into them.
Traveling for sporting events such as a badminton match, yoga retreat, or to surf on beaches is included in sports tourism. Sports tourism includes attending sporting events like a Premier League football game or a Formula One race. Visits to historic sites, such as the Olympic stadium in Barcelona, or to examine artifacts associated with a favorite sports figure, like the museum of the Maracana football stadium in Rio de Janeiro, are forms of sports tourism.
The soccer/football segment of the sports tourism market dominates in terms of sport type, and it is anticipated that it will hold the largest market share during the projection period. American football is the most popular sport in the world. Football has between 390 million and 410 million supporters internationally; the majority of them are in the United States, making it one of the most watched sports in the country. The National Football League (NFL), which consists of 32 clubs split evenly between the National Football Conference (NFC) and the American Football Conference, is the top league in American football (AFC).
Passive tourism is expected to expand at the fastest CAGR over the forecast period. The growing trend of the segment is attributed to the rising preference of millennials and younger adults to travel to various countries, and cities just to watch some of the popular games, or their favorite sportsperson. Additionally, many developing nations are enhancing their infrastructure to draw in more tourists, including Brazil, India, and Sri Lanka. This is anticipated to encourage the expansion of the global sports tourism industry.
Europe held the largest revenue share in 2022. People visit different parts of the globe to attend a variety of sports events and to visit various tourist destinations. Sports-related events, however, are often among the best in Europe for tourists who want to get a sense of the local culture. Europe's stadiums and sporting arenas are constantly crowded with incredible spectacles, from international tournaments and yearly events to individual club games and matches.
Sports Tourism Market Report Highlights:
- Sports tourism was valued at USD 587.87 billion in 2022 and is expected to register a CAGR of over 17% during the forecast period. The growth of the sports tourism industry and the hosting of sporting events have had a significant impact on infrastructure, the creation of jobs, income, and the promotion of countries as travel destinations globally
- The soccer/football segment is expected to reach USD 835.70 billion by 2030. The growth of the sports type is due to the mega tournaments such as FIFA that are held every four years in different cities which attracts more visitors to experience the game as well as travel the whole city the whole week
- The passive tourism segment is expected to witness a substantial CAGR of over 17% from 2022 to 2030. The growing popularity of sports, and favorite athletes coupled with the rising premier league competitions further contribute to the growth of the sports event industry across the globe
- Europe region was valued a USD 223.48 billion in 2022. An increasing number of tourists from Europe visit particular places since they are passionate about sports, such as engaging in a once-in-a-lifetime experience at a significant site or attending a renowned sporting event
Table of Contents
Chapter 1. Methodology and Scope
- 1.1. Market Segmentation & Scope
- 1.2. Market Definition
- 1.3. Information Procurement
- 1.3.1. Purchased Database
- 1.3.2. GVR's Internal Database
- 1.3.3. Secondary Sources & Third-Party Perspectives
- 1.3.4. Primary Research
- 1.4. Information Analysis
- 1.4.1. Data Analysis Models
- 1.5. Market Formulation & Data Visualization
- 1.6. Data Validation & Publishing
Chapter 2. Executive Summary
- 2.1. Market Outlook
- 2.2. Sports Type Outlook
- 2.3. Tourism Type Outlook
- 2.4. Regional Outlook
Chapter 3. Sports Tourism Market Variables, Trends & Scope
- 3.1. Market Introduction
- 3.2. Penetration & Growth Prospect Mapping
- 3.3. Impact of COVID-19 on the Sports Tourism Market
- 3.4. Industry Value Chain Analysis
- 3.4.1. Sales/Retail Channel Analysis
- 3.4.2. Profit Margin Analysis
- 3.5. Market Dynamics
- 3.5.1. Market Driver Analysis
- 3.5.2. Market Restraint Analysis
- 3.5.3. Industry Challenges
- 3.5.4. Industry Opportunities
- 3.6. Business Environment Analysis
- 3.6.1. Industry Analysis - Porter's Five Forces
- 3.6.2. Supplier Power
- 3.6.3. Buyer Power
- 3.6.4. Substitution Threat
- 3.6.5. Threat from New Entrant
- 3.6.6. Competitive Rivalry
- 3.7. Roadmap of Sports Tourism Market
- 3.8. Market Entry Strategies
Chapter 4. Consumer Behavior Analysis
- 4.1. Demographic Analysis
- 4.2. Consumer Trends and Preferences
- 4.3. Factors Affecting Buying Decision
- 4.4. Consumer Product type Adoption
- 4.5. Observations & Recommendations
Chapter 5. Sports Tourism Market: Sports type Estimates & Trend Analysis
- 5.1. Sports Type Movement Analysis & Market Share, 2022 & 2030
- 5.2. Soccer/Football
- 5.2.1. Market estimates and forecast, 2017 - 2030 (USD Million)
- 5.3. Cricket
- 5.3.1. Market estimates and forecast, 2017 - 2030 (USD Million)
- 5.4. Basketball
- 5.4.1. Market estimates and forecast, 2017 - 2030 (USD Million)
- 5.5. Tennis
- 5.5.1. Market estimates and forecast, 2017 - 2030 (USD Million)
- 5.6. Hockey
- 5.6.1. Market estimates and forecast, 2017 - 2030 (USD Million)
- 5.7. Others
- 5.7.1. Market estimates and forecast, 2017 - 2030 (USD Million)
Chapter 6. Sports Tourism Market: Type Estimates & Trend Analysis
- 6.1. Type Movement Analysis & Market Share, 2022 & 2030
- 6.2. Active
- 6.2.1. Market estimates and forecast, 2017 - 2030 (USD Million)
- 6.3. Passive
- 6.3.1. Market estimates and forecast, 2017 - 2030 (USD Million)
- 6.4. Nostalgia
- 6.4.1. Market estimates and forecast, 2017 - 2030 (USD Million)
Chapter 7. Sports Tourism Market: Regional Estimates & Trend Analysis
- 7.1. Regional Movement Analysis & Market Share, 2022 & 2030
- 7.2. North America
- 7.2.1. Market estimates and forecast, 2017 - 2030 (USD Million)
- 7.2.2. Market estimates and forecast, by Sports type, 2017 - 2030 (USD Million)
- 7.2.3. Market estimates and forecast, by Tourism Type, 2017 - 2030 (USD Million)
- 7.2.4. U.S.
- 7.2.4.1. Market estimates and forecast, by Sports type, 2017 - 2030 (USD Million)
- 7.2.4.2. Market estimates and forecast, by Tourism Type, 2017 - 2030 (USD Million)
- 7.2.5. Canada
- 7.2.5.1. Market estimates and forecast, by Sports type, 2017 - 2030 (USD Million)
- 7.2.5.2. Market estimates and forecast, by Tourism Type, 2017 - 2030 (USD Million)
- 7.3. Europe
- 7.3.1. Market estimates and forecast, 2017 - 2030 (USD Million)
- 7.3.2. Market estimates and forecast, by Sports type, 2017 - 2030 (USD Million)
- 7.3.3. Market estimates and forecast, by Tourism Type, 2017 - 2030 (USD Million)
- 7.3.4. U.K.
- 7.3.4.1. Market estimates and forecast, by Sports type, 2017 - 2030 (USD Million)
- 7.3.4.2. Market estimates and forecast, by Tourism Type, 2017 - 2030 (USD Million)
- 7.3.5. Germany
- 7.3.5.1. Market estimates and forecast, by Sports type, 2017 - 2030 (USD Million)
- 7.3.5.2. Market estimates and forecast, by Tourism Type, 2017 - 2030 (USD Million)
- 7.3.6. France
- 7.3.6.1. Market estimates and forecast, by Sports type, 2017 - 2030 (USD Million)
- 7.3.6.2. Market estimates and forecast, by Tourism Type, 2017 - 2030 (USD Million)
- 7.4. Asia Pacific
- 7.4.1. Market estimates and forecast, 2017 - 2030 (USD Million)
- 7.4.2. Market estimates and forecast, by Sports type, 2017 - 2030 (USD Million)
- 7.4.3. Market estimates and forecast, by Tourism Type, 2017 - 2030 (USD Million)
- 7.4.4. China
- 7.4.4.1. Market estimates and forecast, by Sports type, 2017 - 2030 (USD Million)
- 7.4.4.2. Market estimates and forecast, by Tourism Type, 2017 - 2030 (USD Million)
- 7.4.5. India
- 7.4.5.1. Market estimates and forecast, by Sports type, 2017 - 2030 (USD Million)
- 7.4.5.2. Market estimates and forecast, by Tourism Type, 2017 - 2030 (USD Million)
- 7.4.6. Japan
- 7.4.6.1. Market estimates and forecast, by Sports type, 2017 - 2030 (USD Million)
- 7.4.6.2. Market estimates and forecast, by Tourism Type, 2017 - 2030 (USD Million)
- 7.5. Central & South America
- 7.5.1. Market estimates and forecast, 2017 - 2030 (USD Million)
- 7.5.2. Market estimates and forecast, by Sports type, 2017 - 2030 (USD Million)
- 7.5.3. Market estimates and forecast, by Tourism Type, 2017 - 2030 (USD Million)
- 7.5.4. Brazil
- 7.5.4.1. Market estimates and forecast, by Sports type, 2017 - 2030 (USD Million)
- 7.5.4.2. Market estimates and forecast, by Tourism Type, 2017 - 2030 (USD Million)
- 7.6. Middles East & Africa
- 7.6.1. Market estimates and forecast, 2017 - 2030 (USD Million)
- 7.6.2. Market estimates and forecast, by Sports type, 2017 - 2030 (USD Million)
- 7.6.3. Market estimates and forecast, by Tourism Type, 2017 - 2030 (USD Million)
- 7.6.4. South Africa
- 7.6.4.1. Market estimates and forecast, by Sports type, 2017 - 2030 (USD Million)
- 7.6.4.2. Market estimates and forecast, by Tourism Type, 2017 - 2030 (USD Million)
Chapter 8. Competitive Analysis
- 8.1. Key global players, recent developments & their impact on the industry
- 8.2. Key Company/Competition Categorization (Key innovators, Market leaders, Emerging players)
- 8.3. Vendor Landscape
- 8.3.1. Key company market share analysis, 2022
Chapter 9. Company Profiles
- 9.1. BAC Sports
- 9.1.1. Company Overview
- 9.1.2. Financial Performance
- 9.1.3. Product type Benchmarking
- 9.1.4. Strategic Initiatives
- 9.2. Inspiresport
- 9.2.1. Company Overview
- 9.2.2. Financial Performance
- 9.2.3. Product type Benchmarking
- 9.3. Gullivers Sports Travel Ltd
- 9.3.1. Company Overview
- 9.3.2. Financial Performance
- 9.3.3. Product type Benchmarking
- 9.3.4. Strategic Initiatives
- 9.4. Dream Team Sports Tour
- 9.4.1. Company Overview
- 9.4.2. Financial Performance
- 9.4.3. Product type Benchmarking
- 9.4.4. Strategic Initiatives
- 9.5. Navigo Sports Tour, LLC
- 9.5.1. Company Overview
- 9.5.2. Financial Performance
- 9.5.3. Product type Benchmarking
- 9.5.4. Strategic Initiatives
- 9.6. Allsports Travel
- 9.6.1. Company Overview
- 9.6.2. Financial Performance
- 9.6.3. Product type Benchmarking
- 9.6.4. Strategic Initiatives
- 9.7. Australian Sports Tours
- 9.7.1. Company Overview
- 9.7.2. Financial Performance
- 9.7.3. Product type Benchmarking
- 9.7.4. Strategic Initiatives
- 9.8. Premium Sport Tours
- 9.8.1. Company Overview
- 9.8.2. Financial Performance
- 9.8.3. Product type Benchmarking
- 9.8.4. Strategic Initiatives
- 9.9. La Vacanza Travel
- 9.9.1. Company Overview
- 9.9.2. Financial Performance
- 9.9.3. Product type Benchmarking
- 9.9.4. Strategic Initiatives
- 9.10. XL Sports Tours
- 9.10.1. Company Overview
- 9.10.2. Financial Performance
- 9.10.3. Product Benchmarking
- 9.10.4. Strategic Initiatives