|
|
市場調査レポート
商品コード
1178600
オミックス研究サービス市場規模、シェア&動向分析レポート:サービス別(ゲノミクス、プロテオミクス)、ビジネス別(病院)、サービス頻度別(単発)、製品別、エンドユース別、地域別、セグメント予測、2023年~2030年Omics Lab Services Market Size, Share & Trends Analysis Report By Services (Genomics, Proteomics), Business (Hospitals), Frequency Of Service (One-off), By Product, By End-use, By Region, And Segment Forecasts, 2023 - 2030 |
||||||
|
|
|||||||
|
● お客様のご希望に応じて、既存データの加工や未掲載情報(例:国別セグメント)の追加などの対応が可能です。 詳細はお問い合わせください。 |
|||||||


| オミックス研究サービス市場規模、シェア&動向分析レポート:サービス別(ゲノミクス、プロテオミクス)、ビジネス別(病院)、サービス頻度別(単発)、製品別、エンドユース別、地域別、セグメント予測、2023年~2030年 |
|
出版日: 2022年12月13日
発行: Grand View Research
ページ情報: 英文 130 Pages
納期: 2~10営業日
|
- 全表示
- 概要
- 図表
- 目次
オミックス研究サービスの市場成長と動向
Grand View Research, Inc.の最新レポートによると、オミックス研究サービスの世界市場規模は、2030年までに1940億4000万米ドルに達し、予測期間中に13.72%のCAGRを記録すると予測されています。市場の開拓は、臨床ワークフローへのゲノムデータの統合の進展と、消費者直結型オミックスの採用が進んでいることに起因しています。さらに、早期疾病診断テストに対する需要の高まりや、政府の資金提供の増加に伴う技術的進歩が、市場全体の成長をさらに後押ししています。
ヒトの疾病管理やその他の非従来型アプリケーションにおけるオミックスの可能性に対する認識の高まりが、オミックスデータの導入に拍車をかけています。その結果、入手可能な遺伝子情報を活用して製品や技術を導入しようとする企業間の競争が激化し、市場の十分な成長経路を活用することができるようになりました。また、高度なラボラトリー分析は、精密医療や個別化医療の発展を支え、一般的な患者のケアにとどまらない影響力を持つ。腫瘍学の分野ではすでに徹底的な進歩が見られ、オミックスやシングルセルマイクロ技術の開発は、今後の患者中心のアプローチへの進展に大きく寄与しています。
さらに、腫瘍学分野はオミックス研究の恩恵を最も受けており、NGS臨床検査の新しい用途の1つは、血漿からの循環腫瘍DNA(ctDNA)の定量化です。Cancer Personalized Profiling by deep Sequencingのような数多くのNGS技術が使用されることがあります。ハイスループット RNAシーケンスの開発により、生物学および臨床研究におけるトランスクリプトミクスの重要性が浮き彫りになってきました。NGS技術によるRNA配列決定やマイクロアレイは、トランスクリプトミクスを行う2つの方法です。プロテオミクスとメタボロミクスは、NMRとMS技術の改善によって大きく特徴付けられた2つの領域です。
さらに、市場で事業を展開する主要企業は、オミックス技術を早期診断に取り入れることに注力しています。例えば、2021年5月、Burning Rock Biotech Limitedは、中国で初の汎がん、マルチオミックス早期検出研究であるPRESCIENTを開始しました。2022年3月、PrognomiQは、がんの早期検出のためのマルチオミクスの開発を進めるために4600万米ドルを投資しました。2022年9月、Bertis社が卵巣がん診断のための新規バイオマーカーのプロテオミクス研究を開始。さらに、2022年7月には、ミッションバイオ社が、血液がんにおけるシングルセル・マルチオミクスに基づくMRD検出のためのTapestriプラットフォームを発表しました。早期診断ツールの開発のためのオミックス分野におけるこれらの取り組みや研究は、オミックス研究サービス市場全体の成長をさらに後押ししています。
オミックス研究サービス市場レポートハイライト
エピジェネティックセグメントは予測期間中に最も速い成長を示すと予想され、これはエピジェネティック分析が提供する将来の可能性に起因することができる
診断ラボ分野が2021年に最大の市場シェアを占めたのは、検査の増加や診断テストを実行するための幅広いリソースの利用が可能になったためである
ハードウェア機器部門は、2021年にオミックス研究サービス市場を独占し、予測期間中に最も速い成長率を示すと予測されています。これは、ハードウェア機器の開発を通じてゲノミクスとトランスクリプトミクスの技術的進歩が急速に進んだためです。
北米が最大の市場シェアを占め、これは高い精度、感度、特異性による遺伝子検査の採用が増加していることに起因している
目次
第1章 調査手法と範囲
- 市場セグメンテーション
- 調査手法
- 情報調達
- 購入したデータベース
- 二次情報
- 1次調査
- 1次調査の詳細
- 情報またはデータ分析
- データ分析モデル
- 市場の策定と検証
- モデルの詳細
- コモディティフロー分析
- アプローチ1:コモディティフローアプローチ
- アプローチ2:ボトムアップアプローチを使用した国ごとの市場推定
- コモディティフロー分析
- 世界市場:CAGR計算
- 調査の仮定
- 二次情報のリスト
- 一次情報のリスト
- 目的
- 略語一覧
第2章 エグゼクティブサマリー
- 市場のスナップショット
- セグメントのスナップショット
- 競合情勢のスナップショット
第3章 オミックス研究サービス市場の変数、動向、および範囲
- オミックス研究サービスの市場系列の見通し
- 親市場の見通し
- 診断市場
- バイオテクノロジー市場
- 親市場の見通し
- 浸透と成長の見通しのマッピング
- 市場促進要因分析
- ゲノミクスデータの臨床ワークフローへの統合の進展
- よりターゲットを絞ったパーソナライズされたヘルスケア
- 新生児遺伝子スクリーニングプログラムの成長
- 非侵襲的がんスクリーニングの進歩
- D2C Omicsの採用の増加
- 早期疾患診断検査の需要の高まり
- 技術の進歩
- サービスの需要/採用の増加
- さまざまな企業の参加の増加
- 政府資金の増加
- ゲノミクスデータの臨床ワークフローへの統合の進展
- 市場抑制要因分析
- 熟練した専門家の不足
- オミクス技術の実装が遅い
- SWOT分析、要因別(政治と法律、経済、技術)
- ポーターのファイブフォース分析
- 規制の枠組み
第4章 オミックス研究サービス市場-セグメント分析、サービス別、2018年から2030年(100万米ドル)
- 定義と範囲
- オミックス研究サービス市場:サービス変動分析
- ゲノミクス
- プロテオミクス
- トランスクリプトミクス
- トランスクリプトームIn-Vivo解析(Tiva)
- Ihc
- 顕微鏡ベースのRnsイメージング技術
- メタボロミクス
- エピジェネティクス
- エピジェネティックス市場の推定値と予測、2018~2030年(100万米ドル)
第5章 オミックス研究サービス市場-セグメント分析、ビジネス別、2018年から2030年(100万米ドル)
- オミックス研究サービス市場:事業変動分析
- 病院
- 調査
- 診断ラボ
第6章 オミックス研究サービス市場-セグメント分析、サービスの頻度別、2018年から2030年(100万米ドル)
- 定義と範囲
- オミックス研究サービス市場:サービス変動分析の頻度
- ワンオフ
- 繰り返す
- 連続
第7章 オミックス研究サービス市場-セグメント分析、製品別、2018年から2030年(100万米ドル)
- 定義と範囲
- オミックス研究サービス市場:製品変動分析
- ハードウェア機器
- 楽器
- 消耗品・試薬
- テスト/ラボ(サービス)
- 分析・解釈
- ハードウェア機器
第8章 オミックス研究サービス市場-セグメント分析、最終用途別、2018年から2030年(100万米ドル)
- 定義と範囲
- オミックス研究サービス市場:最終用途の変動分析
- がん
- ファーマコ
- 処方
- 非処方箋(Otc)
- 生殖
- その他の遺伝病
- フォレンジック
- フォレンジック市場の推定値と予測、2018~2030年(100万米ドル)
- 人口学
- スキンケア
- 栄養
- ビタミンとサプリメント
- 系譜
- 家系図市場推計と予測、2018年から2030年(100万米ドル)
- その他のカテゴリー
- その他のカテゴリーの市場推定値と予測、2018~2030年(100万米ドル)
第9章 地域ビジネス分析
- 定義と範囲
- 地域市場シェア分析、2021年および2030年
- 地域市場ダッシュボード
- 地域市場のスナップショット
- SWOT分析、要因別(政治と法律、経済と技術)
- 北米
- 欧州
- アジア太平洋地域
- ラテンアメリカ
- メア
- 市場規模、予測、トレンド分析、2021年から2030年
- 北米
- 米国
- 主要な国のダイナミクス
- 規制の枠組み
- 競合シナリオ
- 最近の開発
- 投資シナリオ
- カナダ
- 主要な国のダイナミクス
- 規制の枠組み
- 競合シナリオ
- 最近の開発
- 投資シナリオ
- 米国
- 欧州
- 英国
- 主要な国のダイナミクス
- 規制の枠組み
- 競合シナリオ
- 最近の開発
- 投資シナリオ
- ドイツ
- 主要な国のダイナミクス
- 規制の枠組み
- 競合シナリオ
- 最近の開発
- 投資シナリオ
- スペイン
- 主要な国のダイナミクス
- 規制の枠組み
- 競合シナリオ
- 最近の開発
- 投資シナリオ
- フランス
- 主要な国のダイナミクス
- 規制の枠組み
- 競合シナリオ
- 最近の開発
- 投資シナリオ
- イタリア
- 主要な国のダイナミクス
- 規制の枠組み
- 競合シナリオ
- 最近の開発
- 投資シナリオ
- ロシア
- 規制の枠組み
- 競合シナリオ
- 最近の開発
- 投資シナリオ
- デンマーク
- 主要な国のダイナミクス
- 規制の枠組み
- 競合シナリオ
- 最近の開発
- 投資シナリオ
- スウェーデン
- 主要な国のダイナミクス
- 規制の枠組み
- 競合シナリオ
- 最近の開発
- 投資シナリオ
- ノルウェー
- 主要な国のダイナミクス
- 規制の枠組み
- 競合シナリオ
- 最近の開発
- 投資シナリオ
- 英国
- アジア太平洋地域
- 日本
- 主要な国のダイナミクス
- 規制の枠組み
- 競合シナリオ
- 最近の開発
- 投資シナリオ
- 中国
- 主要な国のダイナミクス
- 規制の枠組み
- 競合シナリオ
- 最近の開発
- 投資シナリオ
- インド
- 主要な国のダイナミクス
- 規制の枠組み
- 競合シナリオ
- 最近の開発
- 投資シナリオ
- 韓国
- 主要な国のダイナミクス
- 規制の枠組み
- 競合シナリオ
- 最近の開発
- 投資シナリオ
- タイ
- 主要な国のダイナミクス
- 規制の枠組み
- 競合シナリオ
- 最近の開発
- 投資シナリオ
- オーストラリア
- 主要な国のダイナミクス
- 規制の枠組み
- 競合シナリオ
- 最近の開発
- 投資シナリオ
- 日本
- ラテンアメリカ
- ブラジル
- 主要な国のダイナミクス
- 規制の枠組み
- 競合シナリオ
- 最近の開発
- 投資シナリオ
- メキシコ
- 主要な国のダイナミクス
- 規制の枠組み
- 競合シナリオ
- 最近の開発
- 投資シナリオ
- アルゼンチン
- 主要な国のダイナミクス
- 規制の枠組み
- 競合シナリオ
- 最近の開発
- 投資シナリオ
- ブラジル
- メア
- 南アフリカ
- 主要な国のダイナミクス
- 規制の枠組み
- 競合シナリオ
- 最近の開発
- 投資シナリオ
- サウジアラビア
- 主要な国のダイナミクス
- 規制の枠組み
- 競合シナリオ
- 最近の開発
- 投資シナリオ
- アラブ首長国連邦
- 主要な国のダイナミクス
- 規制の枠組み
- 競合シナリオ
- 最近の開発
- 投資シナリオ
- クウェート
- 主要な国のダイナミクス
- 規制の枠組み
- 競合シナリオ
- 最近の開発
- 投資シナリオ
- 南アフリカ
第10章 競合分析
- 企業/競合の分類(主要なイノベーター、マーケットリーダー、新興企業)
- 戦略的枠組み
- 市場参加の分類
- 主要な市場参入企業別最近の動向と影響分析
- 会社のポジション分析
- 代理店一覧
- 主要顧客
- 公開会社
- 非公開会社
- ケーススタディ
- ケーススタディ:非小細胞肺がん(Nsclc)の治療意思決定における血液ベースのNGS
- 急性骨髄性白血病の治療選択に対するNGSの影響
- ケーススタディ:がん治療の反応予測
- 課題:免疫チェックポイント阻害剤療法の反応を理解する
- 洞察:メタボロミクスは、免疫チェックポイント阻害剤療法に対するレスポンダーの異なる代謝産物を特定します
- 解決策:免疫チェックポイント阻害剤療法の応答者は、非応答者と比較して異なるメタボロームプロファイルを持っています
- 結果:メタボロミクスは治療反応の予測バイオマーカーを特定
- ケーススタディ:臨床試験のデザイン
- 課題
- メタボロンインサイト
- ソリューション
- 結果
- ケーススタディ:ピロリ菌がどのように形を成すか
- 課題
- アプローチ
- 結果
- ケーススタディ:ゲノム診断におけるCnvとSnvの複合解析
- 分析
- 結果:
- 結論
- ケーススタディ:非小細胞肺がん(Nsclc)の治療意思決定における血液ベースのNGS
第11章 企業プロファイル
- 企業プロファイル
- AGILENT TECHNOLOGIES, INC.
- 会社概要
- 財務実績
- 製品のベンチマーク
- 戦略的イニシアチブ
- BEIJING GENOMICS INSTITUTE(BGI)
- 会社概要
- コンプリートゲノミクスインコーポレーテッド
- 製品のベンチマーク
- 戦略的イニシアチブ
- Q2 SOLUTIONS
- 会社概要
- 製品のベンチマーク
- 戦略的イニシアチブ
- SPECTRUS
- 会社概要
- 製品のベンチマーク
- FLOMICS BIOTECH
- 会社概要
- 製品のベンチマーク
- 戦略的イニシアチブ
- PHENOSWITCH BIOSCIENCE
- 会社概要
- 製品のベンチマーク
- 戦略的イニシアチブ
- QIAGEN
- 会社概要
- 財務実績
- 製品のベンチマーク
- 戦略的イニシアチブ
- QUEST DIAGNOSTICS INCORPORATED
- 会社概要
- 財務実績
- 製品のベンチマーク
- 戦略的イニシアチブ
- THERMO FISHER SCIENTIFIC, INC.
- 会社概要
- ライフテクノロジーズ株式会社
- アフィメトリックス
- アプライドバイオシステムズ
- 財務実績
- 製品のベンチマーク
- 戦略的イニシアチブ
- ILLUMINA, INC
- 会社概要
- 財務実績
- 製品のベンチマーク
- 戦略的イニシアチブ
- AGILENT TECHNOLOGIES, INC.
List of Tables
- Table 1 List of Secondary Sources
- Table 2 List of Abbreviations
- Table 3 Regulatory Framework
- Table 4 Global Omics Lab Services Market, By Region, 2018 - 2030 (USD Million)
- Table 5 Global Omics Lab Services Market, By Services, 2018 - 2030 (USD Million)
- Table 6 Global Omics Lab Services Market, By Business, 2018 - 2030 (USD Million)
- Table 7 Global Omics Lab Services Market, By Frequency of Service, 2018 - 2030 (USD Million)
- Table 8 Global Omics Lab Services Market, By Product, 2018 - 2030 (USD Million)
- Table 9 Global Omics Lab Services Market, By End Use, 2018 - 2030 (USD Million)
- Table 10 North America Omics Lab Services Market, By Country, 2018 - 2030 (USD Million)
- Table 11 North America Omics Lab Services Market, By Services, 2018 - 2030 (USD Million)
- Table 12 North America Omics Lab Services Market, By Business, 2018 - 2030 (USD Million)
- Table 13 North America Omics Lab Services Market, By Frequency of Service, 2018 - 2030 (USD Million)
- Table 14 North America Omics Lab Services Market, By Product, 2018 - 2030 (USD Million)
- Table 15 North America Omics Lab Services Market, By End-use, 2018 - 2030 (USD Million)
- Table 16 U.S. Omics Lab Services Market, By Services, 2018 - 2030 (USD Million)
- Table 17 U.S. Omics Lab Services Market, By Business, 2018 - 2030 (USD Million)
- Table 18 U.S. Omics Lab Services Market, By Frequency of Service, 2018 - 2030 (USD Million)
- Table 19 U.S. Omics Lab Services Market, By Product, 2018 - 2030 (USD Million)
- Table 20 U.S. Omics Lab Services Market, By End Use, 2018 - 2030 (USD Million)
- Table 21 Canada Omics Lab Services Market, By Services, 2018 - 2030 (USD Million)
- Table 22 Canada Omics Lab Services Market, By Business, 2018 - 2030 (USD Million)
- Table 23 Canada Omics Lab Services Market, By Frequency of Service, 2018 - 2030 (USD Million)
- Table 24 Canada Omics Lab Services Market, By Product, 2018 - 2030 (USD Million)
- Table 25 Canada Omics Lab Services Market, By End Use, 2018 - 2030 (USD Million)
- Table 26 Europe Omics Lab Services Market, By Country, 2018 - 2030 (USD Million)
- Table 27 Europe Omics Lab Services Market, By Services, 2018 - 2030 (USD Million)
- Table 28 Europe Omics Lab Services Market, By Business, 2018 - 2030 (USD Million)
- Table 29 Europe Omics Lab Services Market, By Frequency of Service, 2018 - 2030 (USD Million)
- Table 30 Europe Omics Lab Services Market, By Product, 2018 - 2030 (USD Million)
- Table 31 Europe Omics Lab Services Market, By End Use, 2018 - 2030 (USD Million)
- Table 32 UK Omics Lab Services Market, By Services, 2018 - 2030 (USD Million)
- Table 33 UK Omics Lab Services Market, By Business, 2018 - 2030 (USD Million)
- Table 34 UK Omics Lab Services Market, By Frequency of Service, 2018 - 2030 (USD Million)
- Table 35 UK Omics Lab Services Market, By Product, 2018 - 2030 (USD Million)
- Table 36 UK Omics Lab Services Market, By End Use, 2018 - 2030 (USD Million)
- Table 37 Germany Omics Lab Services Market, By Services, 2018 - 2030 (USD Million)
- Table 38 Germany Omics Lab Services Market, By Business, 2018 - 2030 (USD Million)
- Table 39 Germany Omics Lab Services Market, By Frequency of Service, 2018 - 2030 (USD Million)
- Table 40 Germany Omics Lab Services Market, By Product, 2018 - 2030 (USD Million)
- Table 41 Germany Omics Lab Services Market, By End Use, 2018 - 2030 (USD Million)
- Table 42 France Omics Lab Services Market, By Services, 2018 - 2030 (USD Million)
- Table 43 France Omics Lab Services Market, By Business, 2018 - 2030 (USD Million)
- Table 44 France Omics Lab Services Market, By Frequency of Service, 2018 - 2030 (USD Million)
- Table 45 France Omics Lab Services Market, By Product, 2018 - 2030 (USD Million)
- Table 46 France Omics Lab Services Market, By End Use, 2018 - 2030 (USD Million)
- Table 47 Spain Omics Lab Services Market, By Services, 2018 - 2030 (USD Million)
- Table 48 Spain Omics Lab Services Market, By Business, 2018 - 2030 (USD Million)
- Table 49 Spain Omics Lab Services Market, By Frequency of Service, 2018 - 2030 (USD Million)
- Table 50 Spain Omics Lab Services Market, By Product, 2018 - 2030 (USD Million)
- Table 51 Spain Omics Lab Services Market, By End Use, 2018 - 2030 (USD Million)
- Table 52 Italy Omics Lab Services Market, By Services, 2018 - 2030 (USD Million)
- Table 53 Italy Omics Lab Services Market, By Business, 2018 - 2030 (USD Million)
- Table 54 Italy Omics Lab Services Market, By Frequency of Service, 2018 - 2030 (USD Million)
- Table 55 Italy Omics Lab Services Market, By Product, 2018 - 2030 (USD Million)
- Table 56 Italy Omics Lab Services Market, By End Use, 2018 - 2030 (USD Million)
- Table 57 Denmark Omics Lab Services Market, By Services, 2018 - 2030 (USD Million)
- Table 58 Denmark Omics Lab Services Market, By Business, 2018 - 2030 (USD Million)
- Table 59 Denmark Omics Lab Services Market, By Frequency of Service, 2018 - 2030 (USD Million)
- Table 60 Denmark Omics Lab Services Market, By Product, 2018 - 2030 (USD Million)
- Table 61 Denmark Omics Lab Services Market, By End Use, 2018 - 2030 (USD Million)
- Table 62 Sweden Omics Lab Services Market, By Services, 2018 - 2030 (USD Million)
- Table 63 Sweden Omics Lab Services Market, By Business, 2018 - 2030 (USD Million)
- Table 64 Sweden Omics Lab Services Market, By Frequency of Service, 2018 - 2030 (USD Million)
- Table 65 Sweden Omics Lab Services Market, By Product, 2018 - 2030 (USD Million)
- Table 66 Sweden Omics Lab Services Market, By End Use, 2018 - 2030 (USD Million)
- Table 67 Norway Omics Lab Services Market, By Services, 2018 - 2030 (USD Million)
- Table 68 Norway Omics Lab Services Market, By Business, 2018 - 2030 (USD Million)
- Table 69 Norway Omics Lab Services Market, By Frequency of Service, 2018 - 2030 (USD Million)
- Table 70 Norway Omics Lab Services Market, By Product, 2018 - 2030 (USD Million)
- Table 71 Norway Omics Lab Services Market, By End Use, 2018 - 2030 (USD Million)
- Table 72 Asia Pacific Omics Lab Services Market, By Country, 2018 - 2030 (USD Million)
- Table 73 Asia Pacific Omics Lab Services Market, By Services, 2018 - 2030 (USD Million)
- Table 74 Asia Pacific Omics Lab Services Market, By Business, 2018 - 2030 (USD Million)
- Table 75 Asia Pacific Omics Lab Services Market, By Frequency of Service, 2018 - 2030 (USD Million)
- Table 76 Asia Pacific Omics Lab Services Market, By Product, 2018 - 2030 (USD Million)
- Table 77 Asia Pacific Omics Lab Services Market, By End Use, 2018 - 2030 (USD Million)
- Table 78 Japan Omics Lab Services Market, By Services, 2018 - 2030 (USD Million)
- Table 79 Japan Omics Lab Services Market, By Business, 2018 - 2030 (USD Million)
- Table 80 Japan Omics Lab Services Market, By Frequency of Service, 2018 - 2030 (USD Million)
- Table 81 Japan Omics Lab Services Market, By Product, 2018 - 2030 (USD Million)
- Table 82 Japan Omics Lab Services Market, By End Use, 2018 - 2030 (USD Million)
- Table 83 China Omics Lab Services Market, By Services, 2018 - 2030 (USD Million)
- Table 84 China Omics Lab Services Market, By Business, 2018 - 2030 (USD Million)
- Table 85 China Omics Lab Services Market, By Frequency of Service, 2018 - 2030 (USD Million)
- Table 86 China Omics Lab Services Market, By Product, 2018 - 2030 (USD Million)
- Table 87 China Omics Lab Services Market, By End Use, 2018 - 2030 (USD Million)
- Table 88 Australia Omics Lab Services Market, By Services, 2018 - 2030 (USD Million)
- Table 89 Australia Omics Lab Services Market, By Business, 2018 - 2030 (USD Million)
- Table 90 Australia Omics Lab Services Market, By Frequency of Service, 2018 - 2030 (USD Million)
- Table 91 Australia Omics Lab Services Market, By Product, 2018 - 2030 (USD Million)
- Table 92 Australia Omics Lab Services Market, By End Use, 2018 - 2030 (USD Million)
- Table 93 Thailand Omics Lab Services Market, By Services, 2018 - 2030 (USD Million)
- Table 94 Thailand Omics Lab Services Market, By Business, 2018 - 2030 (USD Million)
- Table 95 Thailand Omics Lab Services Market, By Frequency of Service, 2018 - 2030 (USD Million)
- Table 96 Thailand Omics Lab Services Market, By Product, 2018 - 2030 (USD Million)
- Table 97 Thailand Omics Lab Services Market, By End Use, 2018 - 2030 (USD Million)
- Table 98 India Omics Lab Services Market, By Services, 2018 - 2030 (USD Million)
- Table 99 India Omics Lab Services Market, By Business, 2018 - 2030 (USD Million)
- Table 100 India Omics Lab Services Market, By Frequency of Service, 2018 - 2030 (USD Million)
- Table 101 India Omics Lab Services Market, By Product, 2018 - 2030 (USD Million)
- Table 102 India Omics Lab Services Market, By End Use, 2018 - 2030 (USD Million)
- Table 103 South Korea Omics Lab Services Market, By Services, 2018 - 2030 (USD Million)
- Table 104 South Korea Omics Lab Services Market, By Business, 2018 - 2030 (USD Million)
- Table 105 South Korea Omics Lab Services Market, By Frequency of Service, 2018 - 2030 (USD Million)
- Table 106 South Korea Omics Lab Services Market, By Product, 2018 - 2030 (USD Million)
- Table 107 South Korea Omics Lab Services Market, By End Use, 2018 - 2030 (USD Million)
- Table 108 Latin America Omics Lab Services Market, By Country, 2018 - 2030 (USD Million)
- Table 109 Latin America Omics Lab Services Market, By Services, 2018 - 2030 (USD Million)
- Table 110 Latin America Omics Lab Services Market, By Business, 2018 - 2030 (USD Million)
- Table 111 Latin America Omics Lab Services Market, By Frequency of Service, 2018 - 2030 (USD Million)
- Table 112 Latin America Omics Lab Services Market, By Product, 2018 - 2030 (USD Million)
- Table 113 Latin America Omics Lab Services Market, By End Use, 2018 - 2030 (USD Million)
- Table 114 Mexico Omics Lab Services Market, By Services, 2018 - 2030 (USD Million)
- Table 115 Mexico Omics Lab Services Market, By Business, 2018 - 2030 (USD Million)
- Table 116 Mexico Omics Lab Services Market, By Frequency of Service, 2018 - 2030 (USD Million)
- Table 117 Mexico Omics Lab Services Market, By Product, 2018 - 2030 (USD Million)
- Table 118 Mexico Omics Lab Services Market, By End Use, 2018 - 2030 (USD Million)
- Table 119 Brazil Omics Lab Services Market, By Services, 2018 - 2030 (USD Million)
- Table 120 Brazil Omics Lab Services Market, By Business, 2018 - 2030 (USD Million)
- Table 121 Brazil Omics Lab Services Market, By Frequency of Service, 2018 - 2030 (USD Million)
- Table 122 Brazil Omics Lab Services Market, By Product, 2018 - 2030 (USD Million)
- Table 123 Brazil Omics Lab Services Market, By End Use, 2018 - 2030 (USD Million)
- Table 124 Argentina Omics Lab Services Market, By Services, 2018 - 2030 (USD Million)
- Table 125 Argentina Omics Lab Services Market, By Business, 2018 - 2030 (USD Million)
- Table 126 Argentina Omics Lab Services Market, By Frequency of Service, 2018 - 2030 (USD Million)
- Table 127 Argentina Omics Lab Services Market, By Product, 2018 - 2030 (USD Million)
- Table 128 Argentina Omics Lab Services Market, By End Use, 2018 - 2030 (USD Million)
- Table 129 MEA Omics Lab Services Market, By Country, 2018 - 2030 (USD Million)
- Table 130 MEA Omics Lab Services Market, By Services, 2018 - 2030 (USD Million)
- Table 131 MEA Omics Lab Services Market, By Business, 2018 - 2030 (USD Million)
- Table 132 MEA Omics Lab Services Market, By Frequency of Service, 2018 - 2030 (USD Million)
- Table 133 MEA Omics Lab Services Market, By Product, 2018 - 2030 (USD Million)
- Table 134 MEA Omics Lab Services Market, By End Use, 2018 - 2030 (USD Million)
- Table 135 South Africa Omics Lab Services Market, By Services, 2018 - 2030 (USD Million)
- Table 136 South Africa Omics Lab Services Market, By Business, 2018 - 2030 (USD Million)
- Table 137 South Africa Omics Lab Services Market, By Frequency of Service, 2018 - 2030 (USD Million)
- Table 138 South Africa Omics Lab Services Market, By Product, 2018 - 2030 (USD Million)
- Table 139 South Africa Omics Lab Services Market, By End Use, 2018 - 2030 (USD Million)
- Table 140 South Africa Omics Lab Services Market, By End-use, 2018 - 2030 (USD Million)
- Table 141 Saudi Arabia Omics Lab Services Market, By Services, 2018 - 2030 (USD Million)
- Table 142 Saudi Arabia Omics Lab Services Market, By Business, 2018 - 2030 (USD Million)
- Table 143 Saudi Arabia Omics Lab Services Market, By Frequency of Service, 2018 - 2030 (USD Million)
- Table 144 Saudi Arabia Omics Lab Services Market, By Product, 2018 - 2030 (USD Million)
- Table 145 Saudi Arabia Omics Lab Services Market, By End Use, 2018 - 2030 (USD Million)
- Table 146 Saudi Arabia Omics Lab Services Market, By End-use, 2018 - 2030 (USD Million)
- Table 147 UAE Omics Lab Services Market, By Services, 2018 - 2030 (USD Million)
- Table 148 UAE Omics Lab Services Market, By Business, 2018 - 2030 (USD Million)
- Table 149 UAE Omics Lab Services Market, By Frequency of Service, 2018 - 2030 (USD Million)
- Table 150 UAE Omics Lab Services Market, By Product, 2018 - 2030 (USD Million)
- Table 151 UAE Omics Lab Services Market, By End Use, 2018 - 2030 (USD Million)
- Table 152 Kuwait Omics Lab Services Market, By Services, 2018 - 2030 (USD Million)
- Table 153 Kuwait Omics Lab Services Market, By Business, 2018 - 2030 (USD Million)
- Table 154 Kuwait Omics Lab Services Market, By Frequency of Service, 2018 - 2030 (USD Million)
- Table 155 Kuwait Omics Lab Services Market, By Product, 2018 - 2030 (USD Million)
- Table 156 Kuwait Omics Lab Services Market, By End Use, 2018 - 2030 (USD Million)
List of Figures
- Fig. 1 Omics lab services market segmentation
- Fig. 2 Market research process
- Fig. 3 Data triangulation techniques
- Fig. 4 Primary research pattern
- Fig. 5 Market research approaches
- Fig. 6 Value-chain-based sizing & forecasting
- Fig. 7 QFD modeling for market share assessment
- Fig. 8 Market formulation & validation
- Fig. 9 Market snapshot
- Fig. 10 Segment snapshot (Service, Business)
- Fig. 11 Segment snapshot (Frequency of Service, Product)
- Fig. 12 Segment snapshot (End-Use)
- Fig. 13 Competitive landscape snapshot
- Fig. 14 Penetration & growth prospect mapping
- Fig. 15 Omics lab services market driver impact
- Fig. 16 Categories of tests offered by DTC companies
- Fig. 17 Benefits of earlier detection of cancer
- Fig. 18 Use of cancer biomarkers in cancer management
- Fig. 19 Adoption of Omics services
- Fig. 20 Omics lab services market restraint impact
- Fig. 21 SWOT analysis, by factor (Political & legal, economic, and technological)
- Fig. 22 Porter's five forces analysis
- Fig. 23 Omics lab services market: Service outlook and key takeaways
- Fig. 24 Omics lab services market: Service movement analysis
- Fig. 25 Genomics Players
- Fig. 26 Genomics lab services market estimates and forecast, 2018 - 2030 (USD Million)
- Fig. 27 Proteomics Players
- Fig. 28 Proteomics Landscape
- Fig. 29 Proteomics lab services market estimates and forecast, 2018 - 2030 (USD Million)
- Fig. 30 Transcriptomics lab services market estimates and forecast, 2018 - 2030 (USD Million)
- Fig. 31 Metabolomics lab services market estimates and forecast, 2018 - 2030 (USD Million)
- Fig. 32 Epigenetics market estimates and forecast, 2018 - 2030 (USD Million)
- Fig. 33 Omics lab services market : Business outlook and key takeaways
- Fig. 34 Omics lab services market: Business movement analysis
- Fig. 35 Hospitals market estimates and forecast, 2018 - 2030 (USD Million)
- Fig. 36 Research institutes market estimates and forecast, 2018 - 2030 (USD Million)
- Fig. 37 Diagnostic labs market estimates and forecast, 2018 - 2030 (USD Million)
- Fig. 38 Omics lab services market : Frequency of service outlook and key takeaways
- Fig. 39 Omics lab services market: Frequency of service movement analysis
- Fig. 40 One-off market estimates and forecast, 2018 - 2030 (USD Million)
- Fig. 41 Repeat market estimates and forecast, 2018 - 2030 (USD Million)
- Fig. 42 Continuous market estimates and forecast,, 2018 - 2030 (USD Million)
- Fig. 43 Omics lab services market : Product outlook and key takeaways
- Fig. 44 Omics lab services market: Product movement analysis
- Fig. 45 Hardware equipment market estimates and forecast, 2018 - 2030 (USD Million)
- Fig. 46 Testing/Lab market estimates and forecast, 2018 - 2030 (USD Million)
- Fig. 47 Analytics/Interpretation market estimates and forecast,, 2018 - 2030 (USD Million)
- Fig. 48 Omics lab services market: End-use outlook and key takeaways
- Fig. 49 Omics lab services market: End-use movement analysis
- Fig. 50 Multi-omics approach in cancer screening
- Fig. 51 Cancer market estimates and forecast, 2018 - 2030 (USD Million)
- Fig. 52 Pharmaco market estimates and forecast, 2018 - 2030 (USD Million)
- Fig. 53 Prescription market estimates and forecast, 2018 - 2030 (USD Million)
- Fig. 54 Non-Prescription market estimates and forecast, 2018 - 2030 (USD Million)
- Fig. 55 Reproductive market estimates and forecast, 2018 - 2030 (USD Million)
- Fig. 56 Other genetic disease market estimates and forecast, 2018 - 2030 (USD Million)
- Fig. 57 Relationship between omics and phenotypes
- Fig. 58 Forensics market estimates and forecast, 2018 - 2030 (USD Million)
- Fig. 59 Population studies market estimates and forecast, 2018 - 2030 (USD Million)
- Fig. 60 Skincare market estimates and forecast, 2018 - 2030 (USD Million)
- Fig. 61 Nutrition market estimates and forecast, 2018 - 2030 (USD Million)
- Fig. 62 Vitamins and supplements market estimates and forecast, 2018 - 2030 (USD Million)
- Fig. 63 Genealogy market estimates and forecast, 2018 - 2030 (USD Million)
- Fig. 64 Other categories market estimates and forecast, 2018 - 2030 (USD Million)
- Fig. 65 Regional marketplace: Key takeaway
- Fig. 66 Omics lab services market: Regional movement analysis
- Fig. 67 Global omics lab services market, 2018 - 2030 (USD Million)
- Fig. 68 North America omics lab services market, 2018 - 2030 (USD Million)
- Fig. 69 Europe omics lab services market, 2018 - 2030 (USD Million)
- Fig. 70 Asia Pacific omics lab services market, 2018 - 2030 (USD Million)
- Fig. 71 Latin America omics lab services market, 2018 - 2030 (USD Million)
- Fig. 72 Middle East & Africa omics lab services market, 2018 - 2030 (USD Million)
- Fig. 73 Australia omics lab services market, 2018 - 2030 (USD Million)
- Fig. 74 Singapore omics lab services market, 2018 - 2030 (USD Million)
- Fig. 75 GCC omics lab services market, 2018 - 2030 (USD Million)
- Fig. 76 UAE omics lab services market, 2018 - 2030 (USD Million)
- Fig. 77 Rest of GCC omics lab services market, 2018 - 2030 (USD Million)
- Fig. 78 UK omics lab services market, 2018 - 2030 (USD Million)
- Fig. 79 Thailand omics lab services market, 2018 - 2030 (USD Million)
- Fig. 80 ASEAN countries omics lab services market, 2018 - 2030 (USD Million)
- Fig. 81 Ansoff Matrix
- Fig. 82 Strategy mapping
- Fig. 83 Companies operating in the market
- Fig. 84 Potentially actionable genes considered during the study
- Fig. 85 Study results
- Fig. 86 Workflow overview of tiered analysis approach developed at UMC Utrecht and implemented with Alissa Interpret
- Fig. 87 Results of the tiered approach
Omics Lab Services Market Growth & Trends:
The global omics lab services market size is expected to reach USD 194.04 billion by 2030, registering CAGR of 13.72% during the forecast period, according to a new report by Grand View Research, Inc. The development of the market is attributed to growing integration of the genomics data into clinical workflow and rising adoption of direct-to-consumer omics. Moreover, rising demand for early disease diagnostic test, technological advancements aided with increasing government funding is further propelling growth of the overall market.
Growing recognition of omics' potential in human disease management and other nonconventional applications has fueled the implementation of omics data. This, in turn, has increased competition among firms to introduce products and technologies by leveraging available genetic information, capitalizing on the ample growth avenues in the market. Advanced laboratory analytics also support the development of precision and personalized medicine, which has an influence beyond general patient care. Thorough progress has already been made in the field of oncology, and developments in omics and single-cell micro technology have greatly benefited progress toward upcoming patient-centered approach.
Moreover, the field of oncology has benefited most from omics research, and one newly developed use of NGS clinical tests is for the quantification of circulating tumor DNA (ctDNA) from plasma. Numerous NGS technologies, such as Cancer Personalized Profiling by deep Sequencing, may be used. High-throughput RNA sequencing developments have brought light the importance of transcriptomics in biological and clinical research. RNA sequencing using NGS technologies or microarrays are two ways to perform transcriptomics. Proteomics and metabolomics are two domains that have been significantly characterized by improvements in NMR and MS technologies.
Furthermore, key players operating in the market are focusing on incorporating omics technology in early diagnosis. For instance, in May 2021, Burning Rock Biotech Limited launched PRESCIENT, first pan cancer, multi omics early detection study in China. In March 2022, PrognomiQ invested USD 46.0 million in advancing development of multiomics for early detection of cancer. In September 2022, Bertis launched Proteomic based research of its new biomarkers for diagnosis of ovarian cancer. Moreover, in July 2022, Mission Bio, Inc. launched Tapestri platform for single cell multiomics-based MRD detection in blood cancers. These initiatives and research in the field of omics for the development of early diagnosis tools is further propelling the overall omics labs services market growth.
Omics Lab Services Market Report Highlights:
- Epigenetic segment is expected to show fastest growth during the forecast period which can be attributed to the future potential offered by epigenetic analysis
- Diagnostic labs segment held the largest market share in 2021 owing to the rising testing and availability of the wide range of resources for performing diagnostic tests
- Hardware equipment segment dominated the omics lab services market in 2021 and is anticipated to show at fastest growth rate during the forecast period owing to Rapid technological advancements in genomics and transcriptomics through the development of hardware equipments
- North America held the largest market share which can be attributed to the increasing adoption of genetic testing due to its high accuracy, sensitivity, and specificity
Table of Contents
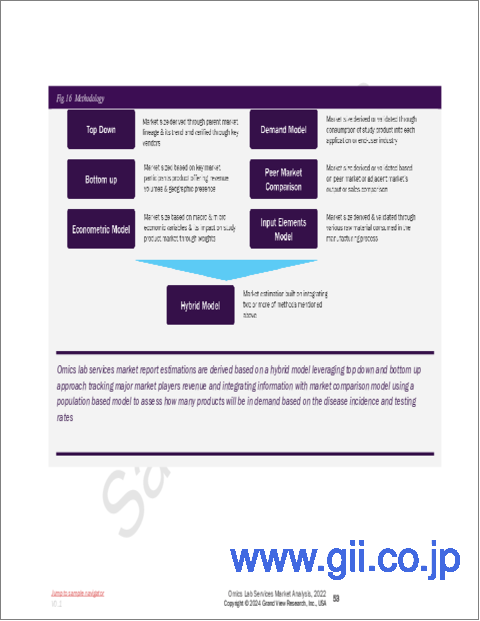
Chapter 1 Methodology and Scope
- 1.1 Market Segmentation
- 1.1.1 Estimates And Forecast Timeline
- 1.2 Research Methodology
- 1.3 Information Procurement
- 1.3.1 Purchased Database
- 1.3.2 Secondary Sources
- 1.3.3 Primary Research
- 1.3.4 Details Of Primary Research
- 1.4 Information Or Data Analysis
- 1.4.1 Data Analysis Models
- 1.5 Market Formulation & Validation
- 1.6 Model Details
- 1.6.1 Commodity Flow Analysis
- 1.6.1.1 Approach 1: Commodity Flow Approach
- 1.6.1.2 Approach 2: Country Wise Market Estimation Using Bottom-Up Approach
- 1.6.1 Commodity Flow Analysis
- 1.7 Global Market: Cagr Calculation
- 1.8 Research Assumptions
- 1.9 List Of Secondary Sources
- 1.10 List Of Primary Sources
- 1.11 Objectives
- 1.11.1 Objective 1:
- 1.11.2 Objective 2:
- 1.12 List Of Abbreviations
Chapter 2 Executive Summary
- 2.1 Market Snapshot
- 2.2 Segment Snapshot
- 2.3 Competitive Landscape Snapshot
Chapter 3 Omics Lab Services Market Variables, Trends, and Scope
- 3.1 Omics Lab Services Market Lineage Outlook
- 3.1.1 Parent Market Outlook
- 3.1.1.1 Diagnostics Market
- 3.1.1.2 Biotechnology Market
- 3.1.1 Parent Market Outlook
- 3.2 Penetration And Growth Prospect Mapping
- 3.3 Market Driver Analysis
- 3.3.1 Growing Integration Of Genomics Data Into Clinical Workflows
- 3.3.1.1 More Targeted And Personalized Healthcare
- 3.3.1.2 Growth Of Newborn Genetic Screening Programs
- 3.3.1.3 Advancements In Noninvasive Cancer Screening
- 3.3.2 Rising Adoption Of Direct-To-Consumer Omics
- 3.3.3 Rising Demand For Early Disease Diagnostic Tests
- 3.3.4 Technological Advancements
- 3.3.5 Increasing Demand/ Adoption For Services
- 3.3.6 Increasing Participation Of Different Companies
- 3.3.7 Increasing Government Funding
- 3.3.1 Growing Integration Of Genomics Data Into Clinical Workflows
- 3.4 Market Restraint Analysis
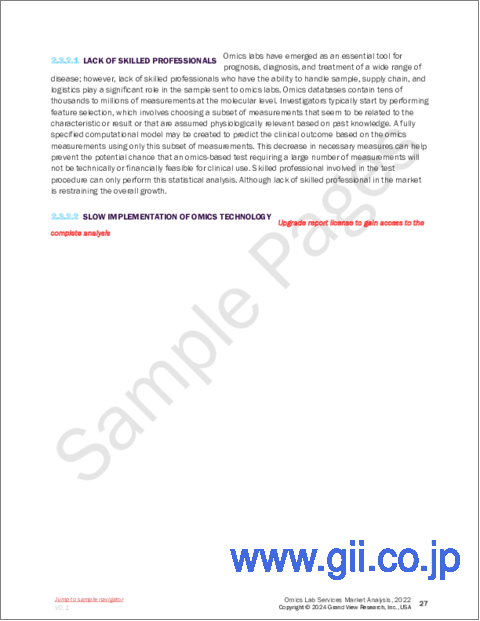
- 3.4.1 Lack Of Skilled Professionals
- 3.4.2 Slow Implementation Of Omics Technology
- 3.5 Swot Analysis, By Factor (Political & Legal, Economic, And Technological)
- 3.6 Porter's Five Forces Analysis
- 3.7 Regulatory Framework
Chapter 4 Omics Lab Services Market - Segment Analysis, By Service, 2018 - 2030 (USD Million)
- 4.1 Definition And Scope
- 4.2 Omics Lab Services Market: Service Movement Analysis
- 4.2.1 Genomics
- 4.2.1.1 Genomics Lab Services Market Estimates And Forecast, 2018 - 2030 (USD Million)
- 4.2.2 Proteomics
- 4.2.2.1 Proteomics Lab Services Market Estimates And Forecast, 2018 - 2030 (USD Million)
- 4.2.3 Transcriptomics
- 4.2.3.1 Transcriptome In-Vivo Analysis (Tiva)
- 4.2.3.2 Ihc
- 4.2.3.3 Microscopy-Based Rns Imaging Techniques
- 4.2.3.4 Transcriptomics Market Estimates And Forecast, 2018 - 2030 (USD Million)
- 4.2.4 Metabolomics
- 4.2.4.1 Metabolomics Lab Services Market Estimates And Forecast, 2018 - 2030 (USD Million)
- 4.2.5 Epigenetics
- 4.2.5.1 Epigenetics Market Estmates And Forecast, 2018 - 2030 (USD Million)
- 4.2.1 Genomics
Chapter 5 Omics Lab Services Market - Segment Analysis, By Business, 2018 - 2030 (USD Million)
- 5.1 Omics Lab Services Market: Business Movement Analysis
- 5.1.1 Hospitals
- 5.1.1.1 Hospitals Market Estimates And Forecast, 2018 - 2030 (USD Million)
- 5.1.2 Research Institutes
- 5.1.2.1 Research Institutes Market Estimates And Forecast, 2018 - 2030 (USD Million)
- 5.1.3 Diagnostic Labs
- 5.1.3.1 Diagnostic Labs Market Estimates And Forecast, 2018 - 2030 (USD Million)
- 5.1.1 Hospitals
Chapter 6 Omics Lab Services Market - Segment Analysis, By Frequency Of Service, 2018 - 2030 (USD Million)
- 6.1 Definition And Scope
- 6.2 Omics Lab Services Market: Frequency Of Service Movement Analysis
- 6.2.1 One-Off
- 6.2.1.1 One-Off Market Estimates And Forecast, 2018 - 2030 (USD Million)
- 6.2.2 Repeat
- 6.2.2.1 Repeat Market Estimates And Forecast, 2018 - 2030 (USD Million)
- 6.2.3 Continuous
- 6.2.3.1 Continuous Market Estimates And Forecast, 2018 - 2030 (USD Million)
- 6.2.1 One-Off
Chapter 7 Omics Lab Services Market - Segment Analysis, By Product, 2018 - 2030 (USD Million)
- 7.1 Definition And Scope
- 7.2 Omics Lab Services Market: Product Movement Analysis
- 7.2.1 Hardware Equipment
- 7.2.1.1 Instruments
- 7.2.1.2 Consumables/Reagents
- 7.2.1.3 Hardware Equipment Market Estimates And Forecast, 2018 - 2030 (USD Million)
- 7.2.2 Testing/Lab (Services)
- 7.2.2.1 Testing/Lab Market Estimates And Forecast, 2018 - 2030 (USD Million)
- 7.2.3 Analytics/Interpretation
- 7.2.3.1 Analytics/Interpretation Market Estimates And Forecast, 2018 - 2030 (USD Million)
- 7.2.1 Hardware Equipment
Chapter 8 Omics Lab Services Market - Segment Analysis, By End Use, 2018 - 2030 (USD Million)
- 8.1 Definition And Scope
- 8.2 Omics Lab Services Market: End-Use Movement Analysis
- 8.2.1 Cancer
- 8.2.1.1 Cancer Market Estimates And Forecast, 2018 - 2030 (USD Million)
- 8.2.2 Pharmaco
- 8.2.2.1 Pharmaco Market Estimates And Forecast, 2018 - 2030 (USD Million)
- 8.2.2.2 Prescription
- 8.2.2.2.1 Prescription Market Estimates And Forecast, 2018 - 2030 (USD Million)
- 8.2.2.3 Non-Prescription (Otc)
- 8.2.2.3.1 Non-Prescription Market Estimates And Forecast, 2018 - 2030 (USD Million)
- 8.2.3 Reproductive
- 8.2.3.1 Reproductive Market Estimates And Forecast, 2018 - 2030 (USD Million)
- 8.2.4 Other Genetic Disease
- 8.2.4.1 Other Genetic Disease Market Estimates And Forecast, 2018 - 2030 (USD Million)
- 8.2.5 Forensics
- 8.2.5.1 Forensics Market Estmates And Forecast, 2018 - 2030 (USD Million)
- 8.2.6 Population Studies
- 8.2.6.1 Population Studies Market Estimates And Forecast, 2018 - 2030 (USD Million)
- 8.2.7 Skincare
- 8.2.7.1 Skincare Market Estimates And Forecast, 2018 - 2030 (USD Million)
- 8.2.8 Nutrition
- 8.2.8.1 Nutrition Market Estimates And Forecast, 2018 - 2030 (USD Million)
- 8.2.9 Vitamins And Supplements
- 8.2.9.1 Vitamins And Supplements Market Estimates And Forecast, 2018 - 2030 (USD Million)
- 8.2.10 Genealogy
- 8.2.10.1 Genealogy Market Estmates And Forecast, 2018 - 2030 (USD Million)
- 8.2.11 Other Categories
- 8.2.11.1 Other Categories Market Estmates And Forecast, 2018 - 2030 (USD Million)
- 8.2.1 Cancer
Chapter 9 Regional Business Analysis
- 9.1 Definition & Scope
- 9.2 Regional Market Share Analysis, 2021&2030
- 9.3 Regional Market Dashboard
- 9.4 Regional Market Snapshot
- 9.5 Swot Analysis, By Factor (Political & Legal, Economic And Technological)
- 9.5.1 North America
- 9.5.2 Europe
- 9.5.3 Asia Pacific
- 9.5.4 Latin America
- 9.5.5 Mea
- 9.6 Market Size, & Forecasts, Trend Analysis, 2021 To 2030
- 9.7 North America
- 9.7.1 North America Market Estimates And Forecast, 2018 - 2030 (USD Billion)
- 9.7.2 U.S.
- 9.7.2.1 U.S. Omics Lab Services Market, 2018 - 2030 (USD Billion)
- 9.7.2.2 Key Country Dynamics
- 9.7.2.3 Regulatory Framework
- 9.7.2.4 Competitive Scenario
- 9.7.2.5 Recent Developments
- 9.7.2.6 Investments Scenario
- 9.7.3 Canada
- 9.7.3.1 Canada Omics Lab Services Market, 2018 - 2030 (USD Billion)
- 9.7.3.2 Key Country Dynamics
- 9.7.3.3 Regulatory Framework
- 9.7.3.4 Competitive Scenario
- 9.7.3.5 Recent Developments
- 9.7.3.6 Investments Scenario
- 9.8 Europe
- 9.8.1 Urope Omics Lab Services Market, 2018 - 2030 (USD Billion)
- 9.8.2 Uk
- 9.8.2.1 Uk Omics Lab Services Market, 2018 - 2030 (USD Billion)
- 9.8.2.2 Key Country Dynamics
- 9.8.2.3 Regulatory Framework
- 9.8.2.4 Competitive Scenario
- 9.8.2.5 Recent Developments
- 9.8.2.6 Investments Scenario
- 9.8.3 Germany
- 9.8.3.1 Germany Omics Lab Services Market, 2018 - 2030 (USD Billion)
- 9.8.3.2 Key Country Dynamics
- 9.8.3.3 Regulatory Framework
- 9.8.3.4 Competitive Scenario
- 9.8.3.5 Recent Developments
- 9.8.3.6 Investments Scenario
- 9.8.4 Spain
- 9.8.4.1 Spain Omics Lab Services Market, 2018 - 2030 (USD Billion)
- 9.8.4.2 Key Country Dynamics
- 9.8.4.3 Regulatory Framework
- 9.8.4.4 Competitive Scenario
- 9.8.4.5 Recent Developments
- 9.8.4.6 Investments Scenario
- 9.8.5 France
- 9.8.5.1 France Omics Lab Services Market, 2018 - 2030 (USD Billion)
- 9.8.5.2 Key Country Dynamics
- 9.8.5.3 Regulatory Framework
- 9.8.5.4 Competitive Scenario
- 9.8.5.5 Recent Developments
- 9.8.5.6 Investments Scenario
- 9.8.6 Italy
- 9.8.6.1 Italy Omics Lab Services Market, 2018 - 2030 (USD Billion)
- 9.8.6.2 Key Country Dynamics
- 9.8.6.3 Regulatory Framework
- 9.8.6.4 Competitive Scenario
- 9.8.6.5 Recent Developments
- 9.8.6.6 Investments Scenario
- 9.8.7 Russia
- 9.8.7.1 Russia Omics Lab Services Market, 2018 - 2030 (USD Billion)
- 9.8.7.2 Regulatory Framework
- 9.8.7.3 Competitive Scenario
- 9.8.7.4 Recent Developments
- 9.8.7.5 Investments Scenario
- 9.8.8 Denmark
- 9.8.8.1 Denmarkomics Lab Services Market, 2018 - 2030 (USD Billion)
- 9.8.8.2 Key Country Dynamics
- 9.8.8.3 Regulatory Framework
- 9.8.8.4 Competitive Scenario
- 9.8.8.5 Recent Developments
- 9.8.8.6 Investments Scenario
- 9.8.9 Sweden
- 9.8.9.1 Sweden Omics Lab Services Market, 2018 - 2030 (USD Billion)
- 9.8.9.2 Key Country Dynamics
- 9.8.9.3 Regulatory Framework
- 9.8.9.4 Competitive Scenario
- 9.8.9.5 Recent Developments
- 9.8.9.6 Investments Scenario
- 9.8.10 Norway
- 9.8.10.1 Norway Omics Lab Services Market, 2018 - 2030 (USD Billion)
- 9.8.10.2 Key Country Dynamics
- 9.8.10.3 Regulatory Framework
- 9.8.10.4 Competitive Scenario
- 9.8.10.5 Recent Developments
- 9.8.10.6 Investments Scenario
- 9.9 Asia Pacific
- 9.9.1 Asia-Pacific Omics Lab Services Market, 2018 - 2030 (USD Billion)
- 9.9.2 Japan
- 9.9.2.1 Japan Omics Lab Services Market, 2018 - 2030 (USD Billion)
- 9.9.2.2 Key Country Dynamics
- 9.9.2.3 Regulatory Framework
- 9.9.2.4 Competitive Scenario
- 9.9.2.5 Recent Developments
- 9.9.2.6 Investments Scenario
- 9.9.3 China
- 9.9.3.1 Chinaomics Lab Services Market, 2018 - 2030 (USD Billion)
- 9.9.3.2 Key Country Dynamics
- 9.9.3.3 Regulatory Framework
- 9.9.3.4 Competitive Scenario
- 9.9.3.5 Recent Developments
- 9.9.3.6 Investments Scenario
- 9.9.4 India
- 9.9.4.1 Indiaomics Lab Services Market, 2018 - 2030 (USD Billion)
- 9.9.4.2 Key Country Dynamics
- 9.9.4.3 Regulatory Framework
- 9.9.4.4 Competitive Scenario
- 9.9.4.5 Recent Developments
- 9.9.4.6 Investments Scenario
- 9.9.5 South Korea
- 9.9.5.1 South Koreaomics Lab Services Market, 2018 - 2030 (USD Billion)
- 9.9.5.2 Key Country Dynamics
- 9.9.5.3 Regulatory Framework
- 9.9.5.4 Competitive Scenario
- 9.9.5.5 Recent Developments
- 9.9.5.6 Investments Scenario
- 9.9.6 Thailand
- 9.9.6.1 Thailandomics Lab Services Market, 2018 - 2030 (USD Billion)
- 9.9.6.2 Key Country Dynamics
- 9.9.6.3 Regulatory Framework
- 9.9.6.4 Competitive Scenario
- 9.9.6.5 Recent Developments
- 9.9.6.6 Investments Scenario
- 9.9.7 Australia
- 9.9.7.1 Australiaomics Lab Services Market, 2018 - 2030 (USD Billion)
- 9.9.7.2 Key Country Dynamics
- 9.9.7.3 Regulatory Framework
- 9.9.7.4 Competitive Scenario
- 9.9.7.5 Recent Developments
- 9.9.7.6 Investments Scenario
- 9.10 Latin America
- 9.10.1 Latin America Omics Lab Services Market, 2018 - 2030 (USD Billion)
- 9.10.2 Brazil
- 9.10.2.1 Brazilomics Lab Services Market, 2018 - 2030 (USD Billion)
- 9.10.2.2 Key Country Dynamics
- 9.10.2.3 Regulatory Framework
- 9.10.2.4 Competitive Scenario
- 9.10.2.5 Recent Developments
- 9.10.2.6 Investments Scenario
- 9.10.3 Mexico
- 9.10.3.1 Mexicoomics Lab Services Market, 2018 - 2030 (USD Billion)
- 9.10.3.2 Key Country Dynamics
- 9.10.3.3 Regulatory Framework
- 9.10.3.4 Competitive Scenario
- 9.10.3.5 Recent Developments
- 9.10.3.6 Investments Scenario
- 9.10.4 Argentina
- 9.10.4.1 Argentinaomics Lab Services Market, 2018 - 2030 (USD Billion)
- 9.10.4.2 Key Country Dynamics
- 9.10.4.3 Regulatory Framework
- 9.10.4.4 Competitive Scenario
- 9.10.4.5 Recent Developments
- 9.10.4.6 Investments Scenario
- 9.11 Mea
- 9.11.1 Mea Omics Lab Services Market, 2018 - 2030 (USD Billion)
- 9.11.2 South Africa
- 9.11.2.1 South Africaomics Lab Services Market, 2018 - 2030 (USD Billion)
- 9.11.2.2 Key Country Dynamics
- 9.11.2.3 Regulatory Framework
- 9.11.2.4 Competitive Scenario
- 9.11.2.5 Recent Developments
- 9.11.2.6 Investments Scenario
- 9.11.3 Saudi Arabia
- 9.11.3.1 Saudi Arabiaomics Lab Services Market, 2018 - 2030 (USD Billion)
- 9.11.3.2 Key Country Dynamics
- 9.11.3.3 Regulatory Framework
- 9.11.3.4 Competitive Scenario
- 9.11.3.5 Recent Developments
- 9.11.3.6 Investments Scenario
- 9.11.4 Uae
- 9.11.4.1 Uaeomics Lab Services Market, 2018 - 2030 (USD Billion)
- 9.11.4.2 Key Country Dynamics
- 9.11.4.3 Regulatory Framework
- 9.11.4.4 Competitive Scenario
- 9.11.4.5 Recent Developments
- 9.11.4.6 Investments Scenario
- 9.11.5 Kuwait
- 9.11.5.1 Kuwaitomics Lab Services Market, 2018 - 2030 (USD Billion)
- 9.11.5.2 Key Country Dynamics
- 9.11.5.3 Regulatory Framework
- 9.11.5.4 Competitive Scenario
- 9.11.5.5 Recent Developments
- 9.11.5.6 Investments Scenario
Chapter 10 Competitive Analysis
- 10.1 Company/Competition Categorization (Key Innovators, Market Leaders, Emerging Players)
- 10.2 Strategy Framework
- 10.3 Market Participation Categorization
- 10.4 Recent Developments & Impact Analysis, By Key Market Participants
- 10.5 Company Position Analysis
- 10.6 List Of Distributors
- 10.6.1 Key Customers
- 10.6.2 Public Companies
- 10.6.3 Private Companies
- 10.7 Case Studies
- 10.7.1 Case Study: Blood-Based Ngs In Treatment Decision-Making For Non-Small Cell Lung Cancer (Nsclc)
- 10.7.1.1 Impact Of Ngs On Treatment Selection In Acute Myeloid Leukemia
- 10.7.2 Case Study: Cancer Treatment Response Prediction
- 10.7.2.1 The Challenge: Understanding Immune Checkpoint Inhibitor Therapy Response
- 10.7.2.2 Insight: Metabolomics Identifies Differential Metabolites In Responders To Immune Checkpoint Inhibitor Therapy
- 10.7.2.3 The Solution: Immune Checkpoint Inhibitor Therapy Responders Have Different Metabolomic Profiles Compared To Non-Responders
- 10.7.2.4 The Result: Metabolomics Identifies Predictive Biomarkers For Treatment Response
- 10.7.3 Case Study: Clinical Trial Design
- 10.7.3.1 The Challenge
- 10.7.3.2 Metabolon Insight
- 10.7.3.3 The Solution
- 10.7.3.4 The Outcome
- 10.7.4 Case Study: How H. Pylori Get Its Shape
- 10.7.4.1 The Challenge
- 10.7.4.2 The Approach
- 10.7.4.3 The Outcome
- 10.7.5 Case Study: Combined Analysis Of Cnvs And Snvs In Genomic Diagnostics
- 10.7.5.1 Analysis
- 10.7.5.2 Result:
- 10.7.5.3 Conclusion
- 10.7.1 Case Study: Blood-Based Ngs In Treatment Decision-Making For Non-Small Cell Lung Cancer (Nsclc)
Chapter 11 Company Profiles
- 11.1 Company Profiles
- 11.1.1 AGILENT TECHNOLOGIES, INC.
- 11.1.1.1 Company Overview
- 11.1.1.2 Financial Performance
- 11.1.1.3 Product Benchmarking
- 11.1.1.4 Strategic Initiatives
- 11.1.2 BEIJING GENOMICS INSTITUTE (BGI)
- 11.1.2.1 Company Overview
- 11.1.2.1.1Complete Genomics Incorporated
- 11.1.2.2 Product Benchmarking
- 11.1.2.3 Strategic Initiatives
- 11.1.3 Q2 SOLUTIONS
- 11.1.3.1 Company Overview
- 11.1.3.2 Product Benchmarking
- 11.1.3.3 Strategic Initiatives
- 11.1.4 SPECTRUS
- 11.1.4.1 Company Overview
- 11.1.4.2 Product Benchmarking
- 11.1.5 FLOMICS BIOTECH
- 11.1.5.1 Company Overview
- 11.1.5.2 Product Benchmarking
- 11.1.5.3 Strategic Initiatives
- 11.1.6 PHENOSWITCH BIOSCIENCE
- 11.1.6.1 Company Overview
- 11.1.6.2 Product Benchmarking
- 11.1.6.3 Strategic Initiatives
- 11.1.7 QIAGEN
- 11.1.7.1 Company Overview
- 11.1.7.1 Financial Performance
- 11.1.7.2 Product Benchmarking
- 11.1.7.3 Strategic Initiatives
- 11.1.8 QUEST DIAGNOSTICS INCORPORATED
- 11.1.8.1 Company Overview
- 11.1.8.2 Financial Performance
- 11.1.8.3 Product Benchmarking
- 11.1.8.4 Strategic Initiatives
- 11.1.9 THERMO FISHER SCIENTIFIC, INC.
- 11.1.9.1 Company Overview
- 11.1.9.1.1 Life Technologies Corp.
- 11.1.9.1.2 Affymetrix
- 11.1.9.1.3 Applied Biosystems
- 11.1.9.2 Financial Performance
- 11.1.9.3 Product Benchmarking
- 11.1.9.4 Strategic Initiatives
- 11.1.10 ILLUMINA, INC
- 11.1.10.1 Company Overview
- 11.1.10.2 Financial Performance
- 11.1.10.3 Product Benchmarking
- 11.1.10.4 Strategic Initiatives
- 11.1.1 AGILENT TECHNOLOGIES, INC.