|
|
市場調査レポート
商品コード
1474896
薬事未承認検査(LDT)の市場規模、シェア、動向分析レポート:技術別、用途別、地域別、セグメント予測、2024年~2030年Laboratory Developed Tests Market Size, Share & Trends Analysis Report By Technology (Immunoassay, Molecular Diagnostics), By Application (Oncology, Nutritional & Metabolic Disease), By Region, And Segment Forecasts, 2024 - 2030 |
||||||
|
|||||||
カスタマイズ可能
|
|||||||

| 薬事未承認検査(LDT)の市場規模、シェア、動向分析レポート:技術別、用途別、地域別、セグメント予測、2024年~2030年 |
|
出版日: 2024年04月23日
発行: Grand View Research
ページ情報: 英文 125 Pages
納期: 2~10営業日
|

全表示
- 概要
- 図表
- 目次
薬事未承認検査(LDT)市場の成長と動向:
Grand View Research, Inc.の最新レポートによると、世界の薬事未承認検査(LDT)開発市場規模は2030年までに198億5,000万米ドルに達し、2024年から2030年までのCAGRは7.05%で拡大すると予測されています。
この産業の成長は、慢性疾患や遺伝性疾患、感染症や自己免疫疾患の有病率の増加、健康的な生活に対する人々の意識の高まりに起因しています。薬事未承認検査(LDT)は最も一般的に分子診断学で採用されており、これには遺伝学に加えて様々な異なる化学物質を標的とする検査が含まれます。
例えば、2022年7月、Quest Diagnosticsは、サル痘ウイルス感染の診断のためのラボベースの分子診断検査を発売しました。さらに、イムノアッセイは、新規検査の開発により、絶大な採用率と受容性を獲得しつつあります。例えば、2021年12月、OPKO Health, Inc.は、4つの免疫測定法を患者の年齢、生検歴、直腸指診の結果を考慮した1つの数値スコアに統合したLDTである4Kscore検査のFDA承認を発表しました。LDTは他者に販売されるものではないのでFDAの承認は必要ありませんが、厳密なバリデーション手順を経る必要があります。しかしながら、がんの世界の有病率の増加は、業界の成長を促進する重要な要因です。
GLOBOCANによると、2020年には世界で新たに発生するがん患者は推定1,930万人で、そのうち乳がん患者は230万人です。肺がんはがん患者の中で最も多い死因であり、この分野ではより迅速で正確な診断ツールに対するアンメットニーズが高まっています。2021年1月、英国体外診断薬協会はNHSイングランドに対し、がん領域における分子診断薬の委託枠組みを開発するよう要請しました。主要企業は、より高い業界シェアを獲得するため、製品の上市と地理的拡大に注力しています。例えば、2022年5月、Guardant Health社は、45歳以上の成人集団における大腸がんの早期徴候を検出するためのLDTとして利用可能な血液検査であるShieldを発売しました。
薬事未承認検査(LDT)市場レポートハイライト:
- 分子診断技術セグメントが業界を支配し、2023年の全体売上高の最大シェアを占めました。
- このセグメントの成長は、多くの疾患に対する診断検査を提供する必要性が高まったことに起因します。
- がん用途セグメントは、がんの有病率の増加により、予測期間中に大きく成長すると予測されています。
- 同市場は、対象者の増大する需要に対応できる革新的なサービスのイントロダクションより、大きく成長すると予想されます。
- 北米は、新規LDT製品の導入と、高齢者人口の増加に伴う診断ツールへの高い需要により、2023年に業界を支配しました。
目次
第1章 薬事未承認検査(LDT)市場:調査手法と範囲
第2章 薬事未承認検査(LDT)市場:エグゼクティブサマリー
- 市場展望
- セグメント展望
- 競合考察
第3章 薬事未承認検査(LDT)市場:変数、動向、範囲
- 市場系統の見通し
- 市場力学
- 薬事未承認検査(LDT)市場分析ツール
第4章 薬事未承認検査(LDT)市場:技術の推定・動向分析
- 技術の市場シェア、2023年と2030年
- セグメントダッシュボード
- 世界の薬事未承認検査(LDT)市場、技術別の展望
- 2018年から2030年までの市場規模と予測・動向分析
第5章 薬事未承認検査(LDT)市場:用途の推定・動向分析
- 用途の市場シェア、2023年および2030年
- セグメントダッシュボード
- 世界の薬事未承認検査(LDT)市場、用途別の展望
- 2018年から2030年までの市場規模と予測・動向分析
第6章 薬事未承認検査(LDT)市場:地域の推定・動向分析
- 地域の市場シェア分析、2023年および2030年
- 地域の市場ダッシュボード
- 世界の地域の市場スナップショット
- 2018年から2030年までの市場規模と予測・動向分析
- 北米
- 米国
- カナダ
- 欧州
- 英国
- ドイツ
- フランス
- イタリア
- スペイン
- ノルウェー
- スウェーデン
- デンマーク
- アジア太平洋地域
- 日本
- 中国
- インド
- オーストラリア
- 韓国
- タイ
- ラテンアメリカ
- ブラジル
- メキシコ
- アルゼンチン
- 中東・アフリカ
- 南アフリカ
- サウジアラビア
- アラブ首長国連邦
- クウェート
第7章 競合情勢
- 主要市場参入企業による最近の動向と影響分析
- 企業/競合の分類
- ベンダー情勢
- Quest Diagnostics Incorporated.
- 23andMe, Inc.
- Abbott
- Guardant Health
- NeoGenomics Laboratories.
- QIAGEN
- Siemens Healthineers AG
- Illumina, Inc.
- F. Hoffmann-La Roche Ltd.
List of Tables
- Table 1 List of abbreviation
- Table 2 North America laboratory developed tests market, by region, 2018 - 2030 (USD Million)
- Table 3 North America laboratory developed tests market, by technology, 2018 - 2030 (USD Million)
- Table 4 North America laboratory developed tests market, by application, 2018 - 2030 (USD Million)
- Table 5 U.S. laboratory developed tests market, by technology, 2018 - 2030 (USD Million)
- Table 6 U.S. laboratory developed tests market, by application, 2018 - 2030 (USD Million)
- Table 7 Canada laboratory developed tests market, by technology, 2018 - 2030 (USD Million)
- Table 8 Canada laboratory developed tests market, by application, 2018 - 2030 (USD Million)
- Table 9 Europe laboratory developed tests market, by region, 2018 - 2030 (USD Million)
- Table 10 Europe laboratory developed tests market, by technology, 2018 - 2030 (USD Million)
- Table 11 Europe laboratory developed tests market, by application, 2018 - 2030 (USD Million)
- Table 12 Germany laboratory developed tests market, by technology, 2018 - 2030 (USD Million)
- Table 13 Germany laboratory developed tests market, by application, 2018 - 2030 (USD Million)
- Table 14 U.K. laboratory developed tests market, by technology, 2018 - 2030 (USD Million)
- Table 15 U.K. laboratory developed tests market, by application, 2018 - 2030 (USD Million)
- Table 16 France laboratory developed tests market, by technology, 2018 - 2030 (USD Million)
- Table 17 France laboratory developed tests market, by application, 2018 - 2030 (USD Million)
- Table 18 Italy laboratory developed tests market, by technology, 2018 - 2030 (USD Million)
- Table 19 Italy laboratory developed tests market, by application, 2018 - 2030 (USD Million)
- Table 20 Spain laboratory developed tests market, by technology, 2018 - 2030 (USD Million)
- Table 21 Spain laboratory developed tests market, by application, 2018 - 2030 (USD Million)
- Table 22 Denmark laboratory developed tests market, by technology, 2018 - 2030 (USD Million)
- Table 23 Denmark laboratory developed tests market, by application, 2018 - 2030 (USD Million)
- Table 24 Sweden laboratory developed tests market, by technology, 2018 - 2030 (USD Million)
- Table 25 Sweden laboratory developed tests market, by application, 2018 - 2030 (USD Million)
- Table 26 Norway laboratory developed tests market, by technology, 2018 - 2030 (USD Million)
- Table 27 Norway laboratory developed tests market, by application, 2018 - 2030 (USD Million)
- Table 28 Asia Pacific laboratory developed tests market, by region, 2018 - 2030 (USD Million)
- Table 29 Asia Pacific laboratory developed tests market, by technology, 2018 - 2030 (USD Million)
- Table 30 Asia Pacific laboratory developed tests market, by application, 2018 - 2030 (USD Million)
- Table 31 China laboratory developed tests market, by technology, 2018 - 2030 (USD Million)
- Table 32 China laboratory developed tests market, by application, 2018 - 2030 (USD Million)
- Table 33 Japan laboratory developed tests market, by technology, 2018 - 2030 (USD Million)
- Table 34 Japan laboratory developed tests market, by application, 2018 - 2030 (USD Million)
- Table 35 India laboratory developed tests market, by technology, 2018 - 2030 (USD Million)
- Table 36 India laboratory developed tests market, by application, 2018 - 2030 (USD Million)
- Table 37 South Korea laboratory developed tests market, by technology, 2018 - 2030 (USD Million)
- Table 38 South Korea laboratory developed tests market, by application, 2018 - 2030 (USD Million)
- Table 39 Australia laboratory developed tests market, by technology, 2018 - 2030 (USD Million)
- Table 40 Australia laboratory developed tests market, by application, 2018 - 2030 (USD Million)
- Table 41 Thailand laboratory developed tests market, by technology, 2018 - 2030 (USD Million)
- Table 42 Thailand laboratory developed tests market, by application, 2018 - 2030 (USD Million)
- Table 43 Latin America laboratory developed tests market, by region, 2018 - 2030 (USD Million)
- Table 44 Latin America laboratory developed tests market, by technology, 2018 - 2030 (USD Million)
- Table 45 Latin America laboratory developed tests market, by application, 2018 - 2030 (USD Million)
- Table 46 Brazil laboratory developed tests market, by technology, 2018 - 2030 (USD Million)
- Table 47 Brazil laboratory developed tests market, by application, 2018 - 2030 (USD Million)
- Table 48 Mexico laboratory developed tests market, by technology, 2018 - 2030 (USD Million)
- Table 49 Mexico laboratory developed tests market, by application, 2018 - 2030 (USD Million)
- Table 50 Argentina laboratory developed tests market, by technology, 2018 - 2030 (USD Million)
- Table 51 Argentina laboratory developed tests market, by application, 2018 - 2030 (USD Million)
- Table 52 MEA laboratory developed tests market, by region, 2018 - 2030 (USD Million)
- Table 53 MEA laboratory developed tests market, by technology, 2018 - 2030 (USD Million)
- Table 54 MEA laboratory developed tests market, by application, 2018 - 2030 (USD Million)
- Table 55 South Africa laboratory developed tests market, by technology, 2018 - 2030 (USD Million)
- Table 56 South Africa laboratory developed tests market, by application, 2018 - 2030 (USD Million)
- Table 57 Saudi Arabia laboratory developed tests market, by technology, 2018 - 2030 (USD Million)
- Table 58 Saudi Arabia laboratory developed tests market, by application, 2018 - 2030 (USD Million)
- Table 59 UAE laboratory developed tests market, by technology, 2018 - 2030 (USD Million)
- Table 60 UAE laboratory developed tests market, by application, 2018 - 2030 (USD Million)
- Table 61 Kuwait laboratory developed tests market, by technology, 2018 - 2030 (USD Million)
- Table 62 Kuwait laboratory developed tests market, by application, 2018 - 2030 (USD Million)
List of Figures
- Fig. 1 Market research process
- Fig. 2 Data triangulation techniques
- Fig. 3 Primary research pattern
- Fig. 4 Primary interviews in North America
- Fig. 5 Primary interviews in Europe
- Fig. 6 Primary interviews in APAC
- Fig. 7 Primary interviews in Latin America
- Fig. 8 Primary interviews in MEA
- Fig. 9 Market research approaches
- Fig. 10 Value-chain-based sizing & forecasting
- Fig. 11 QFD modeling for market share assessment
- Fig. 12 Market formulation & validation
- Fig. 13 Laboratory developed tests market: market outlook
- Fig. 14 Tumor ablation competitive insights
- Fig. 15 Parent market outlook
- Fig. 16 Related/ancillary market outlook
- Fig. 17 Penetration and growth prospect mapping
- Fig. 18 Industry value chain analysis
- Fig. 19 Laboratory developed tests market driver impact
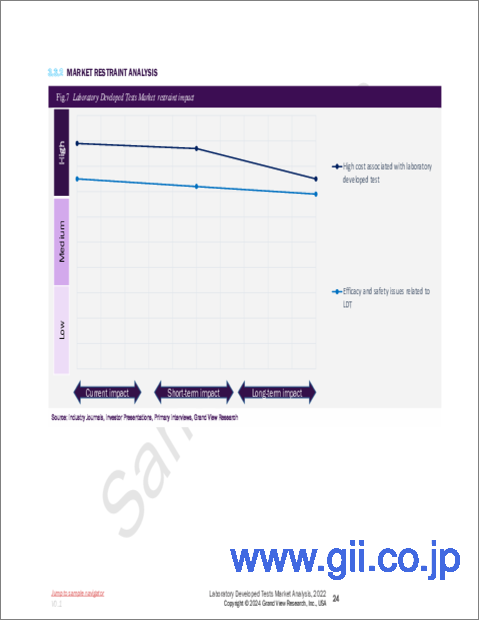
- Fig. 20 Laboratory developed tests market restraint impact
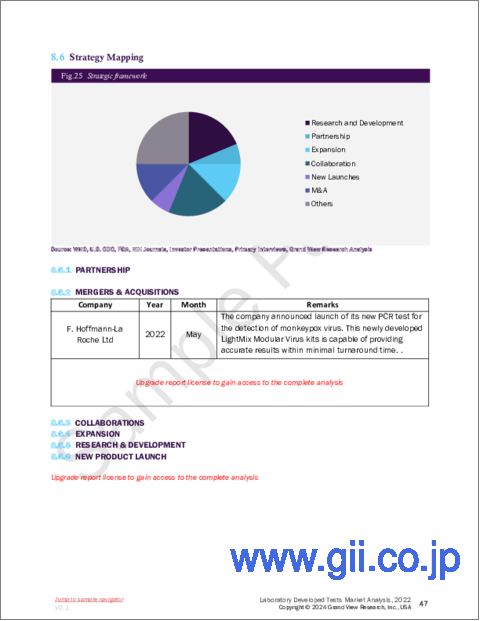
- Fig. 21 Laboratory developed tests market strategic initiatives analysis
- Fig. 22 Laboratory developed tests market: Technology movement analysis
- Fig. 23 Laboratory developed tests market: Technology outlook and key takeaways
- Fig. 24 Immunoassays market estimates and forecast, 2018 - 2030
- Fig. 25 Hematology and coagulation estimates and forecast, 2018 - 2030
- Fig. 26 Molecular diagnostics market estimates and forecast, 2018 - 2030
- Fig. 27 Microbiology market estimates and forecast, 2018 - 2030
- Fig. 28 Clinical chemistry market estimates and forecast, 2018 - 2030
- Fig. 29 Histology/Cytology market estimates and forecast, 2018 - 2030
- Fig. 30 Flow cytometry market estimates and forecast, 2018 - 2030
- Fig. 31 Mass spectroscopy market estimates and forecast, 2018 - 2030
- Fig. 32 Others market estimates and forecast, 2018 - 2030
- Fig. 33 Laboratory developed tests market: Application movement Analysis
- Fig. 34 Laboratory developed tests market: Application outlook and key takeaways
- Fig. 35 Oncology market estimates and forecasts, 2018 - 2030
- Fig. 36 Genetic disorders/Inherited disease market estimates and forecasts, 2018 - 2030
- Fig. 37 Infectious & parasitic diseases market estimates and forecasts, 2018 - 2030
- Fig. 38 Immunology market estimates and forecasts, 2018 - 2030
- Fig. 39 Endocrine market estimates and forecasts, 2018 - 2030
- Fig. 40 Nutritional & metabolic disease market estimates and forecasts, 2018 - 2030
- Fig. 41 Cardiology market estimates and forecasts, 2018 - 2030
- Fig. 42 Mental/Behavioral disorder market estimates and forecasts, 2018 - 2030
- Fig. 43 Pediatrics-specific testing market estimates and forecasts, 2018 - 2030
- Fig. 44 Hematology/General blood testing market estimates and forecasts, 2018 - 2030
- Fig. 45 Bodily fluid analysis market estimates and forecasts, 2018 - 2030
- Fig. 46 Toxicology market estimates and forecasts, 2018 - 2030
- Fig. 47 Other diseases market estimates and forecasts, 2018 - 2030
- Fig. 48 Global laboratory developed tests market: Regional movement analysis
- Fig. 49 Global laboratory developed tests market: Regional outlook and key takeaways
- Fig. 50 Global laboratory developed tests market share and leading players
- Fig. 51 North America market share and leading players
- Fig. 52 Europe market share and leading players
- Fig. 53 Asia Pacific market share and leading players
- Fig. 54 Latin America market share and leading players
- Fig. 55 Middle East & Africa market share and leading players
- Fig. 56 North America: SWOT
- Fig. 57 Europe SWOT
- Fig. 58 Asia Pacific SWOT
- Fig. 59 Latin America SWOT
- Fig. 60 MEA SWOT
- Fig. 61 North America market estimates and forecasts, 2018 - 2030
- Fig. 62 U.S key country dynamics
- Fig. 63 U.S market estimates and forecasts, 2018 - 2030
- Fig. 64 Canada key country dynamics
- Fig. 65 Canada market estimates and forecasts, 2018 - 2030
- Fig. 66 Europe market estimates and forecasts, 2018 - 2030
- Fig. 67 UK key country dynamics
- Fig. 68 UK market estimates and forecasts, 2018 - 2030
- Fig. 69 Germany key country dynamics
- Fig. 70 Germany market estimates and forecasts, 2018 - 2030
- Fig. 71 France key country dynamics
- Fig. 72 France market estimates and forecasts, 2018 - 2030
- Fig. 73 Italy key country dynamics
- Fig. 74 Italy market estimates and forecasts, 2018 - 2030
- Fig. 75 Spain key country dynamics
- Fig. 76 Spain market estimates and forecasts, 2018 - 2030
- Fig. 77 Denmark key country dynamics
- Fig. 78 Denmark market estimates and forecasts, 2018 - 2030
- Fig. 79 Sweden key country dynamics
- Fig. 80 Sweden market estimates and forecasts, 2018 - 2030
- Fig. 81 Norway key country dynamics
- Fig. 82 Norway market estimates and forecasts, 2018 - 2030
- Fig. 83 Asia Pacific market estimates and forecasts, 2018 - 2030
- Fig. 84 China key country dynamics
- Fig. 85 China market estimates and forecasts, 2018 - 2030
- Fig. 86 Japan key country dynamics
- Fig. 87 Japan market estimates and forecasts, 2018 - 2030
- Fig. 88 India key country dynamics
- Fig. 89 India market estimates and forecasts, 2018 - 2030
- Fig. 90 Thailand key country dynamics
- Fig. 91 Thailand market estimates and forecasts, 2018 - 2030
- Fig. 92 South Korea key country dynamics
- Fig. 93 South Korea market estimates and forecasts, 2018 - 2030
- Fig. 94 Australia key country dynamics
- Fig. 95 Australia market estimates and forecasts, 2018 - 2030
- Fig. 96 Latin America market estimates and forecasts, 2018 - 2030
- Fig. 97 Brazil key country dynamics
- Fig. 98 Brazil market estimates and forecasts, 2018 - 2030
- Fig. 99 Mexico key country dynamics
- Fig. 100 Mexico market estimates and forecasts, 2018 - 2030
- Fig. 101 Argentina key country dynamics
- Fig. 102 Argentina market estimates and forecasts, 2018 - 2030
- Fig. 103 Middle East and Africa market estimates and forecasts, 2018 - 2030
- Fig. 104 South Africa key country dynamics
- Fig. 105 South Africa market estimates and forecasts, 2018 - 2030
- Fig. 106 Saudi Arabia key country dynamics
- Fig. 107 Saudi Arabia market estimates and forecasts, 2018 - 2030
- Fig. 108 UAE key country dynamics
- Fig. 109 UAE market estimates and forecasts, 2018 - 2030
- Fig. 110 Kuwait key country dynamics
- Fig. 111 Kuwait market estimates and forecasts, 2018 - 2030
- Fig. 112 Market share of key market players- Laboratory developed tests market
Laboratory Developed Tests Market Growth & Trends:
The global laboratory developed tests market size is expected to reach USD 19.85 billion by 2030, expanding at a CAGR of 7.05% from 2024 to 2030, according to a new report by Grand View Research, Inc. The growth of the industry is attributed to the increasing prevalence of chronic and genetic diseases, infectious & autoimmune diseases, and rising awareness among the population about healthy living. The laboratory-developed tests (LDTs) are generated and utilized in the laboratories, and LDTs are released into the market without FDA approval or any other independent regulatory assessment. LDTs are most typically employed in molecular diagnostics, which includes tests that target a variety of different chemicals in addition to genetics.
For instance, in July 2022, Quest Diagnostics launched a lab-based molecular diagnostic test for the diagnosis of monkeypox virus infections. Moreover, immunoassay is gaining immense adoption and acceptability with the development of novel tests. For instance, in December 2021, OPKO Health, Inc., announced the FDA approval of the 4Kscore test, an LDT in which, four immunoassays are combined into a single numerical score that takes into account the patient's age, biopsy history, and the results of a digital rectal exam. Although LDTs do not require FDA approval as they are not marketed to others, they need to go through rigorous validation procedures. However, the increasing global prevalence of cancer is a key factor driving the industry's growth.
According to GLOBOCAN, in 2020, there were an estimated 19.3 million new cancer cases globally, out of which, 2.3 million were breast cancer cases. Lung cancer was the most common cause of death among cancer patients, representing an unmet need for faster and more accurate diagnostic tools in the segment. In January 2021, the British In Vitro Diagnostics Association urged NHS England for the development of a commissioning framework for molecular diagnostics in oncology. Key players focus on product launches and geographical expansion to gain a higher industry share. For instance, in May 2022, Guardant Health launched Shield, a blood test that is available as an LDT for the detection of early signs of colorectal cancer in the adult population aged above 45 years
Laboratory Developed Tests Market Report Highlights:
- The molecular diagnostic technology segment dominated the industry and accounted for the largest share of the overall revenue in 2023
- The segment growth was attributed to the increased need to provide diagnostics tests for a number of diseases
- The oncology application segment is expected to grow lucratively over the forecast period due to the increasing prevalence of cancer
- The market is expected to grow significantly owing to the introduction of innovative services that can address the growing demands of the target audience
- North America dominated the industry in 2023 owing to the introduction of novel LDT products and the high demand for diagnostics tools with the increasing geriatric population
Table of Contents
Chapter 1. Laboratory Developed Tests Market: Methodology and Scope
- 1.1. Market Segmentation & Scope
- 1.2. Segment Definitions
- 1.2.1. Technology
- 1.2.2. Application
- 1.2.3. Regional scope
- 1.2.4. Estimates and forecasts timeline
- 1.3. Research Methodology
- 1.4. Information Procurement
- 1.4.1. Purchased database
- 1.4.2. GVR's internal database
- 1.4.3. Secondary sources
- 1.4.4. Primary research
- 1.4.5. Details of primary research
- 1.4.5.1. Data for primary interviews in North America
- 1.4.5.2. Data for primary interviews in Europe
- 1.4.5.3. Data for primary interviews in Asia Pacific
- 1.4.5.4. Data for primary interviews in Latin America
- 1.4.5.5. Data for Primary interviews in MEA
- 1.5. Information or Data Analysis
- 1.5.1. Data analysis models
- 1.6. Market Formulation & Validation
- 1.7. Model Details
- 1.7.1. Commodity flow analysis (Model 1)
- 1.7.2. Approach 1: Commodity flow approach
- 1.7.3. Volume price analysis (Model 2)
- 1.7.4. Approach 2: Volume price analysis
- 1.8. List of Secondary Sources
- 1.9. List of Primary Sources
- 1.10. Objectives
Chapter 2. Laboratory Developed Tests Market: Executive Summary
- 2.1. Market Outlook
- 2.2. Segment Outlook
- 2.2.1. Technology outlook
- 2.2.2. Application outlook
- 2.2.3. Regional outlook
- 2.3. Competitive Insights
Chapter 3. Laboratory Developed Tests Market: Variables, Trends, & Scope
- 3.1. Market Lineage Outlook
- 3.1.1. Parent market outlook
- 3.1.2. Related/ancillary market outlook
- 3.2. Market Dynamics
- 3.2.1. Market driver analysis
- 3.2.1.1. Increasing demand for in vitro diagnostic tests that are currently unavailable in the market
- 3.2.1.2. Increasing demand for development of personalized medicine
- 3.2.1.3. No requirement for any regulatory approval
- 3.2.2. Market restraint analysis
- 3.2.2.1. High cost associated with the laboratory-developed test
- 3.2.2.2. Efficacy and safety issues related to LDT
- 3.2.1. Market driver analysis
- 3.3. Laboratory Developed Tests (LDT) Market Analysis Tools
- 3.3.1. Industry Analysis - Porter's
- 3.3.1.1. Supplier power
- 3.3.1.2. Buyer power
- 3.3.1.3. Substitution threat
- 3.3.1.4. Threat of new entrant
- 3.3.1.5. Competitive rivalry
- 3.3.2. PESTEL Analysis
- 3.3.2.1. Political landscape
- 3.3.2.2. Technological landscape
- 3.3.2.3. Economic landscape
- 3.3.1. Industry Analysis - Porter's
Chapter 4. Laboratory Developed Tests (LDT) Market: Technology Estimates & Trend Analysis
- 4.1. Technology Market Share, 2023 & 2030
- 4.2. Segment Dashboard
- 4.3. Global Laboratory Developed Tests (LDT) Market by Technology Outlook
- 4.4. Market Size & Forecasts and Trend Analyses, 2018 to 2030 for the following
- 4.4.1. Immunoassays
- 4.4.1.1. Immunoassays market estimates and forecasts, 2018 to 2030 (USD Million)
- 4.4.2. Hematology and Coagulation
- 4.4.2.1. Hematology and coagulation market estimates and forecasts, 2018 to 2030 (USD Million)
- 4.4.3. Molecular Diagnostics
- 4.4.3.1. Molecular diagnostics market estimates and forecasts, 2018 to 2030 (USD Million)
- 4.4.4. Microbiology
- 4.4.4.1. Microbiology market estimates and forecasts, 2018 to 2030 (USD Million)
- 4.4.5. Clinical Chemistry
- 4.4.5.1. Clinical chemistry market estimates and forecasts, 2018 to 2030 (USD Million)
- 4.4.6. Histology/Cytology
- 4.4.6.1. Histology/Cytology market estimates and forecasts, 2018 to 2030 (USD Million)
- 4.4.7. Flow Cytometry
- 4.4.7.1. Flow Cytometry market estimates and forecasts, 2018 to 2030 (USD Million)
- 4.4.8. Mass Spectroscopy
- 4.4.8.1. Mass spectroscopy market estimates and forecasts, 2018 to 2030 (USD Million)
- 4.4.9. Others
- 4.4.9.1. Others market estimates and forecasts, 2018 to 2030 (USD Million)
- 4.4.1. Immunoassays
Chapter 5. Laboratory Developed Tests (LDT) Market: Application Estimates & Trend Analysis
- 5.1. Application Market Share, 2023 & 2030
- 5.2. Segment Dashboard
- 5.3. Global Laboratory Developed Tests (LDT) Market by Application Outlook
- 5.4. Market Size & Forecasts and Trend Analyses, 2018 to 2030 for the following
- 5.4.1. Oncology
- 5.4.1.1. Oncology market estimates and forecasts, 2018 to 2030 (USD Million)
- 5.4.2. Genetic Disorders/Inherited Disease
- 5.4.2.1. Genetic disorders/Inherited disease market estimates and forecasts, 2018 to 2030 (USD Million)
- 5.4.3. Infectious & Parasitic Diseases
- 5.4.3.1. Infectious & parasitic diseases market estimates and forecasts, 2018 to 2030 (USD Million)
- 5.4.4. Immunology
- 5.4.4.1. Immunology market estimates and forecasts, 2018 to 2030 (USD Million)
- 5.4.5. Endocrine
- 5.4.5.1. Endocrine market estimates and forecasts, 2018 to 2030 (USD Million)
- 5.4.6. Nutritional & Metabolic Disease
- 5.4.6.1. Nutritional & metabolic disease market estimates and forecasts, 2018 to 2030 (USD Million)
- 5.4.7. Cardiology
- 5.4.7.1. Cardiology market estimates and forecasts, 2018 to 2030 (USD Million)
- 5.4.8. Mental/Behavioral Disorder
- 5.4.8.1. Mental/Behavioral disorder market estimates and forecasts, 2018 to 2030 (USD Million)
- 5.4.9. Pediatrics-specific Testing
- 5.4.9.1. Pediatrics-specific testing market estimates and forecasts, 2018 to 2030 (USD Million)
- 5.4.10. Hematology/General Blood Testing
- 5.4.10.1. Hematology/General blood testing market estimates and forecasts, 2018 to 2030 (USD Million)
- 5.4.11. Bodily Fluid Analysis
- 5.4.11.1. Bodily fluid analysis market estimates and forecasts, 2018 to 2030 (USD Million)
- 5.4.12. Toxicology
- 5.4.12.1. Toxicology market estimates and forecasts, 2018 to 2030 (USD Million)
- 5.4.13. Other Diseases
- 5.4.13.1. Other diseases market estimates and forecasts, 2018 to 2030 (USD Million)
- 5.4.1. Oncology
Chapter 6. Laboratory Developed Tests (LDT) Market: Regional Estimates & Trend Analysis
- 6.1. Regional Market Share Analysis, 2023 & 2030
- 6.2. Regional Market Dashboard
- 6.3. Global Regional Market Snapshot
- 6.4. Market Size, & Forecasts Trend Analysis, 2018 to 2030:
- 6.5. North America
- 6.5.1. U.S.
- 6.5.1.1. Key country dynamics
- 6.5.1.2. Regulatory framework/ reimbursement structure
- 6.5.1.3. Competitive scenario
- 6.5.1.4. U.S. market estimates and forecasts, 2018 to 2030 (USD Million)
- 6.5.2. Canada
- 6.5.2.1. Key country dynamics
- 6.5.2.2. Regulatory framework/ reimbursement structure
- 6.5.2.3. Competitive scenario
- 6.5.2.4. Canada market estimates and forecasts, 2018 to 2030 (USD Million)
- 6.5.1. U.S.
- 6.6. Europe
- 6.6.1. UK
- 6.6.1.1. Key country dynamics
- 6.6.1.2. Regulatory framework/ reimbursement structure
- 6.6.1.3. Competitive scenario
- 6.6.1.4. UK market estimates and forecasts, 2018 to 2030 (USD Million)
- 6.6.2. Germany
- 6.6.2.1. Key country dynamics
- 6.6.2.2. Regulatory framework/ reimbursement structure
- 6.6.2.3. Competitive scenario
- 6.6.2.4. Germany market estimates and forecasts, 2018 to 2030 (USD Million)
- 6.6.3. France
- 6.6.3.1. Key country dynamics
- 6.6.3.2. Regulatory framework/ reimbursement structure
- 6.6.3.3. Competitive scenario
- 6.6.3.4. France market estimates and forecasts, 2018 to 2030 (USD Million)
- 6.6.4. Italy
- 6.6.4.1. Key country dynamics
- 6.6.4.2. Regulatory framework/ reimbursement structure
- 6.6.4.3. Competitive scenario
- 6.6.4.4. Italy market estimates and forecasts, 2018 to 2030 (USD Million)
- 6.6.5. Spain
- 6.6.5.1. Key country dynamics
- 6.6.5.2. Regulatory framework/ reimbursement structure
- 6.6.5.3. Competitive scenario
- 6.6.5.4. Spain market estimates and forecasts, 2018 to 2030 (USD Million)
- 6.6.6. Norway
- 6.6.6.1. Key country dynamics
- 6.6.6.2. Regulatory framework/ reimbursement structure
- 6.6.6.3. Competitive scenario
- 6.6.6.4. Norway market estimates and forecasts, 2018 to 2030 (USD Million)
- 6.6.7. Sweden
- 6.6.7.1. Key country dynamics
- 6.6.7.2. Regulatory framework/ reimbursement structure
- 6.6.7.3. Competitive scenario
- 6.6.7.4. Sweden market estimates and forecasts, 2018 to 2030 (USD Million)
- 6.6.8. Denmark
- 6.6.8.1. Key country dynamics
- 6.6.8.2. Regulatory framework/ reimbursement structure
- 6.6.8.3. Competitive scenario
- 6.6.8.4. Denmark market estimates and forecasts, 2018 to 2030 (USD Million)
- 6.6.1. UK
- 6.7. Asia Pacific
- 6.7.1. Japan
- 6.7.1.1. Key country dynamics
- 6.7.1.2. Regulatory framework/ reimbursement structure
- 6.7.1.3. Competitive scenario
- 6.7.1.4. Japan market estimates and forecasts, 2018 to 2030 (USD Million)
- 6.7.2. China
- 6.7.2.1. Key country dynamics
- 6.7.2.2. Regulatory framework/ reimbursement structure
- 6.7.2.3. Competitive scenario
- 6.7.2.4. China market estimates and forecasts, 2018 to 2030 (USD Million)
- 6.7.3. India
- 6.7.3.1. Key country dynamics
- 6.7.3.2. Regulatory framework/ reimbursement structure
- 6.7.3.3. Competitive scenario
- 6.7.3.4. India market estimates and forecasts, 2018 to 2030 (USD Million)
- 6.7.4. Australia
- 6.7.4.1. Key country dynamics
- 6.7.4.2. Regulatory framework/ reimbursement structure
- 6.7.4.3. Competitive scenario
- 6.7.4.4. Australia market estimates and forecasts, 2018 to 2030 (USD Million)
- 6.7.5. South Korea
- 6.7.5.1. Key country dynamics
- 6.7.5.2. Regulatory framework/ reimbursement structure
- 6.7.5.3. Competitive scenario
- 6.7.5.4. South Korea market estimates and forecasts, 2018 to 2030 (USD Million)
- 6.7.6. Thailand
- 6.7.6.1. Key country dynamics
- 6.7.6.2. Regulatory framework/ reimbursement structure
- 6.7.6.3. Competitive scenario
- 6.7.6.4. Thailand market estimates and forecasts, 2018 to 2030 (USD Million)
- 6.7.1. Japan
- 6.8. Latin America
- 6.8.1. Brazil
- 6.8.1.1. Key country dynamics
- 6.8.1.2. Regulatory framework/ reimbursement structure
- 6.8.1.3. Competitive scenario
- 6.8.1.4. Brazil market estimates and forecasts, 2018 to 2030 (USD Million)
- 6.8.2. Mexico
- 6.8.2.1. Key country dynamics
- 6.8.2.2. Regulatory framework/ reimbursement structure
- 6.8.2.3. Competitive scenario
- 6.8.2.4. Mexico market estimates and forecasts, 2018 to 2030 (USD Million)
- 6.8.3. Argentina
- 6.8.3.1. Key country dynamics
- 6.8.3.2. Regulatory framework/ reimbursement structure
- 6.8.3.3. Competitive scenario
- 6.8.3.4. Argentina market estimates and forecasts, 2018 to 2030 (USD Million)
- 6.8.1. Brazil
- 6.9. MEA
- 6.9.1. South Africa
- 6.9.1.1. Key country dynamics
- 6.9.1.2. Regulatory framework/ reimbursement structure
- 6.9.1.3. Competitive scenario
- 6.9.1.4. South Africa market estimates and forecasts, 2018 to 2030 (USD Million)
- 6.9.2. Saudi Arabia
- 6.9.2.1. Key country dynamics
- 6.9.2.2. Regulatory framework/ reimbursement structure
- 6.9.2.3. Competitive scenario
- 6.9.2.4. Saudi Arabia market estimates and forecasts, 2018 to 2030 (USD Million)
- 6.9.3. UAE
- 6.9.3.1. Key country dynamics
- 6.9.3.2. Regulatory framework/ reimbursement structure
- 6.9.3.3. Competitive scenario
- 6.9.3.4. UAE market estimates and forecasts, 2018 to 2030 (USD Million)
- 6.9.4. Kuwait
- 6.9.4.1. Key country dynamics
- 6.9.4.2. Regulatory framework/ reimbursement structure
- 6.9.4.3. Competitive scenario
- 6.9.4.4. Kuwait market estimates and forecasts, 2018 to 2030 (USD Million)
- 6.9.1. South Africa
Chapter 7. Competitive Landscape
- 7.1. Recent Developments & Impact Analysis, By Key Market Participants
- 7.2. Company/Competition Categorization
- 7.3. Vendor Landscape
- 7.3.1. List of key distributors and channel partners
- 7.3.2. Key customers
- 7.3.3. Key company market share analysis, 2023
- 7.3.4. Quest Diagnostics Incorporated.
- 7.3.4.1. Company overview
- 7.3.4.2. Financial performance
- 7.3.4.3. Product benchmarking
- 7.3.4.4. Strategic initiatives
- 7.3.5. 23andMe, Inc.
- 7.3.5.1. Company overview
- 7.3.5.2. Financial performance
- 7.3.5.3. Product benchmarking
- 7.3.5.4. Strategic initiatives
- 7.3.6. Abbott
- 7.3.6.1. Company overview
- 7.3.6.2. Financial performance
- 7.3.6.3. Product benchmarking
- 7.3.6.4. Strategic initiatives
- 7.3.7. Guardant Health
- 7.3.7.1. Company overview
- 7.3.7.2. Product benchmarking
- 7.3.7.3. Strategic initiatives
- 7.3.8. NeoGenomics Laboratories.
- 7.3.8.1. Company overview
- 7.3.8.2. Financial performance
- 7.3.8.3. Product benchmarking
- 7.3.8.4. Strategic initiatives
- 7.3.9. QIAGEN
- 7.3.9.1. Company overview
- 7.3.9.2. Financial performance
- 7.3.9.3. Product benchmarking
- 7.3.9.4. Strategic initiatives
- 7.3.10. Siemens Healthineers AG
- 7.3.10.1. Company overview
- 7.3.10.2. Product benchmarking
- 7.3.10.3. Strategic initiatives
- 7.3.11. Illumina, Inc.
- 7.3.11.1. Company overview
- 7.3.11.2. Product benchmarking
- 7.3.11.3. Strategic initiatives
- 7.3.12. F. Hoffmann-La Roche Ltd.
- 7.3.12.1. Company overview
- 7.3.12.2. Product benchmarking
- 7.3.12.3. Strategic initiatives

