|
|
市場調査レポート
商品コード
1493227
ADHD(注意欠如・多動症)の市場規模、シェア、動向分析レポート:医薬品タイプ別、人口統計学別、流通チャネル別、地域別、セグメント予測、2024年~2030年Attention Deficit Hyperactivity Disorder Market Size, Share & Trends Analysis Report By Drug Type (Stimulants, Non-stimulants), By Demographics (Children, Adults), By Distribution Channel, By Region, And Segment Forecasts, 2024 - 2030 |
||||||

|
|||||||
カスタマイズ可能
|
|||||||

| ADHD(注意欠如・多動症)の市場規模、シェア、動向分析レポート:医薬品タイプ別、人口統計学別、流通チャネル別、地域別、セグメント予測、2024年~2030年 |
|
出版日: 2024年05月10日
発行: Grand View Research
ページ情報: 英文 110 Pages
納期: 2~10営業日
|

全表示
- 概要
- 図表
- 目次
ADHD(注意欠如・多動症)市場の成長と動向:
Grand View Research社の最新レポートによると、世界のADHD(注意欠如・多動症)市場規模は2030年までに186億米ドルに達する見込みです。
同市場は2024年から2030年にかけてCAGR 3.7%で拡大する見込みです。ADHD治療用の強力な製品パイプラインの存在とその後の承認が市場成長を後押しすると予想されます。後期段階のパイプラインには、Neurocentria, Inc.が開発したNRCT-101、Supernus Pharmaceuticals, Inc.のSPN-812、Otsuka America Pharmaceutical, Inc.のEB-1020などがあります。
ADHDの早期診断と治療に関して政府機関が行っているいくつかのイニシアチブは、市場の成長をサポートすると思われます。2021年1月、オーストラリア政府はVyvanseを成人ADHD患者の治療薬としてPharmaceutical Benefits Scheme(PBS)に組み入れました。この適用により、Vyvanseは患者に補助金付きで提供されるようになり、2万人以上の患者が低費用で同等の治療を受けています。PBSの助成がなければ、患者は治療費として1人当たり年間1,200米ドル以上を支払わなければならなかった。PBSへの組み入れ後は、1回あたり41.30米ドルで治療が受けられます。このような取り組みも市場の成長を促進すると期待されています。
患者や医師、その他のヘルスケアプロバイダーの間でADHDに対する認識が高まることで、診断や治療に対する需要が高まり、ADHD(注意欠如・多動症)市場の成長を促進する可能性があります。ADHD(注意欠如・多動症)コーチ組織(ACO)は、認知度を高め、研究開発のための資金を生み出し、障害について人々を教育することを意図して、10月をADHD認知月間として祝っています。この取り組みにより早期診断が促進され、製品の普及が進む可能性があります。
しかし、ADHDの子どもは他の精神疾患と併存するリスクが高く、診断や治療が複雑になることが多いです。ルンドベック財団が2021年に発表した調査結果によると、他の精神疾患を併存しているADHD患者は、薬の服用を避ける傾向が強いという。ADHD小児患者に典型的にみられる併存疾患には、うつ病、不安障害、双極性障害、学習障害、早期言語・コミュニケーション障害、反抗性障害などがあります。
さらに、ADHDを治療するための刺激薬が不足しているため、患者は高価なブランド薬にお金を払うことを余儀なくされ、行動療法などの代替療法の余地が生まれ、ADHD薬理療法の需要にマイナスの影響を与えることになります。米国麻薬取締局(DEA)などの規制機関は、誤用や乱用を避けるためにADHD治療薬の生産を制限する厳しい規制を実施しています。需要が増加する中、医薬品が不足する可能性があり、その結果、治療費が上昇し、市場の成長が抑制されます。したがって、医薬品不足は市場の成長を阻害する可能性があります。
ADHD(注意欠如・多動症)市場レポートハイライト
- 薬剤の種類別では、これらの医薬品と症状の管理に対する高い需要、覚せい剤医薬品の使用に対する政府の支援、ADHD(注意欠如・多動症)に関する臨床試験の継続などにより、覚せい剤セグメントが2023年の市場で最大のシェアを占めました。
- 人口統計に基づくと、対象人口が多く、ADHD(注意欠如・多動症)を開拓するリスクが高いことから、2023年のADHD(注意欠如・多動症)市場は成人のセグメントが支配的でした。ADD Health and Wellness Centers, Inc.によると、この障害は成人人口の約4~5%が罹患しています。
- 2023年のADHD(注意欠如・多動症)市場は、市場セグメンテーション部門が支配的であり、予測期間中最も急成長が見込まれています。これは、ADHD(注意欠如・多動症)治療薬が小売薬局で広く入手可能であり、患者が容易に入手できることに起因しています。
- 北米は、治療のために利用可能な薬剤に関するヘルスケア専門家の高い認知度や疾患有病率の上昇などの要因により、2023年の世界市場を独占しました。カナダADHD啓発センター(CADDAC)によると、カナダでは150万人以上がこの病気に罹患しています。
- アジア太平洋地域は、予測期間中に最も急速に成長する地域であると予想され、この地域におけるADHDの有病率と治療需要が増加しています。例えば、ADHDは最も一般的な神経発達疾患の一つであり、オーストラリアでは小児の約8.2%、男児の約11%が診断されています。
目次
第1章 調査手法と範囲
第2章 第2章エグゼクティブサマリー
- 市場見通し
- セグメント展望
- 薬剤タイプの見通し
- 人口動態の見通し
- 流通チャネルの見通し
- 地域展望
- 競合考察
第3章 ADHD(注意欠如・多動症)市場の変数、動向、範囲
- 市場系統の見通し
- 親市場の見通し
- 関連/付随市場の見通し
- 市場力学
- 市場牽引要因分析
- 市場抑制要因分析
- ADHD(注意欠如・多動症)市場分析ツール
- 業界分析- ポーターのファイブフォース分析
- PESTEL分析
第4章 ADHD(注意欠如・多動症)市場:薬剤タイプの推定・動向分析
- 薬剤タイプ別市場シェア、2023年および2030年
- セグメントダッシュボード
- 薬剤タイプ別:世界ADHD(注意欠如・多動症)市場展望
- 2018年から2030年までの市場規模と予測および動向分析
- 精神刺激薬
- 非精神刺激薬
第5章 ADHD(注意欠如・多動症)市場:デモグラフィックの推定・動向分析
- デモグラフィック別市場シェア、2023年および2030年
- セグメントダッシュボード
- デモグラフィック別:世界のADHD(注意欠如・多動症)市場の見通し
- 2018年から2030年までの市場規模と予測および動向分析
- 子供
- 大人
第6章 ADHD(注意欠如・多動症)市場:流通チャネルの推定・動向分析
- 流通チャネル市場シェア、2023年および2030年
- セグメントダッシュボード
- 流通チャネル別;世界ADHD(注意欠如・多動症)市場展望
- 2018年から2030年までの市場規模と予測および動向分析
- 病院薬局
- 小売り薬局
第7章 ADHD(注意欠如・多動症)市場:地域推定・動向分析
- 地域別市場シェア分析、2023年および2030年
- 地域市場ダッシュボード
- 世界地域市場スナップショット
- 市場規模、予測動向分析、2018年から2030年:
- 北米
- 米国
- カナダ
- 欧州
- 英国
- ドイツ
- フランス
- イタリア
- スペイン
- ノルウェー
- スウェーデン
- デンマーク
- アジア太平洋地域
- 日本
- 中国
- インド
- オーストラリア
- 韓国
- タイ
- ラテンアメリカ
- ブラジル
- メキシコ
- アルゼンチン
- 中東・アフリカ
- 南アフリカ
- サウジアラビア
- アラブ首長国連邦
- クウェート
第8章 第8章競合情勢
- 主要市場参入企業による最近の動向と影響分析
- 企業/競合の分類
- ベンダー情勢
- 企業プロファイル
- Pfizer, Inc.
- Johnson &Johnson Services, Inc.
- Lupin
- Novartis AG
- Takeda Pharmaceutical Company Limited
- Mallinckrodt plc.
- Purdue Pharma Lp
- Supernus Pharmaceuticals, Inc.
- NEOS Therapeutics, Inc.
- HS Hospital Service SpA
List of Tables
- Table 1 List of abbreviations
- Table 2 North America attention deficit hyperactivity disorder market, 2018 - 2030 (USD Million)
- Table 3 North America attention deficit hyperactivity disorder market, by drug type, 2018 - 2030 (USD Million)
- Table 4 North America attention deficit hyperactivity disorder market, by demographics, 2018 - 2030 (USD Million)
- Table 5 North America attention deficit hyperactivity disorder market, by distribution channel, 2018 - 2030 (USD Million)
- Table 6 U.S. attention deficit hyperactivity disorder market, by drug type, 2018 - 2030 (USD Million)
- Table 7 U.S. attention deficit hyperactivity disorder market, by demographics, 2018 - 2030 (USD Million)
- Table 8 U.S. attention deficit hyperactivity disorder market, by distribution channel, 2018 - 2030 (USD Million)
- Table 9 Canada attention deficit hyperactivity disorder market, by drug type, 2018 - 2030 (USD Million)
- Table 10 Canada attention deficit hyperactivity disorder market, by demographics, 2018 - 2030 (USD Million)
- Table 11 Canada attention deficit hyperactivity disorder market, by distribution channel, 2018 - 2030 (USD Million)
- Table 12 Europe attention deficit hyperactivity disorder market, by region, 2018 - 2030 (USD Million)
- Table 13 Europe attention deficit hyperactivity disorder market, by drug type, 2018 - 2030 (USD Million)
- Table 14 Europe attention deficit hyperactivity disorder market, by demographics, 2018 - 2030 (USD Million)
- Table 15 Europe attention deficit hyperactivity disorder market, by distribution channel, 2018 - 2030 (USD Million)
- Table 16 Germany attention deficit hyperactivity disorder market, by drug type, 2018 - 2030 (USD Million)
- Table 17 Germany attention deficit hyperactivity disorder market, by demographics, 2018 - 2030 (USD Million)
- Table 18 Germany attention deficit hyperactivity disorder market, by distribution channel, 2018 - 2030 (USD Million)
- Table 19 UK attention deficit hyperactivity disorder market, by drug type, 2018 - 2030 (USD Million)
- Table 20 UK attention deficit hyperactivity disorder market, by demographics, 2018 - 2030 (USD Million)
- Table 21 UK attention deficit hyperactivity disorder market, by distribution channel, 2018 - 2030 (USD Million)
- Table 22 France attention deficit hyperactivity disorder market, by drug type, 2018 - 2030 (USD Million)
- Table 23 France attention deficit hyperactivity disorder market, by demographics, 2018 - 2030 (USD Million)
- Table 24 France attention deficit hyperactivity disorder market, by distribution channel, 2018 - 2030 (USD Million)
- Table 25 Italy attention deficit hyperactivity disorder market, by drug type, 2018 - 2030 (USD Million)
- Table 26 Italy attention deficit hyperactivity disorder market, by demographics, 2018 - 2030 (USD Million)
- Table 27 Italy attention deficit hyperactivity disorder market, by distribution channel, 2018 - 2030 (USD Million)
- Table 28 Spain attention deficit hyperactivity disorder market, by drug type, 2018 - 2030 (USD Million)
- Table 29 Spain attention deficit hyperactivity disorder market, by demographics, 2018 - 2030 (USD Million)
- Table 30 Spain attention deficit hyperactivity disorder market, by distribution channel, 2018 - 2030 (USD Million)
- Table 31 Denmark attention deficit hyperactivity disorder market, by drug type, 2018 - 2030 (USD Million)
- Table 32 Denmark attention deficit hyperactivity disorder market, by demographics, 2018 - 2030 (USD Million)
- Table 33 Denmark attention deficit hyperactivity disorder market, by distribution channel, 2018 - 2030 (USD Million)
- Table 34 Sweden attention deficit hyperactivity disorder market, by drug type, 2018 - 2030 (USD Million)
- Table 35 Sweden attention deficit hyperactivity disorder market, by demographics, 2018 - 2030 (USD Million)
- Table 36 Sweden attention deficit hyperactivity disorder market, by distribution channel, 2018 - 2030 (USD Million)
- Table 37 Norway attention deficit hyperactivity disorder market, by drug type, 2018 - 2030 (USD Million)
- Table 38 Norway attention deficit hyperactivity disorder market, by demographics, 2018 - 2030 (USD Million)
- Table 39 Norway attention deficit hyperactivity disorder market, by distribution channel, 2018 - 2030 (USD Million)
- Table 40 Asia Pacific attention deficit hyperactivity disorder market, by region, 2018 - 2030 (USD Million)
- Table 41 Asia Pacific attention deficit hyperactivity disorder market, by drug type, 2018 - 2030 (USD Million)
- Table 42 Asia Pacific attention deficit hyperactivity disorder market, by demographics, 2018 - 2030 (USD Million)
- Table 43 Asia Pacific attention deficit hyperactivity disorder market, by distribution channel, 2018 - 2030 (USD Million)
- Table 44 Japan attention deficit hyperactivity disorder market, by drug type, 2018 - 2030 (USD Million)
- Table 45 Japan attention deficit hyperactivity disorder market, by demographics, 2018 - 2030 (USD Million)
- Table 46 Japan attention deficit hyperactivity disorder market, by distribution channel, 2018 - 2030 (USD Million)
- Table 47 China attention deficit hyperactivity disorder market, by drug type, 2018 - 2030 (USD Million)
- Table 48 China attention deficit hyperactivity disorder market, by demographics, 2018 - 2030 (USD Million)
- Table 49 China attention deficit hyperactivity disorder market, by distribution channel, 2018 - 2030 (USD Million)
- Table 50 India attention deficit hyperactivity disorder market, by drug type, 2018 - 2030 (USD Million)
- Table 51 India attention deficit hyperactivity disorder market, by demographics, 2018 - 2030 (USD Million)
- Table 52 India attention deficit hyperactivity disorder market, by distribution channel, 2018 - 2030 (USD Million)
- Table 53 South Korea attention deficit hyperactivity disorder market, by drug type, 2018 - 2030 (USD Million)
- Table 54 South Korea attention deficit hyperactivity disorder market, by demographics, 2018 - 2030 (USD Million)
- Table 55 South Korea attention deficit hyperactivity disorder market, by distribution channel, 2018 - 2030 (USD Million)
- Table 56 Australia attention deficit hyperactivity disorder market, by drug type, 2018 - 2030 (USD Million)
- Table 57 Australia attention deficit hyperactivity disorder market, by demographics, 2018 - 2030 (USD Million)
- Table 58 Australia attention deficit hyperactivity disorder market, by distribution channel, 2018 - 2030 (USD Million)
- Table 59 Thailand attention deficit hyperactivity disorder market, by drug type, 2018 - 2030 (USD Million)
- Table 60 Thailand attention deficit hyperactivity disorder market, by demographics, 2018 - 2030 (USD Million)
- Table 61 Thailand attention deficit hyperactivity disorder market, by distribution channel, 2018 - 2030 (USD Million)
- Table 62 Latin America attention deficit hyperactivity disorder market, by region, 2018 - 2030 (USD Million)
- Table 63 Latin America attention deficit hyperactivity disorder market, by drug type, 2018 - 2030 (USD Million)
- Table 64 Latin America attention deficit hyperactivity disorder market, by demographics, 2018 - 2030 (USD Million)
- Table 65 Latin America attention deficit hyperactivity disorder n market, by distribution channel, 2018 - 2030 (USD Million)
- Table 66 Brazil attention deficit hyperactivity disorder market, by drug type, 2018 - 2030 (USD Million)
- Table 67 Brazil attention deficit hyperactivity disorder market, by demographics, 2018 - 2030 (USD Million)
- Table 68 Brazil attention deficit hyperactivity disorder market, by distribution channel, 2018 - 2030 (USD Million)
- Table 69 Brazil attention deficit hyperactivity disorder market, by distribution channel, 2018 - 2030 (USD Million)
- Table 70 Brazil attention deficit hyperactivity disorder market, by distribution channel, 2018 - 2030 (USD Million)
- Table 71 Brazil attention deficit hyperactivity disorder market, by distribution channel, 2018 - 2030 (USD Million)
- Table 72 Mexico attention deficit hyperactivity disorder market, by drug type, 2018 - 2030 (USD Million)
- Table 73 Mexico attention deficit hyperactivity disorder market, by demographics, 2018 - 2030 (USD Million)
- Table 74 Mexico attention deficit hyperactivity disorder market, by distribution channel, 2018 - 2030 (USD Million)
- Table 75 Argentina attention deficit hyperactivity disorder market, by drug type, 2018 - 2030 (USD Million)
- Table 76 Argentina attention deficit hyperactivity disorder market, by demographics, 2018 - 2030 (USD Million)
- Table 77 Argentina attention deficit hyperactivity disorder market, by distribution channel, 2018 - 2030 (USD Million)
- Table 78 MEA Attention deficit hyperactivity disorder market, by region, 2018 - 2030 (USD Million)
- Table 79 MEA attention deficit hyperactivity disorder market, by drug type, 2018 - 2030 (USD Million)
- Table 80 MEA attention deficit hyperactivity disorder market, by demographics, 2018 - 2030 (USD Million)
- Table 81 MEA attention deficit hyperactivity disorder market, by distribution channel, 2018 - 2030 (USD Million)
- Table 82 South Africa attention deficit hyperactivity disorder market, by drug type, 2018 - 2030 (USD Million)
- Table 83 South Africa attention deficit hyperactivity disorder market, by demographics, 2018 - 2030 (USD Million)
- Table 84 South Africa attention deficit hyperactivity disorder market, by distribution channel, 2018 - 2030 (USD Million)
- Table 85 Saudi Arabia attention deficit hyperactivity disorder market, by drug type, 2018 - 2030 (USD Million)
- Table 86 Saudi Arabia attention deficit hyperactivity disorder market, by demographics, 2018 - 2030 (USD Million)
- Table 87 Saudi Arabia attention deficit hyperactivity disorder market, by distribution channel, 2018 - 2030 (USD Million)
- Table 88 UAE attention deficit hyperactivity disorder market, by drug type, 2018 - 2030 (USD Million)
- Table 89 UAE attention deficit hyperactivity disorder market, by demographics, 2018 - 2030 (USD Million)
- Table 90 UAE attention deficit hyperactivity disorder market, by distribution channel, 2018 - 2030 (USD Million)
- Table 91 Kuwait attention deficit hyperactivity disorder market, by drug type, 2018 - 2030 (USD Million)
- Table 92 Kuwait attention deficit hyperactivity disorder market, by demographics, 2018 - 2030 (USD Million)
- Table 93 Kuwait attention deficit hyperactivity disorder market, by distribution channel, 2018 - 2030 (USD Million)
List of Figures
- Fig. 1 Market research process
- Fig. 2 Data triangulation techniques
- Fig. 3 Primary research pattern
- Fig. 4 Market research approaches
- Fig. 5 Value-chain-based sizing & forecasting
- Fig. 6 QFD modeling for market share assessment
- Fig. 7 Market formulation & validation
- Fig. 8 Attention deficit hyperactivity disorder market: Market outlook
- Fig. 9 Attention deficit hyperactivity disorder market: Competitive insights
- Fig. 10 Parent market outlook
- Fig. 11 Related/ancillary market outlook
- Fig. 12 Penetration and growth prospect mapping
- Fig. 13 Attention deficit hyperactivity disorder market driver impact
- Fig. 14 Attention deficit hyperactivity disorder market restraint impact
- Fig. 15 Attention deficit hyperactivity disorder market: Drug type movement analysis
- Fig. 16 Attention deficit hyperactivity disorder market: Drug type outlook and key takeaways
- Fig. 17 Stimulants market estimates and forecasts, 2018 - 2030 (USD Million)
- Fig. 18 Amphetamine market estimates and forecasts, 2018 - 2030 (USD Million)
- Fig. 19 Methylphenidate market estimates and forecasts, 2018 - 2030 (USD Million)
- Fig. 20 Lisdexamfetamine market estimates and forecasts, 2018 - 2030 (USD Million)
- Fig. 21 Dexmethylphenidate market estimates and forecasts, 2018 - 2030 (USD Million)
- Fig. 22 Non-stimulants market estimates and forecasts, 2018 - 2030 (USD Million)
- Fig. 23 Atomoxetine market estimates and forecasts, 2018 - 2030 (USD Million)
- Fig. 24 Guanfacine market estimates and forecasts, 2018 - 2030 (USD Million)
- Fig. 25 Clonidine market estimates and forecasts, 2018 - 2030 (USD Million)
- Fig. 26 Others market estimates and forecasts, 2018 - 2030 (USD Million)
- Fig. 27 Attention deficit hyperactivity disorder Market: Demographics movement Analysis
- Fig. 28 Attention deficit hyperactivity disorder market: Demographics outlook and key takeaways
- Fig. 29 Children market estimates and forecasts, 2018 - 2030 (USD Million)
- Fig. 30 Adults market estimates and forecasts, 2018 - 2030 (USD Million)
- Fig. 31 Attention deficit hyperactivity disorder market: Distribution channel movement analysis
- Fig. 32 Attention deficit hyperactivity disorder market: Distribution channel outlook and key takeaways
- Fig. 33 Hospital pharmacy; market estimates and forecasts, 2018 - 2030 (USD Million)
- Fig. 34 Retail pharmacy market estimates and forecasts, 2018 - 2030 (USD Million)
- Fig. 35 Global attention deficit hyperactivity disorder market: Regional movement analysis
- Fig. 36 Global attention deficit hyperactivity disorder market: Regional outlook and key takeaways
- Fig. 37 North America
- Fig. 38 North America market estimates and forecasts, 2018 - 2030 (USD Million)
- Fig. 39 U.S.
- Fig. 40 U.S. market estimates and forecasts, 2018 - 2030 (USD Million)
- Fig. 41 Canada
- Fig. 42 Canada market estimates and forecasts, 2018 - 2030 (USD Million)
- Fig. 43 Europe
- Fig. 44 Europe market estimates and forecasts, 2018 - 2030 (USD Million)
- Fig. 45 UK
- Fig. 46 UK market estimates and forecasts, 2018 - 2030 (USD Million)
- Fig. 47 Germany
- Fig. 48 Germany market estimates and forecasts, 2018 - 2030 (USD Million)
- Fig. 49 France
- Fig. 50 France market estimates and forecasts, 2018 - 2030 (USD Million)
- Fig. 51 Italy
- Fig. 52 Italy market estimates and forecasts, 2018 - 2030 (USD Million)
- Fig. 53 Spain
- Fig. 54 Spain market estimates and forecasts, 2018 - 2030 (USD Million)
- Fig. 55 Denmark
- Fig. 56 Denmark market estimates and forecasts, 2018 - 2030 (USD Million)
- Fig. 57 Sweden
- Fig. 58 Sweden market estimates and forecasts, 2018 - 2030 (USD Million)
- Fig. 59 Norway
- Fig. 60 Norway market estimates and forecasts, 2018 - 2030 (USD Million)
- Fig. 61 Asia Pacific
- Fig. 62 Asia Pacific market estimates and forecasts, 2018 - 2030 (USD Million)
- Fig. 63 Japan
- Fig. 64 Japan market estimates and forecasts, 2018 - 2030 (USD Million)
- Fig. 65 China
- Fig. 66 China market estimates and forecasts, 2018 - 2030 (USD Million)
- Fig. 67 India
- Fig. 68 India market estimates and forecasts, 2018 - 2030 (USD Million)
- Fig. 69 South Korea
- Fig. 70 South Korea market estimates and forecasts, 2018 - 2030 (USD Million)
- Fig. 71 Australia
- Fig. 72 Australia market estimates and forecasts, 2018 - 2030 (USD Million)
- Fig. 73 Thailand
- Fig. 74 Thailand market estimates and forecasts, 2018 - 2030 (USD Million)
- Fig. 75 Latin America
- Fig. 76 Latin America market estimates and forecasts, 2018 - 2030 (USD Million)
- Fig. 77 Brazil
- Fig. 78 Brazil market estimates and forecasts, 2018 - 2030 (USD Million)
- Fig. 79 Mexico
- Fig. 80 Mexico market estimates and forecasts, 2018 - 2030 (USD Million)
- Fig. 81 Argentina
- Fig. 82 Argentina market estimates and forecasts, 2018 - 2030 (USD Million)
- Fig. 83 Middle East and Africa
- Fig. 84 Middle East and Africa market estimates and forecasts, 2018 - 2030 (USD Million)
- Fig. 85 South Africa
- Fig. 86 South Africa market estimates and forecasts, 2018 - 2030 (USD Million)
- Fig. 87 Saudi Arabia
- Fig. 88 Saudi Arabia market estimates and forecasts, 2018 - 2030 (USD Million)
- Fig. 89 UAE
- Fig. 90 UAE market estimates and forecasts, 2018 - 2030 (USD Million)
- Fig. 91 Kuwait
- Fig. 92 Kuwait market estimates and forecasts, 2018 - 2030 (USD Million)
Attention Deficit Hyperactivity Disorder Market Growth & Trends:
The global attention deficit hyperactivity disorder market size is expected to reach USD 18.6 billion by 2030, according to a new report by Grand View Research, Inc. The market is expected to expand at a CAGR of 3.7% from 2024 to 2030. The presence of a strong product pipeline for the treatment of ADHD and their subsequent approval is expected to boost the market growth. Some late-stage pipeline products are NRCT-101 developed by Neurocentria, Inc., SPN-812 by Supernus Pharmaceuticals, Inc., and EB-1020 by Otsuka America Pharmaceutical, Inc.
Several initiatives undertaken by government bodies regarding early diagnosis and treatment of ADHD are likely to support the market growth. In January 2021, the Australian Government included Vyvanse under its Pharmaceutical Benefits Scheme (PBS) for the treatment of adult patients with ADHD. This inclusion makes the availability of Vyvanse at a subsidized rate to patients and more than 20,000 patients received a comparable treatment for the disease at low cost and benefits. Without PBS subsidy, the patients had to pay more than USD 1,200 per person annually for their treatment. After the inclusion in PBS, they will receive the treatment at USD 41.30 per script. Such initiatives are also expected to drive market growth.
Increasing awareness about ADHD among patients, physicians, and other healthcare providers may increase the demand for diagnosis and treatment which in turn propel the growth of the attention deficit hyperactivity disorder market. The Attention Deficit Hyperactivity Disorder Coaches Organization (ACO) celebrates October as the ADHD awareness month intending to raise awareness, generate funding for R&D, and educate people about disorders. This initiative may boost early diagnosis, thereby, increasing product penetration.
However, the risk of comorbidity with other psychiatric disorders is high among children with ADHD, often making diagnosis and treatment of the disorder complex. A research study published by the Lundbeck Foundation in 2021 showed that ADHD patients with other psychiatric comorbid conditions were more likely to avoid taking medicines. Some of the comorbid conditions that typically occur in ADHD pediatric patients are depression, anxiety, bipolar disorder, learning disorder, early speech/communication problems, and oppositional defiant disorder.
Furthermore, the shortage of stimulants to treat ADHD has forced patients to pay for expensive branded medication and create scope for substitute therapies, such as behavioral therapy, which will negatively impact the demand for ADHD pharmacological therapies. Strict regulations are implemented by regulatory bodies, such as the U.S. Drug Enforcement Administration (DEA), which limit the production of ADHD drugs to avoid misuse or abuse. Amid an increase in demand, this can create a shortage of medical products, consequently increasing the cost of treatments and restraining market growth. Thus, the shortage of medicines may impede the market growth.
Attention Deficit Hyperactivity Disorder Market Report Highlights:
- By drug type, the stimulants segment accounted for the largest share of the market in 2023 due to the high demand for these medicines and the management of symptoms, government support for the use of stimulants drugs, and continuing clinical trials regarding attention deficit hyperactive disorder
- Based on demographics, the adults segment dominated the attention-deficit hyperactivity disorder market in 2023 owing to the large target population base and high risk of developing the attention-deficit hyperactive disorder. According to ADD Health and Wellness Centers, Inc. the disorder affects approximately 4-5% of the adult population
- Retail pharmacy segment dominated the attention-deficit hyperactivity disorder market in 2023 and is anticipated to witness the fastest growth over the forecast period. This can be attributed to the wide availability of attention deficit hyperactivity disorder drugs at retail pharmacies and their ease of accessibility to patients
- North America dominated the global market in 2023 owing to factors such as high awareness among healthcare professionals about drugs available for treatment and the rise in disease prevalence. According to the Center for ADHD Awareness Canada (CADDAC), more than 1.5 million people are affected by the disease in Canad
- Asia Pacific is expected to be the fastest-growing region during the forecast period to increasing ADHD prevalence and treatment demand in the region. For instance, ADHD is one of the most common neurodevelopment diseases with approximately 8.2% of children and 11% of boys diagnosed in Australia
Table of Contents
Chapter 1. Methodology and Scope
- 1.1. Market Segmentation & Scope
- 1.2. Segment Definitions
- 1.2.1. Drug type
- 1.2.2. Demographics
- 1.2.3. Distribution channel
- 1.2.4. Regional scope
- 1.2.5. Estimates and forecasts timeline
- 1.3. Research Methodology
- 1.4. Information Procurement
- 1.4.1. Purchased database
- 1.4.2. GVR's internal database
- 1.4.3. Secondary sources
- 1.5. Information or Data Analysis
- 1.5.1. Data analysis models
- 1.6. Market Formulation & Validation
- 1.7. Model Details
- 1.7.1. Commodity flow analysis (Model 1)
- 1.7.2. Volume price analysis (Model 2)
- 1.8. List of Secondary Sources
- 1.9. List of Primary Sources
- 1.10. Objectives
Chapter 2. Chapter 2 Executive Summary
- 2.1. Market Outlook
- 2.2. Segment Outlook
- 2.2.1. Drug type outlook
- 2.2.2. Demographics outlook
- 2.2.3. Distribution channel outlook
- 2.2.4. Regional outlook
- 2.3. Competitive Insights
Chapter 3. Attention Deficit Hyperactivity Disorder Market Variables, Trends & Scope
- 3.1. Market Lineage Outlook
- 3.1.1. Parent market outlook
- 3.1.2. Related/ancillary market outlook
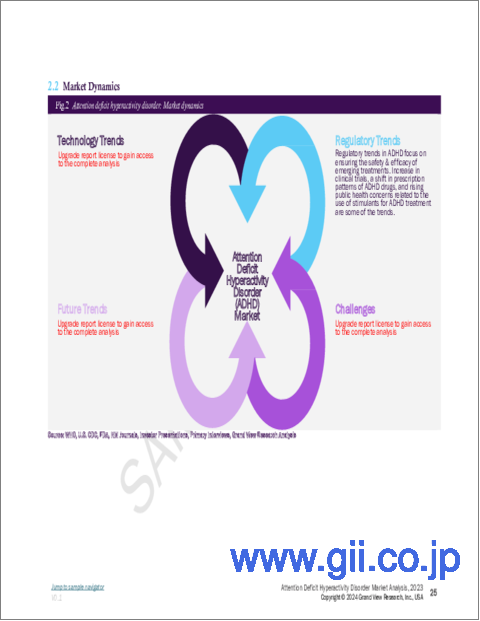
- 3.2. Market Dynamics
- 3.2.1. Market driver analysis
- 3.2.1.1. Increasing prevalence of ADHD
- 3.2.1.2. Increasing awareness about ADHD Among Physicians And Patients
- 3.2.2. Market restraint analysis
- 3.2.2.1. Shortage of ADHD drugs
- 3.2.2.2. Low availability of non-stimulant ADHD drugs
- 3.2.2.3. Comorbidities leading to underdiagnosis in children
- 3.2.1. Market driver analysis
- 3.3. Attention Deficit Hyperactivity Disorder Market Analysis Tools
- 3.3.1. Industry Analysis - Porter's
- 3.3.1.1. Supplier power
- 3.3.1.2. Buyer power
- 3.3.1.3. Substitution threat
- 3.3.1.4. Threat of new entrant
- 3.3.1.5. Competitive rivalry
- 3.3.2. PESTEL Analysis
- 3.3.2.1. Political landscape
- 3.3.2.2. Technological landscape
- 3.3.2.3. Economic landscape
- 3.3.1. Industry Analysis - Porter's
Chapter 4. Attention Deficit Hyperactivity Disorder Market: Drug Type Estimates & Trend Analysis
- 4.1. Drug Type Market Share, 2023 & 2030
- 4.2. Segment Dashboard
- 4.3. Global Attention Deficit Hyperactivity Disorder Market by Drug Type Outlook
- 4.4. Market Size & Forecasts and Trend Analyses, 2018 to 2030 for the Following
- 4.4.1. Stimulants
- 4.4.1.1. Market estimates and forecasts 2018 to 2030 (USD Million)
- 4.4.1.2. Amphetamine
- 4.4.1.2.1. Market estimates and forecasts 2018 to 2030 (USD Million)
- 4.4.1.3. Methylphenidate
- 4.4.1.3.1. Market estimates and forecasts 2018 to 2030 (USD Million)
- 4.4.1.4. Lisdexamfetamine
- 4.4.1.4.1. Market estimates and forecasts 2018 to 2030 (USD Million)
- 4.4.1.5. Dexmethylphenidate
- 4.4.1.5.1. Market estimates and forecasts 2018 to 2030 (USD Million)
- 4.4.2. Non stimulants
- 4.4.2.1. Market estimates and forecasts 2018 to 2030 (USD Million)
- 4.4.2.2. Atomoxetine
- 4.4.2.2.1. Market estimates and forecasts 2018 to 2030 (USD Million)
- 4.4.2.3. Guanfacine
- 4.4.2.3.1. Market estimates and forecasts 2018 to 2030 (USD Million)
- 4.4.2.4. Clonidine
- 4.4.2.4.1. Market estimates and forecasts 2018 to 2030 (USD Million)
- 4.4.2.5. Others
- 4.4.2.5.1. Market estimates and forecasts 2018 to 2030 (USD Million)
- 4.4.1. Stimulants
Chapter 5. Attention Deficit Hyperactivity Disorder Market: Demographics Estimates & Trend Analysis
- 5.1. Demographics Market Share, 2023 & 2030
- 5.2. Segment Dashboard
- 5.3. Global Attention Deficit Hyperactivity Disorder Market by Demographics Outlook
- 5.4. Market Size & Forecasts and Trend Analyses, 2018 to 2030 for the Following
- 5.4.1. Children
- 5.4.1.1. Market estimates and forecasts 2018 to 2030 (USD Million)
- 5.4.2. Adults
- 5.4.2.1. Market estimates and forecasts 2018 to 2030 (USD Million)
- 5.4.1. Children
Chapter 6. Attention Deficit Hyperactivity Disorder Market: Distribution Channel Estimates & Trend Analysis
- 6.1. Distribution Channel Market Share, 2023 & 2030
- 6.2. Segment Dashboard
- 6.3. Global Attention Deficit Hyperactivity Disorder Market by Distribution Channel Outlook
- 6.4. Market Size & Forecasts and Trend Analyses, 2018 to 2030 for the Following
- 6.4.1. Hospital pharmacy
- 6.4.1.1. Market estimates and forecasts 2018 to 2030 (USD Million)
- 6.4.2. Retail pharmacy
- 6.4.2.1. Market estimates and forecasts 2018 to 2030 (USD Million)
- 6.4.1. Hospital pharmacy
Chapter 7. Attention Deficit Hyperactivity Disorder Market: Regional Estimates & Trend Analysis
- 7.1. Regional Market Share Analysis, 2023 & 2030
- 7.2. Regional Market Dashboard
- 7.3. Global Regional Market Snapshot
- 7.4. Market Size, & Forecasts Trend Analysis, 2018 to 2030:
- 7.5. North America
- 7.5.1. U.S.
- 7.5.1.1. Key country dynamics
- 7.5.1.2. Regulatory framework/ reimbursement structure
- 7.5.1.3. Competitive scenario
- 7.5.1.4. U.S. market estimates and forecasts 2018 to 2030 (USD Million)
- 7.5.2. Canada
- 7.5.2.1. Key country dynamics
- 7.5.2.2. Regulatory framework/ reimbursement structure
- 7.5.2.3. Competitive scenario
- 7.5.2.4. Canada market estimates and forecasts 2018 to 2030 (USD Million)
- 7.5.1. U.S.
- 7.6. Europe
- 7.6.1. UK
- 7.6.1.1. Key country dynamics
- 7.6.1.2. Regulatory framework/ reimbursement structure
- 7.6.1.3. Competitive scenario
- 7.6.1.4. UK market estimates and forecasts 2018 to 2030 (USD Million)
- 7.6.2. Germany
- 7.6.2.1. Key country dynamics
- 7.6.2.2. Regulatory framework/ reimbursement structure
- 7.6.2.3. Competitive scenario
- 7.6.2.4. Germany market estimates and forecasts 2018 to 2030 (USD Million)
- 7.6.3. France
- 7.6.3.1. Key country dynamics
- 7.6.3.2. Regulatory framework/ reimbursement structure
- 7.6.3.3. Competitive scenario
- 7.6.3.4. France market estimates and forecasts 2018 to 2030 (USD Million)
- 7.6.4. Italy
- 7.6.4.1. Key country dynamics
- 7.6.4.2. Regulatory framework/ reimbursement structure
- 7.6.4.3. Competitive scenario
- 7.6.4.4. Italy market estimates and forecasts 2018 to 2030 (USD Million)
- 7.6.5. Spain
- 7.6.5.1. Key country dynamics
- 7.6.5.2. Regulatory framework/ reimbursement structure
- 7.6.5.3. Competitive scenario
- 7.6.5.4. Spain market estimates and forecasts 2018 to 2030 (USD Million)
- 7.6.6. Norway
- 7.6.6.1. Key country dynamics
- 7.6.6.2. Regulatory framework/ reimbursement structure
- 7.6.6.3. Competitive scenario
- 7.6.6.4. Norway market estimates and forecasts 2018 to 2030 (USD Million)
- 7.6.7. Sweden
- 7.6.7.1. Key country dynamics
- 7.6.7.2. Regulatory framework/ reimbursement structure
- 7.6.7.3. Competitive scenario
- 7.6.7.4. Sweden market estimates and forecasts 2018 to 2030 (USD Million)
- 7.6.8. Denmark
- 7.6.8.1. Key country dynamics
- 7.6.8.2. Regulatory framework/ reimbursement structure
- 7.6.8.3. Competitive scenario
- 7.6.8.4. Denmark market estimates and forecasts 2018 to 2030 (USD Million)
- 7.6.1. UK
- 7.7. Asia Pacific
- 7.7.1. Japan
- 7.7.1.1. Key country dynamics
- 7.7.1.2. Regulatory framework/ reimbursement structure
- 7.7.1.3. Competitive scenario
- 7.7.1.4. Japan market estimates and forecasts 2018 to 2030 (USD Million)
- 7.7.2. China
- 7.7.2.1. Key country dynamics
- 7.7.2.2. Regulatory framework/ reimbursement structure
- 7.7.2.3. Competitive scenario
- 7.7.2.4. China market estimates and forecasts 2018 to 2030 (USD Million)
- 7.7.3. India
- 7.7.3.1. Key country dynamics
- 7.7.3.2. Regulatory framework/ reimbursement structure
- 7.7.3.3. Competitive scenario
- 7.7.3.4. India market estimates and forecasts 2018 to 2030 (USD Million)
- 7.7.4. Australia
- 7.7.4.1. Key country dynamics
- 7.7.4.2. Regulatory framework/ reimbursement structure
- 7.7.4.3. Competitive scenario
- 7.7.4.4. Australia market estimates and forecasts 2018 to 2030 (USD Million)
- 7.7.5. South Korea
- 7.7.5.1. Key country dynamics
- 7.7.5.2. Regulatory framework/ reimbursement structure
- 7.7.5.3. Competitive scenario
- 7.7.5.4. South Korea market estimates and forecasts 2018 to 2030 (USD Million)
- 7.7.6. Thailand
- 7.7.6.1. Key country dynamics
- 7.7.6.2. Regulatory framework/ reimbursement structure
- 7.7.6.3. Competitive scenario
- 7.7.6.4. Thailand market estimates and forecasts 2018 to 2030 (USD Million)
- 7.7.1. Japan
- 7.8. Latin America
- 7.8.1. Brazil
- 7.8.1.1. Key country dynamics
- 7.8.1.2. Regulatory framework/ reimbursement structure
- 7.8.1.3. Competitive scenario
- 7.8.1.4. Brazil market estimates and forecasts 2018 to 2030 (USD Million)
- 7.8.2. Mexico
- 7.8.2.1. Key country dynamics
- 7.8.2.2. Regulatory framework/ reimbursement structure
- 7.8.2.3. Competitive scenario
- 7.8.2.4. Mexico market estimates and forecasts 2018 to 2030 (USD Million)
- 7.8.3. Argentina
- 7.8.3.1. Key country dynamics
- 7.8.3.2. Regulatory framework/ reimbursement structure
- 7.8.3.3. Competitive scenario
- 7.8.3.4. Argentina market estimates and forecasts 2018 to 2030 (USD Million)
- 7.8.1. Brazil
- 7.9. MEA
- 7.9.1. South Africa
- 7.9.1.1. Key country dynamics
- 7.9.1.2. Regulatory framework/ reimbursement structure
- 7.9.1.3. Competitive scenario
- 7.9.1.4. South Africa market estimates and forecasts 2018 to 2030 (USD Million)
- 7.9.2. Saudi Arabia
- 7.9.2.1. Key country dynamics
- 7.9.2.2. Regulatory framework/ reimbursement structure
- 7.9.2.3. Competitive scenario
- 7.9.2.4. Saudi Arabia market estimates and forecasts 2018 to 2030 (USD Million)
- 7.9.3. UAE
- 7.9.3.1. Key country dynamics
- 7.9.3.2. Regulatory framework/ reimbursement structure
- 7.9.3.3. Competitive scenario
- 7.9.3.4. UAE market estimates and forecasts 2018 to 2030 (USD Million)
- 7.9.4. Kuwait
- 7.9.4.1. Key country dynamics
- 7.9.4.2. Regulatory framework/ reimbursement structure
- 7.9.4.3. Competitive scenario
- 7.9.4.4. Kuwait market estimates and forecasts 2018 to 2030 (USD Million)
- 7.9.1. South Africa
Chapter 8. Chapter 8 Competitive Landscape
- 8.1. Recent Developments & Impact Analysis, By Key Market Participants
- 8.2. Company/Competition Categorization
- 8.3. Vendor Landscape
- 8.3.1. List of key distributors and channel partners
- 8.3.2. Key customers
- 8.3.3. Key company heat map analysis, 2023
- 8.4. Company Profiles
- 8.4.1. Pfizer, Inc.
- 8.4.1.1. Company overview
- 8.4.1.2. Financial performance
- 8.4.1.3. Product benchmarking
- 8.4.1.4. Strategic initiatives
- 8.4.2. Johnson & Johnson Services, Inc.
- 8.4.2.1. Company overview
- 8.4.2.2. Financial performance
- 8.4.2.3. Product benchmarking
- 8.4.2.4. Strategic initiatives
- 8.4.3. Lupin
- 8.4.3.1. Company overview
- 8.4.3.2. Financial performance
- 8.4.3.3. Product benchmarking
- 8.4.3.4. Strategic initiatives
- 8.4.4. Novartis AG
- 8.4.4.1. Company overview
- 8.4.4.2. Financial performance
- 8.4.4.3. Product benchmarking
- 8.4.4.4. Strategic initiatives
- 8.4.5. Takeda Pharmaceutical Company Limited
- 8.4.5.1. Company overview
- 8.4.5.2. Financial performance
- 8.4.5.3. Product benchmarking
- 8.4.5.4. Strategic initiatives
- 8.4.6. Mallinckrodt plc.
- 8.4.6.1. Company overview
- 8.4.6.2. Financial performance
- 8.4.6.3. Product benchmarking
- 8.4.6.4. Strategic initiatives
- 8.4.7. Purdue Pharma L.p
- 8.4.7.1. Company overview
- 8.4.7.2. Financial performance
- 8.4.7.3. Product benchmarking
- 8.4.7.4. Strategic initiatives
- 8.4.8. Supernus Pharmaceuticals, Inc.
- 8.4.8.1. Company overview
- 8.4.8.2. Financial performance
- 8.4.8.3. Product benchmarking
- 8.4.8.4. Strategic initiatives
- 8.4.9. NEOS Therapeutics, Inc.
- 8.4.9.1. Company overview
- 8.4.9.2. Financial performance
- 8.4.9.3. Product benchmarking
- 8.4.9.4. Strategic initiatives
- 8.4.10. H.S. Hospital Service S.p.A.
- 8.4.10.1. Company overview
- 8.4.10.2. Financial performance
- 8.4.10.3. Product benchmarking
- 8.4.10.4. Strategic initiatives
- 8.4.1. Pfizer, Inc.

