|
|
市場調査レポート
商品コード
1405964
サングラスの市場規模、シェア、動向分析レポート:製品別、材料別、流通チャネル別、地域別、セグメント予測、2024年~2030年Sunglasses Market Size, Share & Trends Analysis Report By Product (Polarized, Non-polarized), By Material (CR-39, Polycarbonate, Polyurethane), By Distribution Channel (Online, Offline), By Region, And Segment Forecasts, 2024 - 2030 |
||||||
|
|
|||||||
カスタマイズ可能
|
|||||||


| サングラスの市場規模、シェア、動向分析レポート:製品別、材料別、流通チャネル別、地域別、セグメント予測、2024年~2030年 |
|
出版日: 2023年12月11日
発行: Grand View Research
ページ情報: 英文 131 Pages
納期: 2~10営業日
|

- 全表示
- 概要
- 図表
- 目次
サングラス市場の成長と動向:
Grand View Research, Inc.の最新レポートによると、サングラスの世界市場規模は2030年に364億4,000万米ドルに達すると推定され、2024年から2030年にかけて5.6%のCAGRで成長すると予測されています。
世界市場は長年一貫して成長しており、有害な紫外線から目を保護することの重要性と、サングラスが与えるスタイルの主張に対する消費者の認識が高まっています。この動向は今後も続くと予想され、特に目の健康に対する意識が高まるにつれて、投資対象として有利な分野となっています。
サングラスの需要拡大に加え、市場は多様性に富んでおり、ニッチ製品やブランディングの余地が十分にあります。様々なスタイル、材料、技術が幅広い消費者の嗜好に対応しています。ハイエンドのデザイナーズ・サングラスから手頃な価格の機能的オプションまで、あらゆる予算に対応するセグメントがあります。プレーヤーは、環境に優しい材料、カスタマイズ可能なフレーム、高度なUVカットなど、特定のニッチに焦点を当て、市場で独自のスペースを切り開くことができます。
さらに、ファッション業界がサングラスに与える影響も軽視できないです。サングラスはファッション界で欠かせないアクセサリーとなり、あらゆる年代の人々の定番となっています。そのため、革新的なデザインやファッションブランドとのコラボレーションの道が開かれ、季節ごとの動向の波に乗れる可能性があります。
サングラスブランドはファッションハウスと提携し、限定コレクションを発表しています。サングラスブランドとファッションハウスのコラボレーションは話題を呼び、消費者の注目を集める。このようなパートナーシップはしばしば限定コレクションを生み出し、サングラスブランドとファッションハウス双方のブランド認知度向上につながります。例えば2023年10月、ディオールはフェンディとコラボレートしたサングラスを発売しました。こうしたコラボレーションにより、サングラスブランドはファッション業界の専門知識と創造性を活用し、ユニークでスタイリッシュな商品を発表することができます。
eコマースの台頭は市場に大きな影響を与え、これらの製品を世界中の人々が手に入れられるようにしました。オンライン小売のプラットフォームは、小規模なプレーヤーが既存のブランドと競争することを可能にしています。デジタルマーケティングとソーシャルメディアは、顧客にリーチし、顧客を惹きつけ、企業が商品を紹介する機会を作り、ブランドの認知度を高める上で極めて重要な役割を果たしています。
オンライン小売業者は、従来の実店舗よりも幅広いブランドやスタイルを提供し、消費者はいつでもどこでもオンラインでアイウェアを購入することができます。オンラインレビューは消費者が安心して購入するのに役立ち、オンライン小売業者は従来の実店舗よりも低価格であることが多いです。
サングラス市場レポートのハイライト
- 製品別では、非偏光サングラスが2023年の世界市場で78.3%のシェアを占めています。非偏光サングラスは、消費者の嗜好の変化やファッション動向の進化に後押しされ、いくつかの理由で人気を集めています。
- 材料別では、ポリカーボネートベースのサングラスが2023年の世界市場で45.3%のシェアを占めました。ポリカーボネートはサングラスの製造に非常に好まれる材料です。流通チャネルでは、オフラインチャネルを通じたサングラス販売が2023年に78.6%のシェアを占めました。ハイパーマーケット、スーパーマーケット、専門店を含むオフラインチャネルは、消費者に多様なブランドサングラスを提供する上で極めて重要です。小売部門の継続的な成長と強化が、サングラス販売増加の原動力となっています。
- 欧州は2023年に世界のサングラス産業の31.1%以上という大きなシェアを占めています。欧州におけるサングラスの人気は、その豊かなファッション文化に起因しており、顧客はサングラスをスタイル・ステートメントとして捉え、ファッションハウスやセレブリティが設定した動向を追うことが多いです。
目次
第1章 調査手法と範囲
第2章 エグゼクティブサマリー
第3章 サングラス市場の変数、動向、範囲
- 市場系統の見通し
- 業界のバリューチェーン分析
- 販売/小売チャネル分析
- 利益率分析
- 市場力学
- 市場促進要因分析
- 市場抑制要因分析
- 市場機会
- 市場の課題
- 業界分析- ポーターのファイブフォース分析
- 市場参入戦略
第4章 消費者行動分析
- 人口統計分析
- 消費者の動向と好み
- 購入決定に影響を与える要因
- 消費者向け製品の採用
- 主な観察と調査結果
第5章 サングラス市場:製品の推定・動向分析
- 製品の変動分析と市場シェア、2023年と2030年
- 偏光
- 非偏光
第6章 サングラス市場:材料の推定・動向分析
- 材料の変動分析と市場シェア、2023年と2030年
- CR-39
- ポリカーボネート
- ポリウレタン
- その他
第7章 サングラス市場:流通チャネルの推定・動向分析
- 流通チャネルの変動分析と市場シェア、2023年と2030年
- オフライン
- オンライン
第8章 サングラス市場:地域の推定・動向分析
- 地域の変動分析と市場シェア、2023年と2030年
- 北米
- 市場推計・予測、2018~2030年
- 米国
- カナダ
- メキシコ
- 欧州
- 市場推計・予測、2018~2030年
- 英国
- ドイツ
- フランス
- イタリア
- スペイン
- アジア太平洋地域
- 市場推計・予測、2018~2030年
- 中国
- インド
- 日本
- 韓国
- オーストラリア
- 中南米
- 市場推計・予測、2018~2030年
- ブラジル
- 中東・アフリカ
- 市場推計・予測、2018~2030年
- ブラジル
第9章 競合分析
- 主要な市場参入企業による最近の動向と影響分析
- 企業の分類
- 参入企業の概要
- 財務実績
- 製品のベンチマーク
- 企業の市場シェア分析、2023年(%)
- 企業ヒートマップ分析
- 戦略マッピング
- 主要企業のリスト:
- Luxottica Group
- Safilo Group SpA
- Kering Eyewear SpA
- De Rigo SpA
- CHARMANT Group
- Revo
- Fielmann Group
- STATE Optical Co.
- LVMH
- Marcolin SpA
List of Tables
- Table 1 EssilorLuxottica stores in different regions (including franchising and licensing)
- Table 2 Sunglasses market - Driving factor market analysis
- Table 3 Sunglasses - Restraint factor market analysis
- Table 4 Sunglasses market estimates & forecast, by product (USD Million)
- Table 5 Sunglasses market estimates & forecast, by distribution channel (USD Million)
- Table 6 U.S. macro-economic outlook
- Table 7 Canada macro-economic outlook
- Table 8 Mexico macro-economic outlook
- Table 9 UK macro-economic outlay
- Table 10 Germany macro-economic outlay
- Table 11 France macro-economic outlay
- Table 12 Spain macro-economic outlay
- Table 13 Italy macro-economic outlay
- Table 14 China macro-economic outlay
- Table 15 India macro-economic outlay
- Table 16 Japan macro-economic outlay
- Table 17 South Korea macro-economic outlay
- Table 18 Australia macro-economic outlay
- Table 19 Brazil macro-economic outlay
- Table 20 UAE macro-economic outlay
- Table 21 Recent Developments & Impact Analysis, By Key Market Participants
- Table 22 Company Market Share, 2023 (Value % Share)
- Table 23 Company Market Share in U.S., 2023 (Value % Share)
- Table 24 Company Market Share in Canada 2023 (Value % Share)
- Table 25 Company Market Share in UK, 2023 (Value % Share)
- Table 26 Company Market Share in Germany, 2023 (Value % Share)
- Table 27 Company Market Share in France, 2023 (Value % Share)
- Table 28 Company Market Share in Spain, 2023 (Value % Share)
- Table 29 Company Market Share in Italy, 2023 (Value % Share)
- Table 30 Company Market Share in China, 2023 (Value % Share)
- Table 31 Company Market Share in Japan, 2023 (Value % Share)
- Table 32 Company Market Share in India, 2023 (Value % Share)
- Table 33 Company Heat Map Analysis
- Table 34 Companies undergoing product launches
- Table 35 Companies undergoing partnerships
- Table 36 Companies undergoing mergers & acquisitions
List of Figures
- Fig. 1 Sunglasses market segmentation
- Fig. 2 Information procurement
- Fig. 3 Primary research pattern
- Fig. 4 Primary research approaches
- Fig. 5 Primary research process
- Fig. 6 Market snapshot
- Fig. 7 Segment snapshot
- Fig. 8 Competitive Landscape Snapshot
- Fig. 9 Eyewear market size, 2022 (USD Billion)
- Fig. 10 Sunglasses market: Value chain analysis
- Fig. 11 Sunglasses market: Value chain analysis
- Fig. 12 Vertical Integration Trends in the Eyewear Industry
- Fig. 13 Essilor Luxxotica brands portfolio
- Fig. 14 LVMH license expiry dates at Safilo
- Fig. 15 Strategies adopted by different Safilo brands to grow in the market
- Fig. 16 Sunglasses market: Profit-margin analysis
- Fig. 17 Sunglasses: Dynamics
- Fig. 18 Sunglasses Market: Porter's Five Forces Analysis
- Fig. 19 Share of adult population wearing sunglasses, by gender, 2023
- Fig. 20 Demographic analysis by age, in U.S., 2023
- Fig. 21 Share of adult population wearing prescription and non-prescription sunglasses in the U.S., 2021
- Fig. 22 Factors affecting buying decisions for sunglasses
- Fig. 23 Adults wearing sunglasses while performing different sports, in U.S., in 2023
- Fig. 24 Sunglasses market, by product: Key takeaways
- Fig. 25 Sunglasses market, by product: Market share, 2023 & 2030 (USD Million)
- Fig. 26 Polarized sunglasses market estimates & forecasts, 2018 - 2030 (USD Million)
- Fig. 27 Non-polarized sunglasses market estimates & forecasts, 2018 - 2030 (USD Million)
- Fig. 28 Sunglasses market, by material: Key takeaways
- Fig. 29 Sunglasses market, by material: Market share, 2023 & 2030 (USD Million)
- Fig. 30 CR-39 sunglasses market estimates & forecasts, 2018 - 2030 (USD Million)
- Fig. 31 Polycarbonate sunglasses market estimates & forecasts, 2018 - 2030 (USD Million)
- Fig. 32 Polyurethane sunglasses market estimates & forecasts, 2018 - 2030 (USD Million))
- Fig. 33 Other sunglasses market estimates & forecasts, 2018 - 2030 (USD Million)
- Fig. 34 Sunglasses market, by distribution channel: Key takeaways
- Fig. 35 Sunglasses market, by distribution channel: Market share, 2023 & 2030 (USD Million)
- Fig. 36 Sunglasses market estimates & forecasts, through offline channel, 2018 - 2030 (USD Million)
- Fig. 37 Sunglasses market estimates & forecasts, through online channel, 2018 - 2030 (USD Million)
- Fig. 38 Sunglasses market revenue, by region, 2023 & 2030 (USD Million)
- Fig. 39 Regional marketplace: Key takeaways
- Fig. 40 Regional marketplace: Key takeaways
- Fig. 41 North America sunglasses market estimates & forecast, 2018 - 2030 (USD Million)
- Fig. 42 U.S. sunglasses market estimates & forecast, 2018 - 2030 (USD Million)
- Fig. 43 Canada sunglasses market estimates & forecast, 2018 - 2030 (USD Million)
- Fig. 44 Mexico sunglasses market estimates & forecast, 2018 - 2030 (USD Million)
- Fig. 45 Europe sunglasses market estimates & forecast, 2018 - 2030 (USD Million)
- Fig. 46 UK sunglasses market estimates & forecast, 2018 - 2030 (USD Million)
- Fig. 47 Germany sunglasses market estimates & forecast, 2018 - 2030 (USD Million)
- Fig. 48 France sunglasses market estimates & forecast, 2018 - 2030 (USD Million)
- Fig. 49 Spain sunglasses market estimates & forecast, 2018 - 2030 (USD Million)
- Fig. 50 Italy sunglasses market estimates & forecast, 2018 - 2030 (USD Million)
- Fig. 51 Asia Pacific sunglasses market estimates & forecast, 2018 - 2030 (USD Million)
- Fig. 52 China sunglasses market estimates & forecast, 2018 - 2030 (USD Million)
- Fig. 53 India sunglasses market estimates & forecast, 2018 - 2030 (USD Million)
- Fig. 54 Japan sunglasses market estimates & forecast, 2018 - 2030 (USD Million)
- Fig. 55 South Korea sunglasses market estimates & forecast, 2018 - 2030 (USD Million)
- Fig. 56 Australia sunglasses market estimates & forecast, 2018 - 2030 (USD Million)
- Fig. 57 Central & South America sunglasses market estimates & forecast, 2018 - 2030 (USD Million)
- Fig. 58 Brazil sunglasses market estimates & forecast, 2018 - 2030 (USD Million)
- Fig. 59 Middle East & Africa sunglasses market estimates & forecast, 2018 - 2030 (USD Million)
- Fig. 60 UAE sunglasses market estimates & forecast, 2018 - 2030 (USD Million)
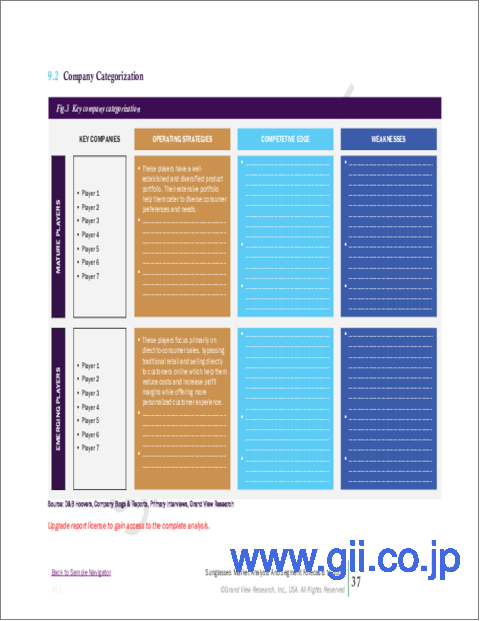
- Fig. 61 Key Company Categorization
- Fig. 62 Company Market Share Analysis, 2023
- Fig. 63 Company Market Share Analysis in U.S., 2023
- Fig. 64 Company Market Share Analysis in Canada, 2023
- Fig. 65 Company Market Share Analysis in UK, 2023
- Fig. 66 Company Market Share Analysis in Germany, 2023
- Fig. 67 Company Market Share Analysis in France., 2023
- Fig. 68 Company Market Share Analysis in Spain, 2023
- Fig. 69 Company Market Share Analysis in Italy, 2023
- Fig. 70 Company Market Share Analysis in China, 2023
- Fig. 71 Company Market Share Analysis in Japan, 2023
- Fig. 72 Company Market Share Analysis in India, 2023
- Fig. 73 Strategic framework
- Fig. 74 Brazil sunglasses market estimates & forecasts, 2018 - 2030 (USD Million)
- Fig. 75 Middle East & Africa sunglasses market estimates & forecasts, 2018 - 2030 (USD Million)
- Fig. 76 Sunglasses market: Company market share (%) analysis, 2023
Sunglasses Market Growth & Trends:
The global sunglasses market size was estimated to reach USD 36.44 billion in 2030 and is expected to grow at a CAGR of 5.6% from 2024 to 2030, according to a new report by Grand View Research, Inc. The global market has been growing consistently over years, with consumers increasingly recognizing the importance of eye protection from harmful UV rays and the style statement that sunglasses can make. This trend is expected to continue, especially as awareness about eye health rises, making it a lucrative sector to invest in.
In addition to the growing demand for sunglasses, the market is highly diverse, offering ample room for niche products and branding. Different styles, materials, and technologies cater to wide ranging consumer preferences. From high-end designer sunglasses to affordable, functional options, there is a segment for every budget. Players can focus on specific niches, such as eco-friendly materials, customizable frames, or advanced UV protection, to carve out their unique space in the market.
Furthermore, the fashion industry influence on sunglasses cannot be underestimated. Sunglasses have become an essential accessory in the fashion world, making them a staple for people of all ages. This opens the door for innovative designs, collaborations with fashion brands, and the potential to ride the waves of seasonal trends.
Sunglasses brands are partnering with fashion houses to create exclusive collections. Collaborations between sunglasses brands and fashion houses generate buzz and attract attention from consumers. These partnerships often result in sought after limited-edition collections, leading to increased brand visibility for both the sunglasses brand and the fashion house. For example, in October 2023, Dior collaborated with Fendi on a line of sunglasses. These collaborations allow sunglasses brands to tap into the fashion industry's expertise and creativity, introducing unique and stylish products.
The rise of e-commerce has had a considerable impact on the market, making these products accessible to a global audience. Online retail platforms enable smaller players to compete with established brands. Digital marketing and social media play a pivotal role in reaching and engaging customers, creating opportunities for businesses to showcase their products, and building brand awareness.
Online retailers offer a wider variety of brands and styles than traditional brick-and-mortar stores, and consumers can shop for eyewear online whenever and wherever they want. Online reviews can help consumers feel confident about their purchases, and online retailers often have lower prices than traditional brick-and-mortar stores.
Sunglasses Market Report Highlights:
- Based on product, non-polarized sunglasses held a share of 78.3% of the global market in 2023. Non-polarized sunglasses have been gaining traction for several reasons, driven by changing consumer preferences and evolving fashion trends
- Based on material, polycarbonate-based sunglassess held a share of 45.3% of the global market in 2023. Polycarbonate is a highly favored material for making sunglaIn terms of distribution channel, sunglasses sales through offline channels held 78.6% share in 2023. Offline channels, encompassing hypermarkets, supermarkets, and specialty stores, are pivotal in offering consumers a diverse range of branded sunglasses. The continued growth and enhancement of the retail sector have become a driving force behind the increased sunglasses sales
- Europe held a sizable share of over 31.1% of the global sunglasses industry in 2023. The popularity of sunglasses in Europe can be attributed to its rich fashion culture, where customers often view sunglasses as a style statement and follow trends set by fashion houses and celebrities
Table of Contents
Chapter 1. Methodology and Scope
- 1.1. Market Segmentation & Scope
- 1.2. Market Definition
- 1.3. Information Procurement
- 1.3.1. Purchased Database
- 1.3.2. GVR's Internal Database
- 1.3.3. Secondary Products & Third-Party Perspectives
- 1.3.4. Primary Research
- 1.4. Information Analysis
- 1.4.1. Data Analysis Models
- 1.5. Market Formulation & Data Visualization
- 1.6. Data Validation & Publishing
Chapter 2. Executive Summary
- 2.1. Market Outlook
- 2.2. Product Outlook
- 2.3. Material Outlook
- 2.4. Distribution Channel Outlook
- 2.5. Regional Outlook
Chapter 3. Sunglasses Market Variables, Trends & Scope
- 3.1. Market Lineage Outlook
- 3.2. Industry Value Chain Analysis
- 3.2.1. Sales/Retail Channel Analysis
- 3.2.2. Profit Margin Analysis
- 3.3. Market Dynamics
- 3.3.1. Market Driver Analysis
- 3.3.2. Market Restraint Analysis
- 3.3.3. Market Opportunities
- 3.3.4. Market Challenges
- 3.4. Industry Analysis - Porter's Five Forces Analysis
- 3.5. Market Entry Strategies
Chapter 4. Consumer Behavior Analysis
- 4.1. Demographic Analysis
- 4.2. Consumer Trends and Preferences
- 4.3. Factors Affecting Buying Decision
- 4.4. Consumer Product Adoption
- 4.5. Key Observations & Findings
Chapter 5. Sunglasses Market: Product Estimates & Trend Analysis
- 5.1. Product Movement Analysis & Market Share, 2023 & 2030
- 5.2. Polarized
- 5.2.1. Market Estimates And Forecast, 2018 - 2030 (USD Million)
- 5.3. Non-polarized
- 5.3.1. Market Estimates And Forecast, 2018 - 2030 (USD Million)
Chapter 6. Sunglasses Market: Material Estimates & Trend Analysis
- 6.1. Material Movement Analysis & Market Share, 2023 & 2030
- 6.2. CR-39
- 6.2.1. Market Estimates And Forecast, 2018 - 2030 (USD Million)
- 6.3. Polycarbonate
- 6.3.1. Market Estimates And Forecast, 2018 - 2030 (USD Million)
- 6.4. Polyurethane
- 6.4.1. Market Estimates And Forecast, 2018 - 2030 (USD Million)
- 6.5. Others
- 6.5.1. Market Estimates And Forecast, 2018 - 2030 (USD Million)
Chapter 7. Sunglasses Market: Distribution Channel Range Estimates & Trend Analysis
- 7.1. Distribution Channel Movement Analysis & Market Share, 2023 & 2030
- 7.2. Offline
- 7.2.1. Market Estimates And Forecast, 2018 - 2030 (USD Million)
- 7.3. Online
- 7.3.1. Market Estimates And Forecast, 2018 - 2030 (USD Million)
Chapter 8. Sunglasses Market: Regional Estimates & Trend Analysis
- 8.1. Regional Movement Analysis & Market Share, 2023 & 2030
- 8.2. North America
- 8.2.1. Market Estimates And Forecast, 2018 - 2030 (USD Million)
- 8.2.2. Market Estimates And Forecast, by product, 2018 - 2030 (USD Million)
- 8.2.3. Market Estimates And Forecast, by material, 2018 - 2030 (USD Million)
- 8.2.4. Market Estimates And Forecast, by distribution channel, 2018 - 2030 (USD Million)
- 8.2.5. U.S.
- 8.2.5.1. Market Estimates And Forecast, 2018 - 2030 (USD Million)
- 8.2.5.2. Market Estimates And Forecast, by product, 2018 - 2030 (USD Million)
- 8.2.5.3. Market Estimates And Forecast, by material, 2018 - 2030 (USD Million)
- 8.2.5.4. Market Estimates And Forecast, by distribution channel, 2018 - 2030 (USD Million)
- 8.2.6. Canada
- 8.2.6.1. Market Estimates And Forecast, 2018 - 2030 (USD Million)
- 8.2.6.2. Market Estimates and Forecast, by product, 2018 - 2030 (USD Million)
- 8.2.6.3. Market Estimates And Forecast, by material, 2018 - 2030 (USD Million)
- 8.2.6.4. Market Estimates and Forecast, by distribution channel, 2018 - 2030 (USD Million)
- 8.2.7. Mexico
- 8.2.7.1. Market Estimates and Forecast, 2018 - 2030 (USD Million)
- 8.2.7.2. Market Estimates and Forecast, by product, 2018 - 2030 (USD Million)
- 8.2.7.3. Market Estimates and Forecast, by material, 2018 - 2030 (USD Million)
- 8.2.7.4. Market Estimates and Forecast, by distribution channel, 2018 - 2030 (USD Million)
- 8.3. Europe
- 8.3.1. Market Estimates and Forecast, 2018 - 2030 (USD Million)
- 8.3.2. Market Estimates and Forecast, by product, 2018 - 2030 (USD Million)
- 8.3.3. Market Estimates and Forecast, by material, 2018 - 2030 (USD Million)
- 8.3.4. Market Estimates and Forecast, by distribution channel, 2018 - 2030 (USD Million)
- 8.3.5. UK
- 8.3.5.1. Market Estimates and Forecast, 2018 - 2030 (USD Million)
- 8.3.5.2. Market Estimates and Forecast, by product, 2018 - 2030 (USD Million)
- 8.3.5.3. Market Estimates and Forecast, by material, 2018 - 2030 (USD Million)
- 8.3.5.4. Market Estimates and Forecast, by distribution channel, 2018 - 2030 (USD Million)
- 8.3.6. Germany
- 8.3.6.1. Market Estimates and Forecast, 2018 - 2030 (USD Million)
- 8.3.6.2. Market Estimates and Forecast, by product, 2018 - 2030 (USD Million)
- 8.3.6.3. Market Estimates and Forecast, by material, 2018 - 2030 (USD Million)
- 8.3.6.4. Market Estimates and Forecast, by distribution channel, 2018 - 2030 (USD Million)
- 8.3.7. France
- 8.3.7.1. Market Estimates and Forecast, 2018 - 2030 (USD Million)
- 8.3.7.2. Market Estimates and Forecast, by product, 2018 - 2030 (USD Million)
- 8.3.7.3. Market Estimates and Forecast, by material, 2018 - 2030 (USD Million)
- 8.3.7.4. Market Estimates and Forecast, by distribution channel, 2018 - 2030 (USD Million)
- 8.3.8. Italy
- 8.3.8.1. Market Estimates and Forecast, 2018 - 2030 (USD Million)
- 8.3.8.2. Market Estimates and Forecast, by product, 2018 - 2030 (USD Million)
- 8.3.8.3. Market Estimates and Forecast, by material, 2018 - 2030 (USD Million)
- 8.3.8.4. Market Estimates and Forecast, by distribution channel, 2018 - 2030 (USD Million)
- 8.3.9. Spain
- 8.3.9.1. Market Estimates and Forecast, 2018 - 2030 (USD Million)
- 8.3.9.2. Market Estimates and Forecast, by product, 2018 - 2030 (USD Million)
- 8.3.9.3. Market Estimates and Forecast, by material, 2018 - 2030 (USD Million)
- 8.3.9.4. Market Estimates and Forecast, by distribution channel, 2018 - 2030 (USD Million)
- 8.4. Asia Pacific
- 8.4.1. Market Estimates and Forecast, 2018 - 2030 (USD Million)
- 8.4.2. Market Estimates and Forecast, by product, 2018 - 2030 (USD Million)
- 8.4.3. Market Estimates and Forecast, by material, 2018 - 2030 (USD Million)
- 8.4.4. Market Estimates and Forecast, by distribution channel, 2018 - 2030 (USD Million)
- 8.4.5. China
- 8.4.5.1. Market Estimates and Forecast, 2018 - 2030 (USD Million)
- 8.4.5.2. Market Estimates and Forecast, by product, 2018 - 2030 (USD Million)
- 8.4.5.3. Market Estimates and Forecast, by material, 2018 - 2030 (USD Million)
- 8.4.5.4. Market Estimates and Forecast, by distribution channel, 2018 - 2030 (USD Million)
- 8.4.6. India
- 8.4.6.1. Market Estimates and Forecast, 2018 - 2030 (USD Million)
- 8.4.6.2. Market Estimates and Forecast, by product, 2018 - 2030 (USD Million)
- 8.4.6.3. Market Estimates and Forecast, by material, 2018 - 2030 (USD Million)
- 8.4.6.4. Market Estimates and Forecast, by distribution channel, 2018 - 2030 (USD Million)
- 8.4.7. Japan
- 8.4.7.1. Market Estimates and Forecast, 2018 - 2030 (USD Million)
- 8.4.7.2. Market Estimates and Forecast, by product, 2018 - 2030 (USD Million)
- 8.4.7.3. Market Estimates and Forecast, by material, 2018 - 2030 (USD Million)
- 8.4.7.4. Market Estimates and Forecast, by distribution channel, 2018 - 2030 (USD Million)
- 8.4.8. South Korea
- 8.4.8.1. Market Estimates and Forecast, 2018 - 2030 (USD Million)
- 8.4.8.2. Market Estimates and Forecast, by product, 2018 - 2030 (USD Million)
- 8.4.8.3. Market Estimates and Forecast, by material, 2018 - 2030 (USD Million)
- 8.4.8.4. Market Estimates and Forecast, by distribution channel, 2018 - 2030 (USD Million)
- 8.4.9. Australia
- 8.4.9.1. Market Estimates and Forecast, 2018 - 2030 (USD Million)
- 8.4.9.2. Market Estimates and Forecast, by product, 2018 - 2030 (USD Million)
- 8.4.9.3. Market Estimates and Forecast, by material, 2018 - 2030 (USD Million)
- 8.4.9.4. Market Estimates and Forecast, by distribution channel, 2018 - 2030 (USD Million)
- 8.5. Central & South America
- 8.5.1. Market Estimates and Forecast, 2018 - 2030 (USD Million)
- 8.5.2. Market Estimates and Forecast, by product, 2018 - 2030 (USD Million)
- 8.5.3. Market Estimates and Forecast, by material, 2018 - 2030 (USD Million)
- 8.5.4. Market Estimates and Forecast, by distribution channel, 2018 - 2030 (USD Million)
- 8.5.5. Brazil
- 8.5.5.1. Market Estimates and Forecast, 2018 - 2030 (USD Million)
- 8.5.5.2. Market Estimates and Forecast, by product, 2018 - 2030 (USD Million)
- 8.5.5.3. Market Estimates and Forecast, by material, 2018 - 2030 (USD Million)
- 8.5.5.4. Market Estimates and Forecast, by distribution channel, 2018 - 2030 (USD Million)
- 8.6. Middle East & Africa
- 8.6.1. Market Estimates and Forecast, 2018 - 2030 (USD Million)
- 8.6.2. Market Estimates and Forecast, by product, 2018 - 2030 (USD Million)
- 8.6.3. Market Estimates and Forecast, by material, 2018 - 2030 (USD Million)
- 8.6.4. Market Estimates and Forecast, by distribution channel, 2018 - 2030 (USD Million)
- 8.6.5. Brazil
- 8.6.5.1. Market Estimates and Forecast, 2018 - 2030 (USD Million)
- 8.6.5.2. Market Estimates and Forecast, by product, 2018 - 2030 (USD Million)
- 8.6.5.3. Market Estimates and Forecast, by material, 2018 - 2030 (USD Million)
- 8.6.5.4. Market Estimates and Forecast, by distribution channel, 2018 - 2030 (USD Million)
Chapter 9. Competitive Analysis
- 9.1. Recent developments & impact analysis, by key market participants
- 9.2. Company Categorization
- 9.3. Participant's Overview
- 9.4. Financial Performance
- 9.5. Product Benchmarking
- 9.6. Company Market Share Analysis, 2023 (%)
- 9.7. Company Heat Map Analysis
- 9.8. Strategy Mapping
- 9.9. List of key companies analyzed in this section includes:
- 9.9.1. Luxottica Group
- 9.9.2. Safilo Group S.p.A.
- 9.9.3. Kering Eyewear S.p.A.
- 9.9.4. De Rigo S.p.A.
- 9.9.5. CHARMANT Group
- 9.9.6. Revo
- 9.9.7. Fielmann Group
- 9.9.8. STATE Optical Co.
- 9.9.9. LVMH
- 9.9.10. Marcolin S.p.A.