|
|
市場調査レポート
商品コード
1553421
プロセス分析技術の市場規模、シェア、動向分析レポート:製品別、手法別、モニタリング手法別、用途別、最終用途別、地域別、セグメント予測、2024年~2030年Process Analytical Technology Market Size, Share & Trends Analysis Report By Product, By Technique, By Monitoring Method, By Application, By End Use, By Region, And Segment Forecasts, 2024 - 2030 |
||||||
|
|||||||
カスタマイズ可能
|
|||||||

| プロセス分析技術の市場規模、シェア、動向分析レポート:製品別、手法別、モニタリング手法別、用途別、最終用途別、地域別、セグメント予測、2024年~2030年 |
|
出版日: 2024年08月12日
発行: Grand View Research
ページ情報: 英文 100 Pages
納期: 2~10営業日
|

全表示
- 概要
- 目次
プロセス分析技術市場の成長と動向
Grand View Research, Inc.の最新レポートによると、プロセス分析技術の世界市場規模は、2024~2030年にかけてCAGR 5.5%を記録し、2030年には109億1,000万米ドルに達する見込みです。
製薬企業による研究開発費の増加、新興国市場への政府投資、設計による信頼性(QbD)原則の遵守の高まり、品質と製造プロセス効率の向上への重点の高まり、分析技術産業における技術開発が市場の主要促進要因となっています。
プロセス分析技術は、意思決定、品質保証、製品開発、工場導入に役立つデータを提供するため、医薬品の製造に不可欠です。このような技術は、医薬品の製造手順における汚染や異物混入などの可能性のある問題を発見するのにも役立ちます。世界のプロセス分析技術に関する報告書によると、プロセス分析技術は、0.1ppmという低いレベルで汚染を検出することができます。これは、かなりの時間と経済的節約をもたらし、バイオプロセスにおける分析技術の採用をさらに後押しする可能性があります。
COVID-19パンデミックは、いくつかのプロセス分析技術の提供にとって大きな成長の原動力となっています。感染率と死亡率の上昇に対応して、効率的な予防薬と治療の探索が激化しています。プロセス分析技術は、医薬品開発プロセスのモニタリングと評価に大きく利用されているため、2020年には需要が大幅に増加しました。例えば2022年8月、InsideTeleに掲載された記事によると、合成ワークステーションの近代化、正確な反応器制御の提供、反応プロセス情報の取得とデジタル化の実現、ユーザー、実験、サイト間のリンクと再現性の確保はすべて、医薬品製剤におけるプロセス分析技術の使用によって可能になります。
製造コストの低減、設備投資の削減、望ましい品質、時間の節約、製薬会社のリソースをマーケティングなど他のセグメントに振り向けられる柔軟性など、この技術が提供する数多くの利点により、純粋なCMOに医薬品の製造を委託する動向が近年著しく高まっています。例えば、2021年7月、Arvinas Inc.とPfizer Inc.は、実験的な経口PROTAC(プロテオライシス・ターゲティング・キメラ)エストロゲン受容体タンパク質分解薬であるARV-471の製造・販売に関する世界的パートナーシップを確立しました。これがプロセス分析技術市場を牽引しています。
主要な業界参入企業が新しく優れたプロセス分析技術を採用することで、世界市場の拡大が加速すると予想されます。例えば、2021年11月、Thermo Fisher Scientificは、Human Proteome Organization(HUPO)Reconnectイベントの中でMS&クロマトグラフィー装置を発表しました。プロテオミクス研究のために、高分解能のThermo Scientific Orbitrap MS装置はThermo Scientific Vanquish Neo UHPLCシステムによって補完され、サンプルのロスを減らし、可能な限り最高の品質のデータを生成します。高感度LC-MS向けで、1 nL/minから100 L/min、1,500 barまでの流速で強力な分析効率を発揮します。
プロセス分析技術市場レポートハイライト
- 製品別では、分析装置セグメントが2023年に最大シェアを占めました。これは、水や廃水の治療需要の高まりと、医薬品の安全性におけるプロセス分析装置の使用増加によるものと予測されます。
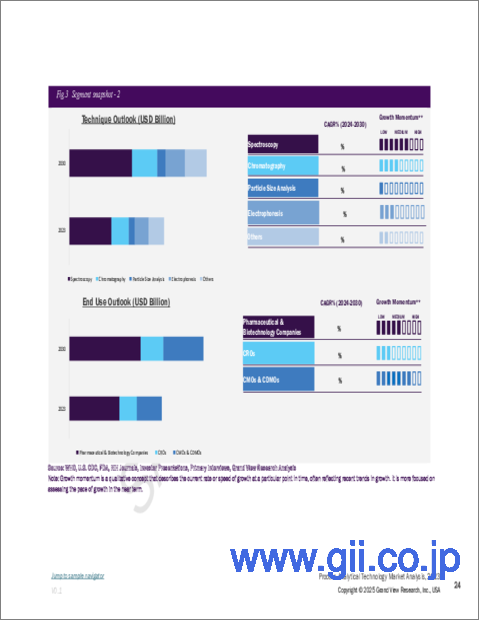
- 技術別では、分光法セグメントが2023年にトップシェアを獲得しました。分光法セグメントの拡大を後押しする主要要因の1つは、製薬とバイオ医薬品の研究開発活動の増加と、プロセスの最適化につながる技術開発です。
- モニタリング手法別では、インラインセグメントが2023年に最大シェアを占めました。このセグメントは、インライン分析による低いターンアラウンドタイムと結果の一貫性が牽引しています。
- 最終用途別では、製薬・バイオテクノロジー企業が2023年に最大シェアを占めました。これは、既存国と新興国の両方でバイオテクノロジー部門が拡大していること、多数の生物製剤の承認と採用よって生化学分析のニーズが高まっていることに起因しています。
- 2023年の市場は北米が支配的でした。同地域市場は、製薬・バイオ医薬品企業による研究開発費の増加、品質と生産への注目の高まり、効率性の向上、同地域で事業展開する企業によるQbD原則の遵守能力の高まり、技術的に高度な医療研究フレームワークの利用可能性などが牽引しています。
- アジア太平洋は、予測期間中最も高い成長率で拡大すると予想されます。これは、バイオテクノロジーセグメントへの政府投資の拡大、研究開発受託企業の増加、発展途上地域への世界企業の集中が進んでいることに起因しています。
目次
第1章 調査手法と範囲
第2章 エグゼクティブサマリー
第3章 プロセス分析技術市場の変数、動向、範囲
- 市場イントロダクション/系統展望
- 市場規模と成長展望
- 市場力学
- 市場促進要因分析
- 市場抑制要因分析
- プロセス分析技術市場分析ツール
- ポーターの分析
- PESTEL分析
第4章 プロセス分析技術市場:製品別、推定・動向分析
- セグメントダッシュボード
- プロセス分析技術市場:製品変動分析、100万米ドル、2023年と2030年
- アナライザーとモニター
- センサーとプローブ
- サンプラー
- ソフトウェアとサービス
第5章 プロセス分析技術市場:手法別、推定・動向分析
- セグメントダッシュボード
- プロセス分析技術市場:手法変動分析、100万米ドル、2023年と2030年
- 分光法
- クロマトグラフィー
- 粒子サイズ分析
- 電気泳動
- その他
第6章 プロセス分析技術市場:モニタリング手法別、推定・動向分析
- セグメントダッシュボード
- プロセス分析技術市場:モニタリング手法変動分析、100万米ドル、2023年と2030年
- オンライン
- インライン
- アットライン
- オフライン
第7章 プロセス分析技術市場:用途別、推定・動向分析
- セグメントダッシュボード
- プロセス分析技術市場:用途変動分析、100万米ドル、2023年と2030年
- 小分子
- 巨大分子
- 製造用途
- その他
第8章 プロセス分析技術市場:最終用途別、推定・動向分析
- セグメントダッシュボード
- プロセス分析技術市場:最終用途変動分析、100万米ドル、2023年と2030年
- 製薬・バイオテクノロジー企業
- CRO
- CMOとCDMO
第9章 プロセス分析技術市場:地域別、推定・動向分析
- プロセス分析技術市場シェア、地域別、2023年と2030年、100万米ドル
- 北米
- 米国
- カナダ
- メキシコ
- 欧州
- 英国
- ドイツ
- フランス
- イタリア
- スペイン
- デンマーク
- スウェーデン
- ノルウェー
- アジア太平洋
- 中国
- 日本
- インド
- 韓国
- オーストラリア
- タイ
- ラテンアメリカ
- ブラジル
- アルゼンチン
- 中東・アフリカ
- 南アフリカ
- サウジアラビア
- アラブ首長国連邦
- クウェート
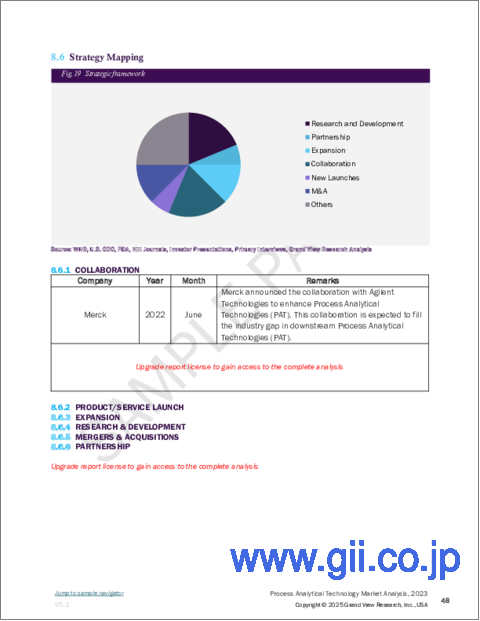
第10章 競合情勢
- 主要市場参入企業による最近の動向と影響分析
- 企業分類
- 企業ヒートマップ分析
- 企業プロファイル
- Thermo Fisher Scientific Inc.
- Agilent Technologies, Inc.
- Danaher Corporation(Ab Sciex LLC)
- Bruker Corporation
- PerkinElmer, Inc.
- ABB Ltd.
- Carl Zeiss AG(Zeiss Group)
- Emerson Electric Co.
- Mettler-Toledo
- Shimadzu Corporation
- Sartorius AG
- Hamilton Company
- Repligen Corporation
Process Analytical Technology Market Growth & Trends:
The global process analytical technology market size is expected to reach USD 10.91 billion by 2030, registering a CAGR of 5.5% from 2024 to 2030, according to a new report by Grand View Research, Inc. The rising R&D spending by pharmaceutical companies, government investment in emerging markets, growing adherence to reliability by design (QbD) principles, increasing emphasis on improving quality and manufacturing process efficiency, and technological developments in the analytical technology industry are the main drivers in the market.
Process analytical technology is crucial to the manufacturing of pharmaceuticals as it provides data that aids in decision-making, quality assurance, product development, and factory implementation. Such technology also aids in spotting possible issues, such as contamination or foreign materials, in drug production procedures. Process analytical technology can detect contamination at levels as low as 0.1 parts per million, according to a report on the global process analytical technology. This could result in considerable time and financial savings and further boost the adoption of analytical technology in bioprocessing.
The COVID-19 pandemic has been a significant growth driver for several process analytical technology offerings. The search for efficient preventive and curative medications is intensifying in response to rising infection and mortality rates. Due to the fact that process analytical technology is largely used to monitor and assess the drug development process, demand for it significantly increased in 2020. For instance, in August 2022, as per the article published on InsideTele, modernizing synthesis workstations, offering precise reactor control, enabling the capture and digitalization of response process information, and securing the reproducibility as well as the link among users, experiments, and sites are all possible with the use of process analytical technology in drug formulation.
Due to the numerous benefits the technology provides, including lower production costs, lower capital expenditures, the desired quality, time savings, and the flexibility to allow pharmaceutical companies to direct their resources to other areas, such as marketing, the trend of outsourcing the production of pharma products to pure CMOs has risen significantly in recent years. For instance, in July 2021, Arvinas Inc. and Pfizer Inc. established a worldwide partnership to manufacture and market ARV-471, an experimental oral PROTAC (proteolysis-targeting-chimera) estrogen receptor protein degrader. This is, in turn, driving the market for process analytical technology.
It is anticipated that the adoption of new and better process analytical technology by key industry players will accelerate the expansion of the global market. For instance, in November 2021, Thermo Fisher Scientific launched MS & chromatography equipment during the Human Proteome Organization (HUPO) Reconnect event. For proteomics investigations, the high-resolution Thermo Scientific Orbitrap MS equipment is complemented by the Thermo Scientific Vanquish Neo UHPLC system, which reduces the loss of sample and produces data of the best possible quality. It is intended for high-sensitive LC-MS applications and has strong analytical efficiency at a rate of flow that ranges from 1 nL/min to 100 L/min up to 1,500 bar.
Process Analytical Technology Market Report Highlights:
- By product, the analyzers segment held the largest share in 2023. This is anticipated to be driven by the rising demand for the treatment of water and wastewater and increased use of process analyzers in medication safety
- By technique, the spectroscopy segment captured a leading share in 2023. One of the main factors propelling the expansion of the spectroscopy segment is the rise in pharmaceutical and biopharmaceutical R&D activities and technological developments that lead to process optimization
- By monitoring method, the in-line segment accounted for the largest share in 2023. The segment is being driven by the low turnaround times and consistency of results from the in-line analysis
- By end-use, the pharmaceutical and biotechnology companies segment held the largest share in 2023. This can be attributed to the expanding biotechnology sector in both established and emerging nations and the rising need for biochemical analysis brought on by the approval and introduction of numerous biologic medications
- North America dominated the market in 2023. The regional market is driven by an increase in R&D spending by pharmaceutical and biopharmaceutical organizations, increasing focus on quality and production, improved efficiency, growing ability to adhere to QbD principles by businesses operating in the region, and the availability of technologically advanced healthcare research framework
- Asia Pacific is expected to expand at the highest rate over the projected period. This can be attributed to expanding government investment in the biotechnology sector, a rise in the number of contract research and manufacturing companies, and a growing concentration of global players in developing regions
Table of Contents
Chapter 1. Methodology and Scope
- 1.1. Market Segmentation and Scope
- 1.2. Market Definitions
- 1.3. Research Methodology
- 1.3.1. Information Procurement
- 1.3.2. Information or Data Analysis
- 1.3.3. Market Formulation & Data Visualization
- 1.3.4. Data Validation & Publishing
- 1.4. Research Scope and Assumptions
- 1.4.1. List of Data Sources
Chapter 2. Executive Summary
- 2.1. Market Outlook
- 2.2. Segment Outlook
- 2.3. Competitive Insights
Chapter 3. Process Analytical Technology Market Variables, Trends, & Scope
- 3.1. Market Introduction/Lineage Outlook
- 3.2. Market Size and Growth Prospects (USD Million)
- 3.3. Market Dynamics
- 3.3.1. Market Drivers Analysis
- 3.3.2. Market Restraints Analysis
- 3.4. Process Analytical Technology Market Analysis Tools
- 3.4.1. Porter's Analysis
- 3.4.1.1. Bargaining power of the suppliers
- 3.4.1.2. Bargaining power of the buyers
- 3.4.1.3. Threats of substitution
- 3.4.1.4. Threats from new entrants
- 3.4.1.5. Competitive rivalry
- 3.4.2. PESTEL Analysis
- 3.4.2.1. Political landscape
- 3.4.2.2. Economic and Social landscape
- 3.4.2.3. Technological landscape
- 3.4.2.4. Environmental landscape
- 3.4.2.5. Legal landscape
- 3.4.1. Porter's Analysis
Chapter 4. Process Analytical Technology Market: Product Estimates & Trend Analysis
- 4.1. Segment Dashboard
- 4.2. Process Analytical Technology Market: Product Movement Analysis, USD Million, 2023 & 2030
- 4.3. Analyzers & Monitors
- 4.3.1. Analyzers & Monitors Market Revenue Estimates and Forecasts, 2018 - 2030 (USD Million)
- 4.4. Sensors & Probes
- 4.4.1. Sensors & Probes Market Revenue Estimates and Forecasts, 2018 - 2030 (USD Million)
- 4.5. Samplers
- 4.5.1. Samplers Market Revenue Estimates and Forecasts, 2018 - 2030 (USD Million)
- 4.6. Software & Services
- 4.6.1. Software & Services Market Revenue Estimates and Forecasts, 2018 - 2030 (USD Million)
Chapter 5. Process Analytical Technology Market: Technique Estimates & Trend Analysis
- 5.1. Segment Dashboard
- 5.2. Process Analytical Technology Market: Technique Movement Analysis, USD Million, 2023 & 2030
- 5.3. Spectroscopy
- 5.3.1. Spectroscopy Market Revenue Estimates and Forecasts, 2018 - 2030 (USD Million)
- 5.3.1.1. NIR Spectroscopy
- 5.3.1.1.1. NIR Spectroscopy Process Analytical Technology Market Estimates and Forecasts, 2018 - 2030 (USD Million)
- 5.3.1.2. Raman Spectroscopy
- 5.3.1.2.1. Raman Spectroscopy Process Analytical Technology Market Estimates and Forecasts, 2018 - 2030 (USD Million)
- 5.3.1.3. NMR Spectroscopy
- 5.3.1.3.1. NMR Spectroscopy Process Analytical Technology Market Estimates and Forecasts, 2018 - 2030 (USD Million)
- 5.3.1.4. Mass Spectroscopy
- 5.3.1.4.1. Mass Spectroscopy Process Analytical Technology Market Estimates and Forecasts, 2018 - 2030 (USD Million)
- 5.3.1.5. Others
- 5.3.1.5.1. Others Process Analytical Technology Market Estimates and Forecasts, 2018 - 2030 (USD Million)
- 5.3.1.1. NIR Spectroscopy
- 5.3.1. Spectroscopy Market Revenue Estimates and Forecasts, 2018 - 2030 (USD Million)
- 5.4. Chromatography
- 5.4.1. Chromatography Market Revenue Estimates and Forecasts, 2018 - 2030 (USD Million)
- 5.4.1.1. High Performance Liquid Chromatography
- 5.4.1.1.1. High Performance Liquid Chromatography Process Analytical Technology Market Estimates and Forecasts, 2018 - 2030 (USD Million)
- 5.4.1.2. Gas Chromatography
- 5.4.1.2.1. Gas Chromatography Process Analytical Technology Market Estimates and Forecasts, 2018 - 2030 (USD Million)
- 5.4.1.3. Others
- 5.4.1.3.1. Others Process Analytical Technology Market Estimates and Forecasts, 2018 - 2030 (USD Million)
- 5.4.1.1. High Performance Liquid Chromatography
- 5.4.1. Chromatography Market Revenue Estimates and Forecasts, 2018 - 2030 (USD Million)
- 5.5. Particle Size Analysis
- 5.5.1. Particle Size Analysis Market Revenue Estimates and Forecasts, 2018 - 2030 (USD Million)
- 5.6. Electrophoresis
- 5.6.1. Electrophoresis Market Revenue Estimates and Forecasts, 2018 - 2030 (USD Million)
- 5.7. Others
- 5.7.1. Others Market Revenue Estimates and Forecasts, 2018 - 2030 (USD Million)
Chapter 6. Process Analytical Technology Market: Monitoring Method Estimates & Trend Analysis
- 6.1. Segment Dashboard
- 6.2. Process Analytical Technology Market: Monitoring Method Movement Analysis, USD Million, 2023 & 2030
- 6.3. On-line
- 6.3.1. On-line Market Revenue Estimates and Forecasts, 2018 - 2030 (USD Million)
- 6.4. In-line
- 6.4.1. In-line Market Revenue Estimates and Forecasts, 2018 - 2030 (USD Million)
- 6.5. At-line
- 6.5.1. At-line Market Revenue Estimates and Forecasts, 2018 - 2030 (USD Million)
- 6.6. Off-line
- 6.6.1. Off-line Market Revenue Estimates and Forecasts, 2018 - 2030 (USD Million)
Chapter 7. Process Analytical Technology Market: Application Estimates & Trend Analysis
- 7.1. Segment Dashboard
- 7.2. Process Analytical Technology Market: Application Movement Analysis, USD Million, 2023 & 2030
- 7.3. Small Molecules
- 7.3.1. Small Molecules Market Revenue Estimates and Forecasts, 2018 - 2030 (USD Million)
- 7.4. Large Molecules
- 7.4.1. Large Molecules Market Revenue Estimates and Forecasts, 2018 - 2030 (USD Million)
- 7.5. Manufacturing Applications
- 7.5.1. Manufacturing Applications Market Revenue Estimates and Forecasts, 2018 - 2030 (USD Million)
- 7.6. Other Applications
- 7.6.1. Other Applications Market Revenue Estimates and Forecasts, 2018 - 2030 (USD Million)
Chapter 8. Process Analytical Technology Market: End Use Estimates & Trend Analysis
- 8.1. Segment Dashboard
- 8.2. Process Analytical Technology Market: End Use Movement Analysis, USD Million, 2023 & 2030
- 8.3. Pharmaceutical & Biotechnology Companies
- 8.3.1. Pharmaceutical & Biotechnology Companies Market Revenue Estimates and Forecasts, 2018 - 2030 (USD Million)
- 8.4. CROs
- 8.4.1. CROs Market Revenue Estimates and Forecasts, 2018 - 2030 (USD Million)
- 8.5. CMOs & CDMOs
- 8.5.1. CMOs & CDMOs Market Revenue Estimates and Forecasts, 2018 - 2030 (USD Million)
Chapter 9. Process Analytical Technology Market: Regional Estimates & Trend Analysis
- 9.1. Process Analytical Technology Market Share, By Region, 2023 & 2030, USD Million
- 9.2. North America
- 9.2.1. North America Process Analytical Technology Market Estimates and Forecasts, 2018 - 2030 (USD Million)
- 9.2.2. U.S.
- 9.2.2.1. U.S. Process Analytical Technology Market Estimates and Forecasts, 2018 - 2030 (USD Million)
- 9.2.3. Canada
- 9.2.3.1. Canada Process Analytical Technology Market Estimates and Forecasts, 2018 - 2030 (USD Million)
- 9.2.4. Mexico
- 9.2.4.1. Mexico Process Analytical Technology Market Estimates and Forecasts, 2018 - 2030 (USD Million)
- 9.3. Europe
- 9.3.1. Europe Process Analytical Technology Market Estimates and Forecasts, 2018 - 2030 (USD Million)
- 9.3.2. UK
- 9.3.2.1. UK Process Analytical Technology Market Estimates and Forecasts, 2018 - 2030 (USD Million)
- 9.3.3. Germany
- 9.3.3.1. Germany Process Analytical Technology Market Estimates and Forecasts, 2018 - 2030 (USD Million)
- 9.3.4. France
- 9.3.4.1. France Process Analytical Technology Market Estimates and Forecasts, 2018 - 2030 (USD Million)
- 9.3.5. Italy
- 9.3.5.1. Italy Process Analytical Technology Market Estimates and Forecasts, 2018 - 2030 (USD Million)
- 9.3.6. Spain
- 9.3.6.1. Spain Process Analytical Technology Market Estimates and Forecasts, 2018 - 2030 (USD Million)
- 9.3.7. Denmark
- 9.3.7.1. Denmark Process Analytical Technology Market Estimates and Forecasts, 2018 - 2030 (USD Million)
- 9.3.8. Sweden
- 9.3.8.1. Sweden Process Analytical Technology Market Estimates and Forecasts, 2018 - 2030 (USD Million)
- 9.3.9. Norway
- 9.3.9.1. Norway Process Analytical Technology Market Estimates and Forecasts, 2018 - 2030 (USD Million)
- 9.4. Asia Pacific
- 9.4.1. Asia Pacific Process Analytical Technology Market Estimates and Forecasts, 2018 - 2030 (USD Million)
- 9.4.2. China
- 9.4.2.1. China Process Analytical Technology Market Estimates and Forecasts, 2018 - 2030 (USD Million)
- 9.4.3. Japan
- 9.4.3.1. Japan Process Analytical Technology Market Estimates and Forecasts, 2018 - 2030 (USD Million)
- 9.4.4. India
- 9.4.4.1. India Process Analytical Technology Market Estimates and Forecasts, 2018 - 2030 (USD Million)
- 9.4.5. South Korea
- 9.4.5.1. South Korea Process Analytical Technology Market Estimates and Forecasts, 2018 - 2030 (USD Million)
- 9.4.6. Australia
- 9.4.6.1. Australia Process Analytical Technology Market Estimates and Forecasts, 2018 - 2030 (USD Million)
- 9.4.7. Thailand
- 9.4.7.1. Thailand Process Analytical Technology Market Estimates and Forecasts, 2018 - 2030 (USD Million)
- 9.5. Latin America
- 9.5.1. Latin America Process Analytical Technology Market Estimates and Forecasts, 2018 - 2030 (USD Million)
- 9.5.2. Brazil
- 9.5.2.1. Brazil Process Analytical Technology Market Estimates and Forecasts, 2018 - 2030 (USD Million)
- 9.5.3. Argentina
- 9.5.3.1. Argentina Process Analytical Technology Market Estimates and Forecasts, 2018 - 2030 (USD Million)
- 9.6. Middle East and Africa
- 9.6.1. Middle East and Africa Process Analytical Technology Market Estimates and Forecasts, 2018 - 2030 (USD Million)
- 9.6.2. South Africa
- 9.6.2.1. South Africa Process Analytical Technology Market Estimates and Forecasts, 2018 - 2030 (USD Million)
- 9.6.3. Saudi Arabia
- 9.6.3.1. Saudi Arabia Process Analytical Technology Market Estimates and Forecasts, 2018 - 2030 (USD Million)
- 9.6.4. UAE
- 9.6.4.1. UAE Process Analytical Technology Market Estimates and Forecasts, 2018 - 2030 (USD Million)
- 9.6.5. Kuwait
- 9.6.5.1. Kuwait Process Analytical Technology Market Estimates and Forecasts, 2018 - 2030 (USD Million)
Chapter 10. Competitive Landscape
- 10.1. Recent Developments & Impact Analysis by Key Market Participants
- 10.2. Company Categorization
- 10.3. Company Heat Map Analysis
- 10.4. Company Profiles
- 10.4.1. Thermo Fisher Scientific Inc.
- 10.4.1.1. Participant's Overview
- 10.4.1.2. Financial Performance
- 10.4.1.3. Product Benchmarking
- 10.4.1.4. Recent Developments/ Strategic Initiatives
- 10.4.2. Agilent Technologies, Inc.
- 10.4.2.1. Participant's Overview
- 10.4.2.2. Financial Performance
- 10.4.2.3. Product Benchmarking
- 10.4.2.4. Recent Developments/ Strategic Initiatives
- 10.4.3. Danaher Corporation (Ab Sciex LLC)
- 10.4.3.1. Participant's Overview
- 10.4.3.2. Financial Performance
- 10.4.3.3. Product Benchmarking
- 10.4.3.4. Recent Developments/ Strategic Initiatives
- 10.4.4. Bruker Corporation
- 10.4.4.1. Participant's Overview
- 10.4.4.2. Financial Performance
- 10.4.4.3. Product Benchmarking
- 10.4.4.4. Recent Developments/ Strategic Initiatives
- 10.4.5. PerkinElmer, Inc.
- 10.4.5.1. Participant's Overview
- 10.4.5.2. Financial Performance
- 10.4.5.3. Product Benchmarking
- 10.4.5.4. Recent Developments/ Strategic Initiatives
- 10.4.6. ABB Ltd.
- 10.4.6.1. Participant's Overview
- 10.4.6.2. Financial Performance
- 10.4.6.3. Product Benchmarking
- 10.4.6.4. Recent Developments/ Strategic Initiatives
- 10.4.7. Carl Zeiss AG (Zeiss Group)
- 10.4.7.1. Participant's Overview
- 10.4.7.2. Financial Performance
- 10.4.7.3. Product Benchmarking
- 10.4.7.4. Recent Developments/ Strategic Initiatives
- 10.4.8. Emerson Electric Co.
- 10.4.8.1. Participant's Overview
- 10.4.8.2. Financial Performance
- 10.4.8.3. Product Benchmarking
- 10.4.8.4. Recent Developments/ Strategic Initiatives
- 10.4.9. Mettler-Toledo
- 10.4.9.1. Participant's Overview
- 10.4.9.2. Financial Performance
- 10.4.9.3. Product Benchmarking
- 10.4.9.4. Recent Developments/ Strategic Initiatives
- 10.4.10. Shimadzu Corporation
- 10.4.10.1. Participant's Overview
- 10.4.10.2. Financial Performance
- 10.4.10.3. Product Benchmarking
- 10.4.10.4. Recent Developments/ Strategic Initiatives
- 10.4.11. Sartorius AG
- 10.4.11.1. Participant's Overview
- 10.4.11.2. Financial Performance
- 10.4.11.3. Product Benchmarking
- 10.4.11.4. Recent Developments/ Strategic Initiatives
- 10.4.12. Hamilton Company
- 10.4.12.1. Participant's Overview
- 10.4.12.2. Financial Performance
- 10.4.12.3. Product Benchmarking
- 10.4.12.4. Recent Developments/ Strategic Initiatives
- 10.4.13. Repligen Corporation
- 10.4.13.1. Participant's Overview
- 10.4.13.2. Financial Performance
- 10.4.13.3. Product Benchmarking
- 10.4.13.4. Recent Developments/ Strategic Initiatives
- 10.4.1. Thermo Fisher Scientific Inc.

