|
|
市場調査レポート
商品コード
1122250
バッテリー冷却プレートの市場規模、シェア、動向分析レポート:製品別(直接冷却、間接冷却)、用途別(BEV、PHEV)、地域別、セグメント別予測、2022年~2030年Battery Cooling Plate Market Size, Share & Trends Analysis Report By Product (Direct Cooling, Indirect Cooling), By Application (BEV, PHEV), By Region, And Segment Forecasts, 2022 - 2030 |
||||||
|
|
|||||||
|
● お客様のご希望に応じて、既存データの加工や未掲載情報(例:国別セグメント)の追加などの対応が可能です。 詳細はお問い合わせください。 |
|||||||


| バッテリー冷却プレートの市場規模、シェア、動向分析レポート:製品別(直接冷却、間接冷却)、用途別(BEV、PHEV)、地域別、セグメント別予測、2022年~2030年 |
|
出版日: 2022年08月04日
発行: Grand View Research
ページ情報: 英文 100 Pages
納期: 2~10営業日
|
- 全表示
- 概要
- 図表
- 目次
バッテリー冷却プレートの市場成長・動向
Grand View Research, Inc.の最新レポートによると、バッテリー冷却プレートの世界市場規模は2030年までに50億1000万米ドルに達し、予測期間中にCAGR35.7%で拡大すると予測されています。脱炭素化の取り組みやグリーンエネルギーへの取り組みが進んでいることから、電気自動車(EV)の需要が増加していることが、予測期間中のバッテリー冷却プレート市場成長の主な要因になると予想されます。
バッテリー電気自動車(BEV)は、市場の数量需要を牽引すると予想されます。このタイプのEVは、モーターを駆動するための電気エネルギーを蓄えるためにバッテリーパックを使用します。放熱は安全性と最適な性能のために非常に重要であるため、バッテリー冷却プレートは広く利用されています。この冷却板は、主に液冷方式で使用され、電池の熱管理システム技術として広く利用されています。
EVの生産台数の増加が、市場の成長を後押ししています。例えば、2022年5月、現代自動車は、米国ジョージア州に同社初のEVおよびバッテリー生産施設を建設するため、55億4000万米ドルを投資すると発表しました。この投資は、2030年までに全世界で年間323万台のEVを販売するという同社の目標達成に向けた一歩となります。
2021年の市場では、間接冷却が最も高い収益シェアを占めており、この傾向は予測期間中も続くと思われます。従来の内燃機関と同様に、液体冷却材はバッテリー冷却プレートに組み込まれたパイプのシステム内を循環します。最も広く利用されている商用技術であり、EVで容易に活用されています。より効率的な冷却方法を開発するための研究開発が進められています。
2021年の市場シェアは、販売台数が多いアジア太平洋地域が最も高い売上高を占めています。充電インフラの整備が急ピッチで進められています。購入を促進するために、様々な税制優遇措置がとられています。例えば、中国はCOVID-19の状況を受けて、販売を促進するために、EVの10%の購入税免除を延長することを検討しています。これにより、EVの生産が促進され、バッテリー冷却プレートの需要にプラスの影響を与えることが予想されます。
バッテリー冷却プレート市場のハイライト
製品別では、間接冷却が2022年から2030年まで収益ベースでCAGR35.9%を記録すると予測されます。この冷却方式は、確立された技術、広く利用可能な冷却液、経済的なコストにより、EVに広く使用されています。
用途別では、BEVが予測期間中に収益ベースで最も高いCAGR 40.3%を記録すると予測されています。BEVは純粋なバッテリー駆動の自動車で、二酸化炭素排出量がゼロであり、製造や購入に税制上の優遇措置が適用されます。
地域別では、アジア太平洋地域が予測期間中、収益ベースで最も高いCAGR37.6%を記録すると予想されます。政府のさまざまな取り組みが成長を後押ししています。例えば、この地域は、世界中でEVの導入と採用を加速させることを目的としたフォーラムである電気自動車イニシアティブ(EVI)に加盟しています。
2021年9月、マーレGmbHは、バッテリーを冷却するための新しいシステムを開発しました。この浸漬冷却技術は、EVの充電時間の短縮に役立つため、電池の小型化が可能となり、より省資源で低コストのEVを実現します。
目次
第1章 調査手法と範囲
- 市場セグメンテーションと範囲
- 市場の定義
- 情報調達
- 購入したデータベース
- GVRの内部データベース
- 二次情報と第三者の視点
- 1次調査
- 情報分析
- データ分析モデル
- 市場形成とデータ可視化
- データの検証と公開
第2章 エグゼクティブサマリー
- 市場の洞察
- 市場のスナップショット
- セグメント別見通し
第3章 バッテリー冷却プレート市場の変数、動向、および範囲
- 市場の見通し
- 浸透と成長の見通しのマッピング
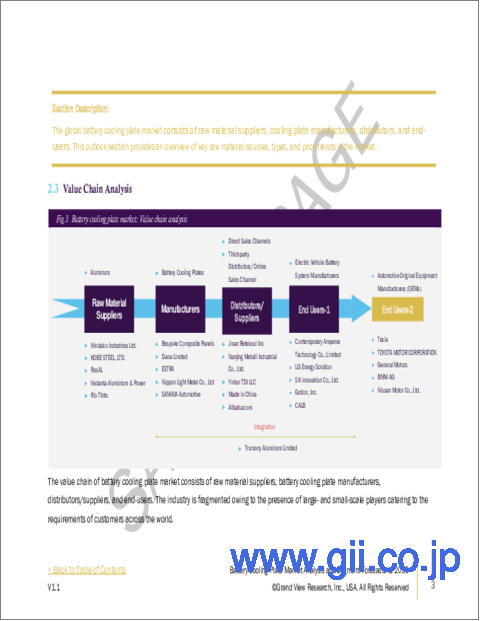
- 業界バリューチェーン分析
- 原材料の動向
- 製造動向と技術概要
- 規制の枠組み
- バッテリー冷却プレート市場力学
- 市場促進要因分析
- 市場制約分析
- 業界の課題
- ビジネス環境分析
- ポーターのファイブフォース分析
- サプライヤーの力
- 買い手の交渉力
- 代替の脅威
- 新規参入者からの脅威
- 競争企業間の敵対関係
- PESTEL分析
- 政治的
- 経済的
- 社交
- 技術的な
- 環境
- 法的
- ポーターのファイブフォース分析
第4章 バッテリー冷却プレート市場:製品推定・動向分析
- 定義と範囲
- バッテリー冷却プレート市場:製品変動分析、2021年および2030年
- 直接冷却
- 2017年から2030年までの直接冷却別市場の見積もりと予測(100万米ドル)(キロトン)
- 間接冷却
- 2017年から2030年までの間接冷却別市場の見積もりと予測(100万米ドル)(キロトン)
第5章 バッテリー冷却プレート市場:アプリケーションの推定・動向分析
- 定義と範囲
- バッテリー冷却プレート市場:アプリケーション変動分析、2021 &2030
- BEV
- 2017年から2030年までのBEV別市場の見積もりと予測(100万米ドル)(キロトン)
- PHEV
- 2017年から2030年までのPHEV別市場の見積もりと予測(100万米ドル)(キロトン)
第6章 バッテリー冷却プレート市場の地域推定・動向分析
- 地域のスナップショット
- 地域別変動分析と市場シェア、2021年と2030年
- 北米
- 米国
- 欧州
- ドイツ
- フランス
- 英国
- オランダ
- アジア太平洋地域
- 中国
- 日本
- 中南米
- 中東とアフリカ
第7章 バッテリー冷却プレート市場:競合分析
- 主要な市場参加者別最近の動向と影響分析
- ベンダー情勢
- 原材料のサプライヤー、ディストリビューター、およびその他の著名なメーカーのリスト
- 見込みエンドユーザーのリスト
第8章 企業プロファイル
- Bespoke Composite Panels
- 会社概要
- 財務実績
- 製品のベンチマーク
- 戦略的イニシアチブ
- Dana Limited
- 会社概要
- 財務実績
- 製品のベンチマーク
- 戦略的イニシアチブ
- Estra Automotive
- 会社概要
- 財務実績
- 製品のベンチマーク
- 戦略的イニシアチブ
- HELLA GmbH &Co. KGaA
- 会社概要
- 財務実績
- 製品のベンチマーク
- 戦略的イニシアチブ
- KOHSAN Co., Ltd
- 会社概要
- 財務実績
- 製品のベンチマーク
- 戦略的イニシアチブ
- MAHLE GmbH
- 会社概要
- 財務実績
- 製品のベンチマーク
- 戦略的イニシアチブ
- Modine Manufacturing Company
- 会社概要
- 財務実績
- 製品のベンチマーク
- 戦略的イニシアチブ
- Nippon Light Metals
- 会社概要
- 財務実績
- 製品のベンチマーク
- 戦略的イニシアチブ
- Priatherm
- 会社概要
- 財務実績
- 製品のベンチマーク
- 戦略的イニシアチブ
- SANHUA Automotive
- 会社概要
- 財務実績
- 製品のベンチマーク
- 戦略的イニシアチブ
List of Tables
- Table 1 Battery cooling plate market estimates & forecasts, 2017 - 2030 (USD Million) (Kilotons)
- Table 2 Battery cooling plate market estimates & forecasts, by direct cooling, 2017 - 2030 (USD Million) (Kilotons)
- Table 3 Battery cooling plate market estimates & forecasts, by indirect cooling, 2017 - 2030 (USD Million) (Kilotons)
- Table 4 Battery cooling plate market estimates & forecasts, by BEV, 2017 - 2030 (USD Million) (Kilotons)
- Table 5 Battery cooling plate market estimates & forecasts, by PHEV, 2017 - 2030 (USD Million) (Kilotons)
- Table 6 North America battery cooling plate market estimates & forecasts, 2017 - 2030 (USD Million) (Kilotons)
- Table 7 North America battery cooling plate market estimates & forecasts, by product, 2017 - 2030 (USD Million)
- Table 8 North America battery cooling plate market estimates & forecasts, by product, 2017 - 2030 (Kilotons)
- Table 9 North America battery cooling plate market estimates & forecasts, by application, 2017 - 2030 (USD Million)
- Table 10 North America battery cooling plate market estimates & forecasts, by application, 2017 - 2030 (Kilotons)
- Table 11 U.S. battery cooling plate market estimates & forecasts, 2017 - 2030 (USD Million) (Kilotons)
- Table 12 U.S. battery cooling plate market estimates & forecasts, by product, 2017 - 2030 (USD Million)
- Table 13 U.S. battery cooling plate market estimates & forecasts, by product, 2017 - 2030 (Kilotons)
- Table 14 U.S. battery cooling plate market estimates & forecasts, by application, 2017 - 2030 (USD Million
- Table 15 U.S. battery cooling plate market estimates & forecasts, by application, 2017 - 2030 (Kilotons)
- Table 16 Europe battery cooling plate market estimates & forecasts, 2017 - 2030 (USD Million) (Kilotons)
- Table 17 Europe battery cooling plate market estimates & forecasts, by product, 2017 - 2030 (USD Million)
- Table 18 Europe battery cooling plate market estimates & forecasts, by product, 2017 - 2030 (Kilotons)
- Table 19 Europe battery cooling plate market estimates & forecasts, by application, 2017 - 2030 (USD Million)
- Table 20 Europe battery cooling plate market estimates & forecasts, by application, 2017 - 2030 (Kilotons)
- Table 21 Germany battery cooling plate market estimates & forecasts, 2017 - 2030 (USD Million) (Kilotons)
- Table 22 Germany battery cooling plate market estimates & forecasts, by product, 2017 - 2030 (USD Million)
- Table 23 Germany battery cooling plate market estimates & forecasts, by product, 2017 - 2030 (Kilotons)
- Table 24 Germany battery cooling plate market estimates & forecasts, by application, 2017 - 2030 (USD Million)
- Table 25 Germany battery cooling plate market estimates & forecasts, by application, 2017 - 2030 (Kilotons)
- Table 26 France battery cooling plate market estimates & forecasts, 2017 - 2030 (USD Million) (Kilotons)
- Table 27 France battery cooling plate market estimates & forecasts, by product, 2017 - 2030 (USD Million)
- Table 28 France battery cooling plate market estimates & forecasts, by product, 2017 - 2030 (Kilotons)
- Table 29 France battery cooling plate market estimates & forecasts, by application, 2017 - 2030 (USD Million)
- Table 30 France battery cooling plate market estimates & forecasts, by application, 2017 - 2030 (Kilotons)
- Table 31 U.K. battery cooling plate market estimates & forecasts, 2017 - 2030 (USD Million) (Kilotons)
- Table 32 U.K. battery cooling plate market estimates & forecasts, by product, 2017 - 2030 (USD Million)
- Table 33 U.K. battery cooling plate market estimates & forecasts, by product, 2017 - 2030 (Kilotons)
- Table 34 U.K. battery cooling plate market estimates & forecasts, by application, 2017 - 2030 (USD Million)
- Table 35 U.K. battery cooling plate market estimates & forecasts, by application, 2017 - 2030 (Kilotons)
- Table 36 Netherlands battery cooling plate market estimates & forecasts, 2017 - 2030 (USD Million) (Kilotons)
- Table 37 Netherlands battery cooling plate market estimates & forecasts, by product, 2017 - 2030 (USD Million)
- Table 38 Netherlands battery cooling plate market estimates & forecasts, by product, 2017 - 2030 (Kilotons)
- Table 39 Netherlands battery cooling plate market estimates & forecasts, by application, 2017 - 2030 (USD Million)
- Table 40 Netherlands battery cooling plate market estimates & forecasts, by application, 2017 - 2030 (Kilotons)
- Table 41 Asia Pacific battery cooling plate market estimates & forecasts, 2017 - 2030 (USD Million) (Kilotons)
- Table 42 Asia Pacific battery cooling plate market estimates & forecasts, by product, 2017 - 2030 (USD Million)
- Table 43 Asia Pacific battery cooling plate market estimates & forecasts, by product, 2017 - 2030 (Kilotons)
- Table 44 Asia Pacific battery cooling plate market estimates & forecasts, by application, 2017 - 2030 (USD Million)
- Table 45 Asia Pacific battery cooling plate market estimates & forecasts, by application, 2017 - 2030 (Kilotons)
- Table 46 China battery cooling plate market estimates & forecasts, 2017 - 2030 (USD Million) (Kilotons)
- Table 47 China battery cooling plate market estimates & forecasts, by product, 2017 - 2030 (USD Million)
- Table 48 China battery cooling plate market estimates & forecasts, by product, 2017 - 2030 (Kilotons)
- Table 49 China battery cooling plate market estimates & forecasts, by application, 2017 - 2030 (USD Million)
- Table 50 China battery cooling plate market estimates & forecasts, by application, 2017 - 2030 (Kilotons)
- Table 51 Japan battery cooling plate market estimates & forecasts, 2017 - 2030 (USD Million) (Kilotons)
- Table 52 Japan battery cooling plate market estimates & forecasts, by product, 2017 - 2030 (USD Million)
- Table 53 Japan battery cooling plate market estimates & forecasts, by product, 2017 - 2030 (Kilotons)
- Table 54 Japan battery cooling plate market estimates & forecasts, by application, 2017 - 2030 (USD Million)
- Table 55 Japan battery cooling plate market estimates & forecasts, by application, 2017 - 2030 (Kilotons)
- Table 56 Central & South America battery cooling plate market estimates & forecasts, 2017 - 2030 (USD Million) (Kilotons)
- Table 57 Central & South America battery cooling plate market estimates & forecasts, by product, 2017 - 2030 (USD Million)
- Table 58 Central & South America battery cooling plate market estimates & forecasts, by product, 2017 - 2030 (Kilotons)
- Table 59 Central & South America battery cooling plate market estimates & forecasts, by application, 2017 - 2030 (USD Million)
- Table 60 Central & South America battery cooling plate market estimates & forecasts, by application, 2017 - 2030 (Kilotons)
- Table 61 Middle East & Africa battery cooling plate market estimates & forecasts, 2017 - 2030 (USD Million) (Kilotons)
- Table 62 Middle East & Africa battery cooling plate market estimates & forecasts, by product, 2017 - 2030 (USD Million)
- Table 63 Middle East & Africa battery cooling plate market estimates & forecasts, by product, 2017 - 2030 (Kilotons)
- Table 64 Middle East & Africa battery cooling plate market estimates & forecasts, by application, 2017 - 2030 (USD Million)
- Table 65 Middle East & Africa battery cooling plate market estimates & forecasts, by application, 2017 - 2030 (Kilotons)
List of Figures
- Fig. 1 Market segmentation & scope
- Fig. 2 Information procurement
- Fig. 3 Primary research pattern
- Fig. 4 Primary research process
- Fig. 5 Primary research approaches
- Fig. 6 Market snapshot
- Fig. 7 Segmental outlook
- Fig. 8 Battery cooling plate market, 2017 - 2030 (USD Million) (Kilotons)
- Fig. 9 Penetration & growth prospect mapping, by application, 2021
- Fig. 10 Battery cooling plate market - Value chain analysis
- Fig. 11 Battery cooling plate - Market dynamics
- Fig. 12 Market driver analysis
- Fig. 13 Market restraint analysis
- Fig. 14 Battery cooling plate market: Product movement analysis, 2021 & 2030 (%) (USD Million)
- Fig. 15 Battery cooling plate market: Application movement analysis, 2021 & 2030 (%) (USD Million)
- Fig. 16 Battery cooling plate Market: Regional movement analysis, 2021 & 2030 (%) (USD Million)
Battery Cooling Plate Market Growth & Trends:
The global battery cooling plate market size is expected to reach USD 5.01 billion by 2030, according to a new report by Grand View Research, Inc., expanding at a CAGR of 35.7% during the forecast period. Increasing demand for electric vehicles (EVs) because of the ongoing decarbonization efforts and green energy initiatives is anticipated to be the key driver for the growth of the battery cooling plate market during the forecast period.
Battery electric vehicles (BEV) are anticipated to drive volume demand for the market. This type of EV uses a battery pack to store electrical energy to power its motor. Since heat dissipation is extremely important for safety and optimum performance, battery cooling plates are widely utilized. These are mainly used in liquid cooling, a widely used battery thermal management system technology.
An increase in the production of EVs is fueling market growth. For instance, in May 2022, Hyundai Motor announced to invest USD 5.54 billion in building its first EV and battery-producing facility in Georgia, U.S. The operations for this plant are anticipated to commence in 2025 having an expected annual production capacity of 300,000 vehicles. The investment is a step by the company to achieve its target of selling 3.23 million EVs in a year globally by 2030.
Indirect cooling accounted for the highest revenue share of the market in 2021 and this is likely to continue during the forecast period. Like traditional internal combustion engines, the liquid coolant circulates through a system of pipes that are embedded into a battery cooling plate. It is the most widely used commercial technology and is readily being utilized by EVs. There is ongoing R&D to develop more efficient cooling methods.
The Asia Pacific accounted for the highest revenue share of the market in 2021 due to the highest volumes sold. Charging infrastructure is being developed at a rapid pace. Various tax incentives are being provided to buyers to encourage purchase. For instance, China is considering extending the 10% purchase tax exemption on EVs, to boost sales, post the COVID-19 situation. This is anticipated to boost EV production and would positively impact the demand for battery cooling plate.
Battery Cooling Plate Market Report Highlights:
- Based on product, indirect cooling is anticipated to register a CAGR of 35.9%, in terms of revenue, from 2022 to 2030. This cooling type is widely used in EVs, because of its established technology, widely available coolant liquid, and economical cost
- Based on application, BEV is anticipated to register the highest CAGR of 40.3% in terms of revenue during the forecast period. These are purely battery-operated vehicles, which have zero carbon emission and attract tax incentives for their production and purchase
- Based on region, Asia Pacific is expected to register the highest CAGR of 37.6%, in terms of revenue, in the forecast period. Various government initiatives are propelling growth. For instance, the region is part of the Electric Vehicles Initiative (EVI), a forum that is aimed at accelerating the introduction and adoption of EVs worldwide
- In September 2021, MAHLE GmbH developed a new system for cooling batteries. The immersion cooling technology helps in reducing charging time for EVs; thus, batteries can be smaller, resulting in more resource-efficient and low-cost EVs
Table of Contents
Chapter 1. Methodology and Scope
- 1.1. Market Segmentation & Scope
- 1.2. Market Definition
- 1.3. Information Procurement
- 1.3.1. Purchased Database
- 1.3.2. GVR's Internal Database
- 1.3.3. Secondary Sources & Third-Party Perspectives
- 1.3.4. Primary Research
- 1.4. Information Analysis
- 1.4.1. Data Analysis Models
- 1.5. Market Formulation & Data Visualization
- 1.6. Data Validation & Publishing
Chapter 2. Executive Summary
- 2.1. Market Insights
- 2.2. Market Snapshot
- 2.3. Segmental Outlook
Chapter 3. Battery Cooling Plate Market Variables, Trends, and Scope
- 3.1. Market Outlook
- 3.2. Penetration & Growth Prospect Mapping
- 3.3. Industry Value Chain Analysis
- 3.3.1. Raw Material Trends
- 3.4. Manufacturing Trends & Technology Overview
- 3.5. Regulatory Framework
- 3.6. Battery Cooling Plate Market Dynamics
- 3.6.1. Market Driver Analysis
- 3.6.2. Market Restraint Analysis
- 3.6.3. Industry Challenges
- 3.7. Business Environmental Analysis
- 3.7.1. Porter's Five Forces Analysis
- 3.7.1.1. Supplier Power
- 3.7.1.2. Buyer Power
- 3.7.1.3. Substitution Threat
- 3.7.1.4. Threat From New Entrant
- 3.7.1.5. Competitive Rivalry
- 3.7.2. PESTEL Analysis
- 3.7.2.1. Political
- 3.7.2.2. Economic
- 3.7.2.3. Social
- 3.7.2.4. Technological
- 3.7.2.5. Environmental
- 3.7.2.6. Legal
- 3.7.1. Porter's Five Forces Analysis
Chapter 4. Battery Cooling Plate Market: Product Estimates & Trend Analysis
- 4.1. Definition & Scope
- 4.2. Battery Cooling Plate Market: Product Movement Analysis, 2021 & 2030
- 4.3. Direct Cooling
- 4.3.1. Market estimates & forecasts, by direct cooling, 2017 - 2030 (USD Million) (Kilotons)
- 4.4. Indirect Cooling
- 4.4.1. Market estimates & forecasts, by indirect cooling, 2017 - 2030 (USD Million) (Kilotons)
Chapter 5. Battery Cooling Plate Market: Application Estimates & Trend Analysis
- 5.1. Definition & Scope
- 5.2. Battery Cooling Plate Market: Application Movement Analysis, 2021 & 2030
- 5.3. BEV
- 5.3.1. Market estimates & forecasts, by BEV, 2017 - 2030 (USD Million) (Kilotons)
- 5.4. PHEV
- 5.4.1. Market estimates & forecasts, by PHEV, 2017 - 2030 (USD Million) (Kilotons)
Chapter 6. Battery Cooling Plate Market Regional Estimates & Trend Analysis
- 6.1. Regional Snapshot
- 6.2. Regional Movement Analysis & Market Share, 2021 & 2030
- 6.3. North America
- 6.3.1. North America battery cooling plate market estimates and forecasts, 2017 - 2030 (USD Million) (Kilotons)
- 6.3.2. North America battery cooling plate market estimates and forecasts, by product, 2017 - 2030 (USD Million) (Kilotons)
- 6.3.3. North America battery cooling plate market estimates and forecasts, by application, 2017 - 2030 (USD Million) (Kilotons)
- 6.3.4. U.S.
- 6.3.4.1 U.S. battery cooling plate market estimates and forecasts, 2017 - 2030 (USD Million) (Kilotons)
- 6.3.4.2 U.S. battery cooling plate market estimates and forecasts, by product, 2017 - 2030 (USD Million) (Kilotons)
- 6.3.4.3 U.S. battery cooling plate market estimates and forecasts, by application, 2017 - 2030 (USD Million) (Kilotons)
- 6.4. Europe
- 6.4.1. Europe battery cooling plate market estimates and forecasts, 2017 - 2030 (USD Million) (Kilotons)
- 6.4.2. Europe battery cooling plate market estimates and forecasts, by product, 2017 - 2030 (USD Million) (Kilotons)
- 6.4.3. Europe battery cooling plate market estimates and forecasts, by application, 2017 - 2030 (USD Million) (Kilotons)
- 6.4.4. Germany
- 6.4.4.1 Germany battery cooling plate market estimates and forecasts, 2017 - 2030 (USD Million) (Kilotons)
- 6.4.4.2 Germany battery cooling plate market estimates and forecasts, by product, 2017 - 2030 (USD Million) (Kilotons)
- 6.4.4.3 Germany battery cooling plate market estimates and forecasts, by application, 2017 - 2030 (USD Million) (Kilotons)
- 6.4.5. France
- 6.4.5.1 France battery cooling plate market estimates and forecasts, 2017 - 2030 (USD Million) (Kilotons)
- 6.4.5.2 France battery cooling plate market estimates and forecasts, by product, 2017 - 2030 (USD Million) (Kilotons)
- 6.4.5.3 France battery cooling plate market estimates and forecasts, by application, 2017 - 2030 (USD Million) (Kilotons)
- 6.4.6. U.K.
- 6.4.6.1 U.K. battery cooling plate market estimates and forecasts, 2017 - 2030 (USD Million) (Kilotons)
- 6.4.6.2 U.K. battery cooling plate market estimates and forecasts, by product, 2017 - 2030 (USD Million) (Kilotons)
- 6.4.6.3 U.K. battery cooling plate market estimates and forecasts, by application, 2017 - 2030 (USD Million) (Kilotons)
- 6.4.7. Netherlands
- 6.4.7.1 Netherlands battery cooling plate market estimates and forecasts, 2017 - 2030 (USD Million) (Kilotons)
- 6.4.7.2 Netherlands battery cooling plate market estimates and forecasts, by product, 2017 - 2030 (USD Million) (Kilotons)
- 6.4.7.3 Netherlands battery cooling plate market estimates and forecasts, by application, 2017 - 2030 (USD Million) (Kilotons)
- 6.5. Asia Pacific
- 6.5.1. Asia Pacific battery cooling plate market estimates and forecasts, 2017 - 2030 (USD Million) (Kilotons)
- 6.5.2. Asia Pacific battery cooling plate market estimates and forecasts, by product, 2017 - 2030 (USD Million) (Kilotons)
- 6.5.3. Asia Pacific battery cooling plate market estimates and forecasts, by application, 2017 - 2030 (USD Million) (Kilotons)
- 6.5.4. China
- 6.5.4.1 China battery cooling plate market estimates and forecasts, 2017 - 2030 (USD Million) (Kilotons)
- 6.5.4.2 China battery cooling plate market estimates and forecasts, by product, 2017 - 2030 (USD Million) (Kilotons)
- 6.5.4.3 China battery cooling plate market estimates and forecasts, by application, 2017 - 2030 (USD Million) (Kilotons)
- 6.5.5. Japan
- 6.5.5.1 Japan battery cooling plate market estimates and forecasts, 2017 - 2030 (USD Million) (Kilotons)
- 6.5.5.2 Japan battery cooling plate market estimates and forecasts, by product, 2017 - 2030 (USD Million) (Kilotons)
- 6.5.5.3 Japan battery cooling plate market estimates and forecasts, by application, 2017 - 2030 (USD Million) (Kilotons)
- 6.6. Central & South America
- 6.6.1. Central & South America battery cooling plate market estimates and forecasts, 2017 - 2030 (USD Million) (Kilotons)
- 6.6.2. Central & South America battery cooling plate market estimates and forecasts, by product, 2017 - 2030 (USD Million) (Kilotons)
- 6.6.3. Central & South America battery cooling plate market estimates and forecasts, by application, 2017 - 2030 (USD Million) (Kilotons)
- 6.7. Middle East & Africa
- 6.7.1. Middle East & Africa battery cooling plate market estimates and forecasts, 2017 - 2030 (USD Million) (Kilotons)
- 6.7.2. Middle East & Africa battery cooling plate market estimates and forecasts, by product, 2017 - 2030 (USD Million) (Kilotons)
- 6.7.3. Middle East & Africa battery cooling plate market estimates and forecasts, by application, 2017 - 2030 (USD Million) (Kilotons)
Chapter 7. Battery Cooling Plate Market: Competitive Analysis
- 7.1. Recent Developments & Impact Analysis, By Key Market Participants
- 7.2. Vendor Landscape
- 7.2.1. List of raw material suppliers, distributors, and other prominent manufacturers
- 7.2.2. List of prospective end-users
Chapter 8. Company Profiles
- 8.1. Bespoke Composite Panels
- 8.1.1. Company Overview
- 8.1.2. Financial Performance
- 8.1.3. Product Benchmarking
- 8.1.4. Strategic Initiatives
- 8.2. Dana Limited
- 8.2.1. Company Overview
- 8.2.2. Financial Performance
- 8.2.3. Product Benchmarking
- 8.2.4. Strategic Initiatives
- 8.3. Estra Automotive
- 8.3.1. Company Overview
- 8.3.2. Financial Performance
- 8.3.3. Product Benchmarking
- 8.3.4. Strategic Initiatives
- 8.4. HELLA GmbH & Co. KGaA
- 8.4.1. Company Overview
- 8.4.2. Financial Performance
- 8.4.3. Product Benchmarking
- 8.4.4. Strategic Initiatives
- 8.5. KOHSAN Co., Ltd
- 8.5.1. Company Overview
- 8.5.2. Financial Performance
- 8.5.3. Product Benchmarking
- 8.5.4. Strategic Initiatives
- 8.6. MAHLE GmbH
- 8.6.1. Company Overview
- 8.6.2. Financial Performance
- 8.6.3. Product Benchmarking
- 8.6.4. Strategic Initiatives
- 8.7. Modine Manufacturing Company
- 8.7.1. Company Overview
- 8.7.2. Financial Performance
- 8.7.3. Product Benchmarking
- 8.7.4. Strategic Initiatives
- 8.8. Nippon Light Metals
- 8.8.1. Company Overview
- 8.8.2. Financial Performance
- 8.8.3. Product Benchmarking
- 8.8.4. Strategic Initiatives
- 8.9. Priatherm
- 8.9.1. Company Overview
- 8.9.2. Financial Performance
- 8.9.3. Product Benchmarking
- 8.9.4. Strategic Initiatives
- 8.10. SANHUA Automotive
- 8.10.1. Company Overview
- 8.10.2. Financial Performance
- 8.10.3. Product Benchmarking
- 8.10.4. Strategic Initiatives