|
|
市場調査レポート
商品コード
1114097
ドッキングステーション市場規模・シェア・動向分析レポート製品別(ノートPC、スマートフォン)、接続性別(有線、無線)、流通チャネル別(オンライン、オフライン)、地域別、セグメント別予測、2022年~2030年Docking Station Market Size, Share & Trends Analysis Report By Product (Laptop, Smartphones), By Connectivity (Wired, Wireless), By Distribution Channel (Online, Offline), By Region, And Segment Forecasts, 2022 - 2030 |
||||||
|
|
|||||||
|
● お客様のご希望に応じて、既存データの加工や未掲載情報(例:国別セグメント)の追加などの対応が可能です。 詳細はお問い合わせください。 |
|||||||


| ドッキングステーション市場規模・シェア・動向分析レポート製品別(ノートPC、スマートフォン)、接続性別(有線、無線)、流通チャネル別(オンライン、オフライン)、地域別、セグメント別予測、2022年~2030年 |
|
出版日: 2022年07月22日
発行: Grand View Research
ページ情報: 英文 80 Pages
納期: 2~10営業日
|
- 全表示
- 概要
- 図表
- 目次
ドッキングステーション市場の成長と動向
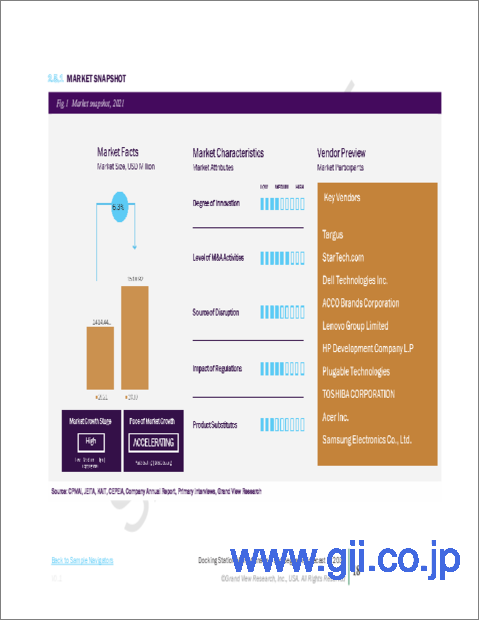
グランドビューリサーチ社の最新レポートによると、ドッキングステーションの世界市場規模は2030年には24億4450万米ドルに達すると予測されています。
同市場は2022年から2030年にかけてCAGR6.3%で拡大すると予測されています。市場開拓の主な要因は、経費削減のためのBYOD(Bring-Your-Own-Device)ワークカルチャーの人気の高まり、データ転送の高速化、柔軟性と効率性の向上などのニーズが業界開拓を支えていることです。
技術的な進歩やいくつかのオーディオビジュアル機器の革新が、これらのコンソールの需要を著しく高めています。また、高速インターネットや互換性のあるハードウェアへのアクセスが容易なことから、多人数参加型ビデオゲームの人気が高まっていることも、ドッキングステーションの需要を押し上げると予想されます。さらに、ゲーム業界で活動するベンダーは、ネオンブルーとネオンレッドのジョイコン付きNintendo Switchなど、いくつかの携帯用オプションで調整された製品を提供しています。
ノートPCセグメントは、2021年に72.1%の最大の収益シェアを占め、予測期間中はこのセグメントが支配的であると予測されます。スマートフォン・タブレット分野は、2022年から2030年にかけてCAGRが6.6%になると予測されています。コールオブデューティ、プレイヤーアンノウンズバトルグラウンド、フォートナイト、グランドセフトオートなどのオンラインビデオゲームに対する熱狂が世界中で高まっており、スマートフォンやタブレットのドッキングステーションに対する需要が高まっているため、今後数年間の市場成長を促進すると予想されます。
電子機器のトップメーカーやドッキングステーションを扱う企業もあるため、市場参加者は互いに激しい競争にさらされています。これらの企業は、地域および国際的な消費者に対応する強力かつ広大な流通網の存在により、大規模な顧客基盤を持っています。
ドッキングステーション市場のレポートハイライト
2022年から2030年にかけてのCAGRは6.3%と予測されています。経費削減と柔軟性・効率性の向上を目的としたBYOD(Bring-Your-Own-Device)ワークカルチャーの人気が高まり、業界の発展を支えています。
スマートフォンおよびタブレット端末は、予測期間中に最も速いCAGR(6.6%)を記録すると予想される
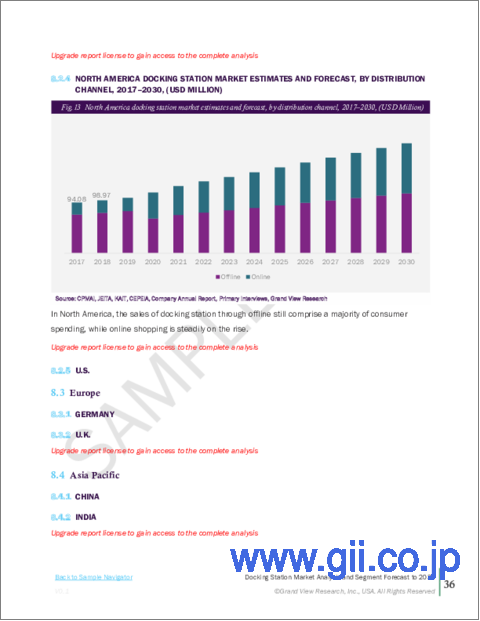
オフライン部門が市場を独占し、2021年に最大の売上高シェアを占めました。製品の認知度の向上と、新興APAC市場における大手国際企業の戦略的事業部門の新設による強力なプレゼンスが、小売チャネルを通じたセグメントの成長を後押しすると予想される
北米が市場を独占し、2021年の収益シェアは37.7%で最大となっています。同地域では、ミレニアル世代や子どもたちの間でeスポーツへの熱意が高まっており、ドッキングステーションの需要が急増している
目次
第1章 調査手法と範囲
- 市場セグメンテーションと範囲
- 市場の定義
- 情報調達
- 購入したデータベース
- GVRの内部データベース
- 二次情報と第三者の視点
- 1次調査
- 情報分析
- データ分析モデル
- 市場形成とデータ可視化
- データの検証と公開
第2章 エグゼクティブサマリー
- 市場の見通し
- 製品の見通し
- コネクティビティの見通し
- 流通経路の見通し
- 地域の見通し
第3章 ドッキングステーションの市場変数、動向、範囲
- 市場イントロダクション
- 浸透と成長の見通しのマッピング
- 業界バリューチェーン分析
- 販売・小売チャネル分析
- 利益率分析
- 市場力学
- 市場促進要因分析
- 市場制約分析
- 業界の課題
- 業界の機会
- 事業環境分析
- 業界分析- ポーターズ
- サプライヤーの力
- 買い手の交渉力
- 代替の脅威
- 新規参入者からの脅威
- 競争企業間の敵対関係
- 業界分析- ポーターズ
- ドッキングステーション市場のロードマップ
- 市場参入戦略
- ドッキングステーション市場に対するCOVID-19の影響
第4章 消費者行動分析
- 人口統計分析
- 消費者の動向と好み
- 購入決定に影響を与える要因
- 消費者製品の採用
- 所見と推奨事項
第5章 ドッキングステーション市場:製品の推定・動向分析
- 製品変動分析と市場シェア、2021年と2030年
- ラップトップ
- スマートフォン&タブレット
- その他
第6章 ドッキングステーション市場:接続推定・動向分析
- コネクティビティの変動分析と市場シェア、2021年と2030年
- 有線
- 無線
第7章 ドッキングステーション市場:流通チャネルの推定・動向分析
- 流通チャネルの変動分析と市場シェア、2021年と2030年
- オンライン
- オフライン
第8章 ドッキングステーション市場:地域推定・動向分析
- 地域別変動分析と市場シェア、2021年と2030年
- 北米
- 米国
- 欧州
- ドイツ
- 英国
- アジア太平洋地域
- 中国
- インド
- 中南米
- ブラジル
- 中東とアフリカ
- サウジアラビア
第9章 競合分析
- 主要な世界プレーヤー、最近の動向、業界への影響
- 主要企業/競合の分類(主要なイノベーター、市場リーダー、新興企業)
- ベンダー情勢
- 主要企業の市場シェア分析、2021年
第10章 企業プロファイル
- Targus
- 会社概要
- 財務実績
- 製品のベンチマーク
- 戦略的イニシアチブ
- StarTech.com
- 会社概要
- 財務実績
- 製品のベンチマーク
- 戦略的イニシアチブ
- Dell Technologies Inc.
- 会社概要
- 財務実績
- 製品のベンチマーク
- 戦略的イニシアチブ
- ACCO Brand Corporation
- 会社概要
- 財務実績
- 製品のベンチマーク
- 戦略的イニシアチブ
- HP Development Company LP
- 会社概要
- 財務実績
- 製品のベンチマーク
- 戦略的イニシアチブ
- Lenevo Group Limited
- 会社概要
- 財務実績
- 製品のベンチマーク
- 戦略的イニシアチブ
- Plugable Technologies
- 会社概要
- 財務実績
- 製品のベンチマーク
- 戦略的イニシアチブ
- Toshiba Corporation
- 会社概要
- 財務実績
- 製品のベンチマーク
- 戦略的イニシアチブ
- Acer Inc.
- 会社概要
- 財務実績
- 製品のベンチマーク
- 戦略的イニシアチブ
- Samsung Electronics Co., Ltd.
- 会社概要
- 財務実績
- 製品のベンチマーク
- 戦略的イニシアチブ
List of Tables
- 1. Docking station market - Driving factor market analysis
- 2. Docking station market - Restraint factor market analysis
- 3. Laptop docking station market estimates and forecast, 2017 - 2030 (USD Million)
- 4. Smartphones docking station market estimates and forecast, 2017 - 2030 (USD Million)
- 5. Others market estimates and forecast, 2017 - 2030 (USD Million)
- 6. Wired docking station market estimates and forecast, 2017 - 2030 (USD Million)
- 7. Wireless docking station market estimates and forecast, 2017 - 2030 (USD Million)
- 8. Docking station market estimates and forecast through offline channel, 2017 - 2030 (USD Million)
- 9. Docking station market estimates and forecast through online channel, 2017 - 2030 (USD Million)
- 10. North America docking station market estimates and forecast, 2017 - 2030 (USD Million)
- 11. North America docking station market estimates and forecast, by product, 2017 - 2030 (USD Million)
- 12. North America docking station market estimates and forecast, by connectivity, 2017 - 2030
- 13. North America docking station market estimates and forecast, by distribution channel, 2017 - 2030 (USD Million)
- 14. U.S. docking station market estimates and forecast, 2017 - 2030 (USD Million)
- 15. U.S. docking station market estimates and forecast, by product, 2017 - 2030 (USD Million)
- 16. U.S. docking station market estimates and forecast, by connectivity, 2017 - 2030
- 17. U.S. docking station market estimates and forecast, by distribution channel, 2017 - 2030 (USD Million)
- 18. Europe docking station market estimates and forecast, 2017 - 2030 (USD Million)
- 19. Europe docking station market estimates and forecast, by product, 2017 - 2030 (USD Million)
- 20. Europe docking station market estimates and forecast, by connectivity, 2017 - 2030
- 21. Europe docking station market estimates and forecast, by distribution channel, 2017 - 2030 (USD Million)
- 22. U.K. docking station market estimates and forecast, 2017 - 2030 (USD Million)
- 23. U.K. docking station market estimates and forecast, by product, 2017 - 2030 (USD Million)
- 24. U.K. docking station market estimates and forecast, by connectivity, 2017 - 2030
- 25. U.K. docking station market estimates and forecast, by distribution channel, 2017 - 2030 (USD Million)
- 26. Germany docking station market estimates and forecast, 2017 - 2030 (USD Million)
- 27. Germany docking station market estimates and forecast, by product, 2017 - 2030 (USD Million)
- 28. Germany docking station market estimates and forecast, by connectivity, 2017 - 2030 (USD Million)
- 29. Germany docking station market estimates and forecast, by distribution channel, 2017 - 2030 (USD Million)
- 30. Asia Pacific docking station market estimates and forecast, 2017 - 2030 (USD Million)
- 31. Asia Pacific docking station market estimates and forecast, by product, 2017 - 2030 (USD Million)
- 32. Asia Pacific docking station market estimates and forecast, by connectivity, 2017 - 2030 (USD Million)
- 33. Asia Pacific docking station market estimates and forecast, by distribution channel, 2017 - 2030
- 34. China Pacific docking station market estimates and forecast, 2017 - 2030 (USD Million)
- 35. China docking station market estimates and forecast, by product, 2017 - 2030 (USD Million)
- 36. China docking station market estimates and forecast, by connectivity, 2017 - 2030
- 37. China docking station market estimates and forecast, by distribution channel, 2017 - 2030 (USD Million)
- 38. India docking station market estimates and forecast, 2017 - 2030 (USD Million)
- 39. India docking station market estimates and forecast, by product, 2017 - 2030 (USD Million)
- 40. India docking station market estimates and forecast, by connectivity, 2017 - 2030
- 41. India docking station market estimates and forecast, by distribution channel, 2017 - 2030 (USD Million)
- 42. Central & South America docking station market estimates and forecast, 2017 - 2030 (USD Million)
- 43. Central & South America docking station market estimates and forecast, by product, 2017 - 2030 (USD Million)
- 44. Central & South America docking station market estimates and forecast, by connectivity, 2017 - 2030
- 45. Central & South America docking station market estimates and forecast, by distribution channel, 2017 - 2030 (USD Million)
- 46. Brazil docking station market estimates and forecast, 2017 - 2030 (USD Million)
- 47. Brazil docking station market estimates and forecast, by connectivity, 2017 - 2030
- 48. Brazil docking station market estimates and forecast, by product, 2017 - 2030 (USD Million)
- 49. Brazil docking station market estimates and forecast, by distribution channel, 2017 - 2030 (USD Million)
- 50. Middle East & Africa docking station market estimates and forecast, 2017 - 2030 (USD Million)
- 51. Middle East & Africa docking station market estimates and forecast, by product, 2017 - 2030 (USD Million)
- 52. Middle East & Africa docking station market estimates and forecast, by connectivity, 2017 - 2030
- 53. Middle East & Africa docking station market estimates and forecast, by distribution channel, 2017 - 2030 (USD Million)
- 54. Saudi Arabia docking station market estimates and forecast, 2017 - 2030 (USD Million)
- 55. Saudi Arabia docking station market estimates and forecast, by product, 2017 - 2030 (USD Million)
- 56. Saudi Arabia docking station market estimates and forecast, by connectivity, 2017 - 2030
- 57. Saudi Arabia docking station market estimates and forecast, by distribution channel, 2017 - 2030 (USD Million)
- 58. Company categorization
List of Figures
- Fig. 1 Docking station market segmentation
- Fig. 2 Information procurement
- Fig. 3 Primary research pattern
- Fig. 4 Primary research approaches
- Fig. 5 Primary research process
- Fig. 6 Docking station market - Product growth
- Fig. 7 Docking station market - value chain analysis
- Fig. 8 Retail chain analysis
- Fig. 9 Profit margin analysis
- Fig. 10 Global gaming consoles market revenue, 2017 - 2030 (USD Billion)
- Fig. 11 Docking station market: Porters five forces analysis
- Fig. 12 Roadmap of Docking Station market
- Fig. 13 Docking station market: Product share (%) analysis, 2021 & 2030
- Fig. 14 Docking station market: Connectivity share (%) analysis, 2021 & 2030
- Fig. 15 Docking station market: Distribution channel share (%) analysis, 2021 & 2030
- Fig. 16 Docking station market: Regional share (%) analysis, 2021 & 2030
- Fig. 17 Docking station market: Company market share analysis, 2021 (%)
Docking Station Market Growth & Trends:
The global docking station market size is expected to reach USD 2,444.5 million by 2030, according to a new report by Grand View Research, Inc. The market is expected to expand at a CAGR of 6.3% from 2022 to 2030. The market growth is largely driven by factors such as, the rising popularity of the Bring-Your-Own-Device (BYOD) work culture to reduce expenses, the growing need for faster data transfer, and increase flexibility and efficiency is supporting the industry development.
Technological advancements and innovations in several audiovisual devices have significantly increased the demand for these consoles. The rising popularity of multiplayer video games owing to easy access to high-speed Internet and compatible hardware is also expected to boost the demand for docking stations. Moreover, vendors operating in the gaming industry offer tailored products in several portable options such as Nintendo Switch with Neon Blue and Neon Red Joy-Console.
The laptops segment accounted for the largest revenue share of 72.1% in 2021 and this segment is expected to be dominant during the forecast period. The smartphone and tablet segment is expected to witness a CAGR of 6.6% during 2022 and 2030. Growing enthusiasm over online video games, such as Call of Duty, Player Unknown's Battlegrounds, Fortnite, and Grand Theft Auto, worldwide, the demand for smartphones and tablets docking stations is increasing which is expected to propel market growth in coming years.
The market players face intense competition from each other as some of them are among the top manufacturers of electronics and also deal in docking stations. These companies have a large customer base owing to the presence of strong and vast distribution networks to cater to both regional and international consumers.
Docking Station Market Report Highlights:
- The market is expected to witness a CAGR of 6.3% from 2022 to 2030. Rising popularity of Bring-Your-Own-Device (BYOD) work culture to reduce expenses and increase flexibility and efficiency is supporting the industry development
- The smartphone and tablet segment is expected to witness the fastest CAGR of 6.6% over the forecast period
- The offline segment dominated the market and accounted for the largest revenue share in 2021. The increased product visibility, along with strong presence of major international companies in emerging APAC markets through newly established strategic business units, is expected to boost segment growth through the retail channel
- North America dominated the market and accounted for the largest revenue share of 37.7% in 2021. Rising enthusiasm of e-sports among millennials and children in the region is surging the demand for docking stations
Table of Contents
Chapter 1. Methodology and Scope
- 1.1. Market Segmentation & Scope
- 1.2. Market Definition
- 1.3. Information Procurement
- 1.3.1. Purchased Database
- 1.3.2. GVR's Internal Database
- 1.3.3. Secondary Sources & Third-Party Perspectives
- 1.3.4. Primary Research
- 1.4. Information Analysis
- 1.4.1. Data Analysis Models
- 1.5. Market Formulation & Data Visualization
- 1.6. Data Validation & Publishing
Chapter 2. Executive Summary
- 2.1. Market Outlook
- 2.2. Product Outlook
- 2.3. Connectivity Outlook
- 2.4. Distribution Channel Outlook
- 2.5. Regional Outlook
Chapter 3. Docking station Market Variables, Trends & Scope
- 3.1. Market Introduction
- 3.2. Penetration & Growth Prospect Mapping
- 3.3. Industry Value Chain Analysis
- 3.3.1. Sales/Retail Channel Analysis
- 3.3.2. Profit Margin Analysis
- 3.4. Market Dynamics
- 3.4.1. Market Driver Analysis
- 3.4.2. Market Restraint Analysis
- 3.4.3. Industry Challenges
- 3.4.4. Industry Opportunities
- 3.5. Business Environment Analysis
- 3.5.1. Industry Analysis - Porter's
- 3.5.1.1. Supplier Power
- 3.5.1.2. Buyer Power
- 3.5.1.3. Substitution Threat
- 3.5.1.4. Threat from New Entrant
- 3.5.1.5. Competitive Rivalry
- 3.5.1. Industry Analysis - Porter's
- 3.6. Roadmap of Docking Station Market
- 3.7. Market Entry Strategies
- 3.8. Impact of COVID-19 on the Docking Station Market
Chapter 4. Consumer Behavior Analysis
- 4.1. Demographic Analysis
- 4.2. Consumer Trends and Preferences
- 4.3. Factors Affecting Buying Decision
- 4.4. Consumer Product Adoption
- 4.5. Observations & Recommendations
Chapter 5. Docking station Market: Product Estimates & Trend Analysis
- 5.1. Product Movement Analysis & Market Share, 2021 & 2030
- 5.2. Laptop
- 5.2.1. Laptop Market estimates and forecast, 2017 - 2030 (USD Million)
- 5.3. Smartphones & Tablets
- 5.3.1. Smartphones Market estimates and forecast, 2017 - 2030 (USD Million)
- 5.4. Others
- 5.4.1. Others Market estimates and forecast, 2017 - 2030 (USD Million)
Chapter 6. Docking Station Market: Connectivity Estimates and Trend Analysis
- 6.1. Connectivity movement analysis & market share, 2021 & 2030
- 6.2. Wired
- 6.2.1. Wired docking station market estimates and forecast, 2017 - 2030 (USD Million)
- 6.3. Wireless
- 6.3.1. Wireless docking station market estimates and forecast, 2017 - 2030 (USD Million)
Chapter 7. Docking station Market: Distribution Channel Estimates & Trend Analysis
- 7.1. Distribution Channel Movement Analysis & Market Share, 2021 & 2030
- 7.2. Online
- 7.2.1. Market estimates and forecast through online distribution channel of docking station, 2017 - 2030 (USD Million)
- 7.3. Offline
- 7.3.1. Market estimates and forecast through offline distribution channel of docking station, 2017 - 2030 (USD Million)
Chapter 8. Docking station Market: Regional Estimates & Trend Analysis
- 8.1. Regional Movement Analysis & Market Share, 2021 & 2030
- 8.2. North America
- 8.2.1. Market estimates and forecast, 2017 - 2030 (USD Million)
- 8.2.2. Market estimates and forecast, by product, 2017 - 2030 (USD Million)
- 8.2.3. Market estimates and forecast, by connectivity, 2017 - 2030 (USD Million)
- 8.2.4. Market estimates and forecast by distribution channel, 2017 - 2030 (USD Million)
- 8.2.5. U.S.
- 8.2.5.1. Market estimates and forecast, 2017 - 2030 (USD Million)
- 8.2.5.2. Market estimates and forecast, by product, 2017 - 2030 (USD Million)
- 8.2.5.3. Market estimates and forecast, by connectivity, 2017 - 2030 (USD Million)
- 8.2.5.4. Market estimates and forecast by distribution channel, 2017 - 2030 (USD Million)
- 8.3. Europe
- 8.3.1. Market estimates and forecast, 2017 - 2030 (USD Million)
- 8.3.2. Market estimates and forecast, by product, 2017 - 2030 (USD Million)
- 8.3.3. Market estimates and forecast, by connectivity, 2017 - 2030 (USD Million)
- 8.3.4. Market estimates and forecast by distribution channel, 2017 - 2030 (USD Million)
- 8.3.5. Germany
- 8.3.5.1. Market estimates and forecast, 2017 - 2030 (USD Million)
- 8.3.5.2. Market estimates and forecast, by product, 2017 - 2030 (USD Million)
- 8.3.5.3. Market estimates and forecast, by connectivity, 2017 - 2030 (USD Million)
- 8.3.5.4. Market estimates and forecast by distribution channel, 2017 - 2030 (USD Million)
- 8.3.6. U.K.
- 8.3.6.1. Market estimates and forecast, 2017 - 2030 (USD Million)
- 8.3.6.2. Market estimates and forecast, by product, 2017 - 2030 (USD Million)
- 8.3.6.3. Market estimates and forecast, by connectivity, 2017 - 2030 (USD Million)
- 8.3.6.4. Market estimates and forecast by distribution channel, 2017 - 2030 (USD Million)
- 8.4. Asia Pacific
- 8.4.1. Market estimates and forecast, 2017 - 2030 (USD Million)
- 8.4.2. Market estimates and forecast, by product, 2017 - 2030 (USD Million)
- 8.4.3. Market estimates and forecast, by connectivity, 2017 - 2030 (USD Million)
- 8.4.4. Market estimates and forecast by distribution channel, 2017 - 2030 (USD Million)
- 8.4.5. China
- 8.4.5.1. Market estimates and forecast, 2017 - 2030 (USD Million)
- 8.4.5.2. Market estimates and forecast, by product, 2017 - 2030 (USD Million)
- 8.4.5.3. Market estimates and forecast, by connectivity, 2017 - 2030 (USD Million)
- 8.4.5.4. Market estimates and forecast by distribution channel, 2017 - 2030 (USD Million)
- 8.4.6. India
- 8.4.6.1. Market estimates and forecast, 2017 - 2030 (USD Million)
- 8.4.6.2. Market estimates and forecast, by product, 2017 - 2030 (USD Million)
- 8.4.6.3. Market estimates and forecast, by connectivity, 2017 - 2030 (USD Million)
- 8.4.6.4. Market estimates and forecast by distribution channel, 2017 - 2030 (USD Million)
- 8.5. Central and South America
- 8.5.1. Market estimates and forecast, 2017 - 2030 (USD Million)
- 8.5.2. Market estimates and forecast, by product, 2017 - 2030 (USD Million)
- 8.5.3. Market estimates and forecast, by connectivity, 2017 - 2030 (USD Million)
- 8.5.4. Market estimates and forecast by distribution channel, 2017 - 2030 (USD Million)
- 8.5.5. Brazil
- 8.5.5.1. Market estimates and forecast, 2017 - 2030 (USD Million)
- 8.5.5.2. Market estimates and forecast, by product, 2017 - 2030 (USD Million)
- 8.5.5.3. Market estimates and forecast, by connectivity, 2017 - 2030 (USD Million)
- 8.5.5.4. Market estimates and forecast by distribution channel, 2017 - 2030 (USD Million)
- 8.6. Middle East and Africa
- 8.6.1. Market estimates and forecast, 2017 - 2030 (USD Million)
- 8.6.2. Market estimates and forecast, by product, 2017 - 2030 (USD Million)
- 8.6.3. Market estimates and forecast, by connectivity, 2017 - 2030 (USD Million)
- 8.6.4. Market estimates and forecast by distribution channel, 2017 - 2030 (USD Million)
- 8.6.5. Saudi Arabia
- 8.6.5.1. Market estimates and forecast, 2017 - 2030 (USD Million)
- 8.6.5.2. Market estimates and forecast, by product, 2017 - 2030 (USD Million)
- 8.6.5.3. Market estimates and forecast, by connectivity, 2017 - 2030 (USD Million)
- 8.6.5.4. Market estimates and forecast by distribution channel, 2017 - 2030 (USD Million)
Chapter 9. Competitive Analysis
- 9.1. Key global players, recent developments & their impact on the industry
- 9.2. Key Company/Competition Categorization (Key innovators, Market leaders, Emerging players)
- 9.3. Vendor Landscape
- 9.3.1. Key company market share analysis, 2021
Chapter 10. Company Profiles
- 10.1. Targus
- 10.1.1. Company Overview
- 10.1.2. Financial Performance
- 10.1.3. Product Benchmarking
- 10.1.4. Strategic Initiatives
- 10.2. StarTech.com
- 10.2.1. Company Overview
- 10.2.2. Financial Performance
- 10.2.3. Product Benchmarking
- 10.2.4. Strategic Initiatives
- 10.3. Dell Technologies Inc.
- 10.3.1. Company Overview
- 10.3.2. Financial Performance
- 10.3.3. Product Benchmarking
- 10.3.4. Strategic Initiatives
- 10.4. ACCO Brand Corporation
- 10.4.1. Company Overview
- 10.4.2. Financial Performance
- 10.4.3. Product Benchmarking
- 10.4.4. Strategic Initiatives
- 10.5. HP Development Company L.P
- 10.5.1. Company Overview
- 10.5.2. Financial Performance
- 10.5.3. Product Benchmarking
- 10.5.4. Strategic Initiatives
- 10.6. Lenevo Group Limited
- 10.6.1. Company Overview
- 10.6.2. Financial Performance
- 10.6.3. Product Benchmarking
- 10.6.4. Strategic Initiatives
- 10.7. Plugable Technologies
- 10.7.1. Company Overview
- 10.7.2. Financial Performance
- 10.7.3. Product Benchmarking
- 10.7.4. Strategic Initiatives
- 10.8. Toshiba Corporation
- 10.8.1. Company Overview
- 10.8.2. Financial Performance
- 10.8.3. Product Benchmarking
- 10.8.4. Strategic Initiatives
- 10.9. Acer Inc.
- 10.9.1. Company Overview
- 10.9.2. Financial Performance
- 10.9.3. Product Benchmarking
- 10.9.4. Strategic Initiatives
- 10.10. Samsung Electronics Co., Ltd.
- 10.10.1. Company Overview
- 10.10.2. Financial Performance
- 10.10.3. Product Benchmarking
- 10.10.4. Strategic Initiatives