|
|
市場調査レポート
商品コード
1076665
デジタルペン市場規模・シェア・動向分析レポート製品別(スキャン、手書き)、用途別(PC、タブレット、スマートフォン)、アプリケーション別、地域別、セグメント別予測、2022年~2030年Digital Pen Market Size, Share & Trends Analysis Report By Product (Scanning, Handwriting), By Usage (PC, Tablet, Smartphone), By Application, By Region, And Segment Forecasts, 2022 - 2030 |
||||||
|
|
|||||||
|
● お客様のご希望に応じて、既存データの加工や未掲載情報(例:国別セグメント)の追加などの対応が可能です。 詳細はお問い合わせください。 |
|||||||


| デジタルペン市場規模・シェア・動向分析レポート製品別(スキャン、手書き)、用途別(PC、タブレット、スマートフォン)、アプリケーション別、地域別、セグメント別予測、2022年~2030年 |
|
出版日: 2022年04月28日
発行: Grand View Research
ページ情報: 英文 80 Pages
納期: 2~10営業日
|
- 全表示
- 概要
- 図表
- 目次
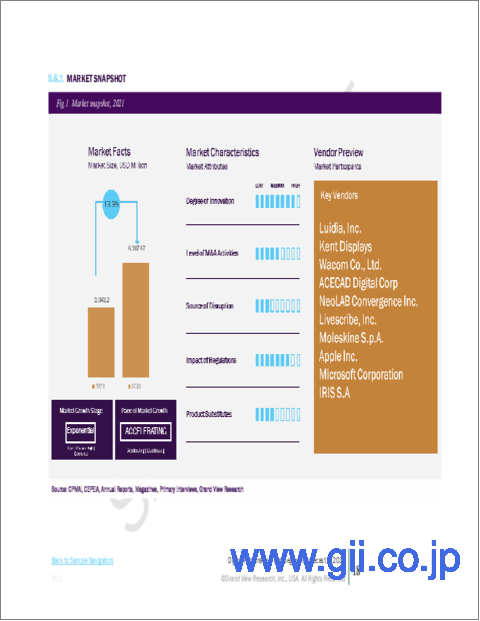
デジタルペン市場の成長と動向
グランドビューリサーチ社の最新レポートによると、デジタルペンの世界市場は、2030年までにCAGR13.3%で62億9000万米ドルに達すると予測されています。
この市場の成長は、インターネット普及率の上昇とスマートデバイスの採用の増加、BYODポリシーの採用の増加が主な要因となっています。さらに、ビジネスプロセスの自動化の高まりも、市場成長の原動力になると予想されます。
デジタルペンは、手書きの文書や図面をデジタル形式で取り込むことができる、バッテリーとスキャンソリューションを備えた筆記用具です。さらに、デジタルペンの中には、光学式文字認識を使って印刷されたテキストをコンピューターアプリケーション上で編集可能なテキストにすることを目的としたハンドヘルドスキャナーを装備しているものも少なくありません。また、スマートペンやデジタルアートペンなどのスマートインフラソリューションの商業・製造分野での利用が増加していることも、デジタルペン市場を牽引すると予想されます。
コロナウイルスの大流行は、世界中の教育システムに消えない傷跡を残しました。遠隔地へのパラダイムシフトにより、国中のデバイスやブロードバンドインターネットへのアクセスが加速しています。日本のデバイスメーカーであるワコムは、同社のデジタルペンタブレットがGoogle OSとChromebookに完全対応したことを発表しました。パンデミックの間、教育業界におけるデジタル変革の2大潮流は、遠隔教育の拡大と教育技術革新の台頭でした。
デジタルペンと紙のシステムの統合は、これらの制約を克服しなければならない新しい技術です。臨床文書作成のための新しい技術が次々と登場しています。その中には、バーコードシステム、音声認識システム、ペンベースシステム、スキャン技術などが含まれます。文書化とデータ入力のための既存の技術には、長年にわたって問題があることが証明されています。
米国国立医学図書館生物工学情報センターによると、新技術を評価するためにユーザビリティテストが行われ、病院の看護師向けにデジタルペンと紙のシステムが統合されることになりました。調査研究の結果、文書やデータ入力のための既存の技術には問題があるため、コンピューターとのやりとりのほとんどはキーボードとマウスを使用する必要があり、ベッドサイドの看護には不向きであるとの結論に達しました。その結果、臨床文書作成において、デジタルペンの需要が従来のペンと紙の需要を上回っています。このような要因が、手書き用デジタルペン市場の最終的な成長にプラスの影響を及ぼしています。
北米は、この地域の市民が技術に精通しており、米国とカナダのスマートデバイスの採用が他の国々と比較して高いため、市場で最大の市場シェアを占めています。欧州は、ドイツや英国をはじめ、自動車や電子産業において急速な技術革新が進んでいることから、デジタルペン市場において第2位のシェアを獲得しています。
例えば、米国やドイツでは、警察官やその他の当局が情報収集や犯罪報告の作成にこれらのペンを使用しています。デバイスに情報を記録してコンピューターに転送したり、さまざまな接続技術で情報を共有することで時間を節約できるためです。アジア太平洋地域は、企業が時間だけでなく労力を節約するためにデジタル技術ツールに大きく投資していることから、最も急速に成長している市場になると予想されます。中東・アフリカと中南米のデジタルペン市場はまだ初期段階にありますが、予測期間中に大きな成長を見せると予想されます。しかし、さまざまな低開発国での技術的な準備不足が、この市場の成長を制限する可能性があります。
デジタルペン市場のレポートハイライト
- 手書き機能付きデジタルペンは、ミレニアル世代とZ世代における需要の増加により、最も高い市場シェアを獲得すると予測されます。手書き機能付きデジタルペンの中で最も成長が著しいのはスタイラス(Stylus)分野です。
- タブレット端末は、スマートフォンやPCに代わって需要が高まっていることから、2022年から2030年にかけてCAGR13.8%と予測され、予測期間中に高い成長が見込まれます。
- BFSIは、顧客サービス向上のために環境が急速に変化していることから、最も高い成長が見込まれます。また、アナログからデジタルへのデータ移行にかかる労力や時間を削減することができます。
- 北米は最大の市場であり、2020年の世界収益の37.0%以上を占めました。大多数の企業でデジタル技術の普及が進んだ結果、米国やカナダなどの国々でデジタルペンの導入が急速に進んだことが、市場を牽引する重要な要因となっています。
目次
第1章 調査手法と範囲
- 市場セグメンテーションと範囲
- 市場の定義
- 情報調達
- 購入したデータベース
- GVRの内部データベース
- 二次情報と第三者の視点
- 1次調査
- 情報分析
- データ分析モデル
- 市場形成とデータ可視化
- データの検証と公開
第2章 エグゼクティブサマリー
- 市場の見通し
- 製品の見通し
- 利用の見通し
- エンドユーザーの見通し
第3章 デジタルペン市場の変数、動向、範囲
- 市場イントロダクション
- 浸透と成長の見通しのマッピング
- COVID-19のデジタルペン市場への影響
- 業界バリューチェーン分析
- 販売・小売チャネル分析
- 利益率分析
- 市場力学
- 市場促進要因分析
- 市場制約分析
- 業界の課題
- 業界の機会
- 事業環境分析
- 業界分析- ポーターのファイブフォース分析
- サプライヤーの力
- 買い手の交渉力
- 代替の脅威
- 新規参入者からの脅威
- 競争企業間の敵対関係
- 業界分析- ポーターのファイブフォース分析
- デジタルペン市場のロードマップ
- 市場参入戦略
第4章 消費者行動分析
- 人口統計分析
- 消費者の動向と好み
- 購入決定に影響を与える要因
- 消費者製品の採用
- 所見と推奨事項
第5章 デジタルペン市場:製品推定・動向分析
- 製品変動分析と市場シェア、2021年と2030年
- スキャンペン
- 手書きペン
第6章 デジタルペン市場:使用推定・動向分析
- 使用変動分析と市場シェア、2021年と2030年
- パソコン
- タブレット
- スマートフォン
第7章 デジタルペン市場:エンドユーザーの推定・動向分析
- エンドユーザーの変動分析と市場シェア、2021年と2030年
- BFSI
- ヘルスケア
- 政府
- メディアとエンターテイメント
- 小売
- その他
第8章 デジタルペン市場:地域推定・動向分析
- 地域別変動分析と市場シェア、2021年と2030年
- 北米
- 米国
- 欧州
- 英国
- ドイツ
- アジア太平洋地域
- 中国
- 日本
- インド
- 中南米
- ブラジル
- 中東とアフリカ
第9章 競合分析
- 主要な世界プレーヤー、最近の動向、業界への影響
- 主要企業/競合の分類(主要なイノベーター、市場リーダー、新興企業)
- ベンダー情勢
- 主要企業の市場シェア分析、2021年
第10章 企業プロファイル
- IRIS SA
- 会社概要
- 財務実績
- 製品のベンチマーク
- 戦略的イニシアチブ
- Lucidia Inc.
- 会社概要
- 財務実績
- 製品のベンチマーク
- 戦略的イニシアチブ
- Kent Displays
- 会社概要
- 財務実績
- 製品のベンチマーク
- 戦略的イニシアチブ
- Wacom Co. Ltd.
- 会社概要
- 財務実績
- 製品のベンチマーク
- 戦略的イニシアチブ
- ACECAD Digital Corp.
- 会社概要
- 財務実績
- 製品のベンチマーク
- 戦略的イニシアチブ
- NeoLAB Convergence Lab
- 会社概要
- 財務実績
- 製品のベンチマーク
- 戦略的イニシアチブ
- Livescribe Inc.
- 会社概要
- 財務実績
- 製品のベンチマーク
- 戦略的イニシアチブ
- Moleskine SpA
- 会社概要
- 財務実績
- 製品のベンチマーク
- 戦略的イニシアチブ
- Apple Inc.
- 会社概要
- 財務実績
- 製品のベンチマーク
- 戦略的イニシアチブ
- Microsoft Inc.
- 会社概要
- 財務実績
- 製品のベンチマーク
- 戦略的イニシアチブ
List of Tables
- 1. Digital pen market - Key market driver analysis
- 2. Digital pen market - Key market restraint analysis
- 3. Handwriting digital pen market estimates and forecast, 2017 - 2030 (USD Million)
- 4. Scanning digital pen market estimates and forecast, 2017 - 2030 (USD Million)
- 5. Digital pen market estimates and forecast through PC, 2017 - 2030 (USD Million)
- 6. Digital pen market estimates and forecast through tablet, 2017 - 2030 (USD Million)
- 7. Digital pen market estimates and forecast through smartphones, 2017 - 2030 (USD Million)
- 8. Digital pen market estimates and forecast through BFSI, 2017 - 2030 (USD Million)
- 9. Digital pen market estimates and forecast through healthcare, 2017 - 2030 (USD Million)
- 10. Digital pen market estimates and forecast through government, 2017 - 2030 (USD Million)
- 11. Digital pen market estimates and forecast through media & entertainment, 2017 - 2030 (USD Million)
- 12. Digital pen market estimates and forecast through education, 2017 - 2030 (USD Million)
- 13. Digital pen market estimates and forecast through retail, 2017 - 2030 (USD Million)
- 14. Digital pen market estimates and forecast through others, 2017 - 2030 (USD Million)
- 15. North America digital pen market estimates and forecast, 2017 - 2030 (USD Million)
- 16. North America digital pen market revenue estimates and forecast by product, 2017 - 2030 (USD Million)
- 17. North America digital pen market revenue estimates and forecast by usage, 2017 - 2030 (USD Million)
- 18. North America digital pen market revenue estimates and forecast by end-users, 2017 - 2030 (USD Million)
- 19. U.S. digital pen market estimates and forecast, 2017 - 2030 (USD Million)
- 20. U.S. digital pen market revenue estimates and forecast by product, 2017 - 2030 (USD Million)
- 21. U.S. digital pen market revenue estimates and forecast by usage, 2017 - 2030 (USD Million)
- 22. U.S. digital pen market revenue estimates and forecast by end-users, 2017 - 2030 (USD Million)
- 23. Europe digital pen market estimates and forecast, 2017 - 2030 (USD Million)
- 24. Europe digital pen market revenue estimates and forecast by product, 2017 - 2030 (USD Million)
- 25. Europe digital pen market revenue estimates and forecast by usage, 2017 - 2030 (USD Million)
- 26. Europe digital pen market revenue estimates and forecast by end-users, 2017 - 2030 (USD Million)
- 27. U.K. digital pen market estimates and forecast, 2017 - 2030 (USD Million)
- 28. U.K. digital pen market revenue estimates and forecast by product, 2017 - 2030 (USD Million)
- 29. U.K. digital pen market revenue estimates and forecast by usage, 2017 - 2030 (USD Million)
- 30. U.K. digital pen market revenue estimates and forecast by end-users, 2017 - 2030 (USD Million)
- 31. Germany digital pen market estimates and forecast, 2017 - 2030 (USD Million)
- 32. Germany digital pen market revenue estimates and forecast by product, 2017 - 2030 (USD Million)
- 33. Germany digital pen market revenue estimates and forecast by usage, 2017 - 2030 (USD Million)
- 34. Germany digital pen market revenue estimates and forecast by end-users, 2017 - 2030 (USD Million)
- 35. Asia Pacific digital pen market estimates and forecast, 2017 - 2030 (USD Million)
- 36. Asia Pacific digital pen market revenue estimates and forecast by product, 2017 - 2030 (USD Million)
- 37. Asia Pacific digital pen market revenue estimates and forecast by usage, 2017 - 2030 (USD Million)
- 38. Asia Pacific digital pen market revenue estimates and forecast by end-users, 2017 - 2030 (USD Million)
- 39. China digital pen market estimates and forecast, 2017 - 2030 (USD Million)
- 40. China digital pen market revenue estimates and forecast by product, 2017 - 2030 (USD Million)
- 41. China digital pen market revenue estimates and forecast by usage, 2017 - 2030 (USD Million)
- 42. China digital pen market revenue estimates and forecast by end-users, 2017 - 2030 (USD Million)
- 43. Japan digital pen market estimates and forecast, 2017 - 2030 (USD Million)
- 44. Japan digital pen market revenue estimates and forecast by product, 2017 - 2030 (USD Million)
- 45. Japan digital pen market revenue estimates and forecast by usage, 2017 - 2030 (USD Million)
- 46. Japan digital pen market revenue estimates and forecast by end-users, 2017 - 2030 (USD Million)
- 47. India digital pen market estimates and forecast, 2017 - 2030 (USD Million)
- 48. India digital pen market revenue estimates and forecast by product, 2017 - 2030 (USD Million)
- 49. India digital pen market revenue estimates and forecast by usage, 2017 - 2030 (USD Million)
- 50. India digital pen market revenue estimates and forecast by end-users, 2017 - 2030 (USD Million)
- 51. Central and South America digital pen market estimates and forecast, 2017 - 2030 (USD Million)
- 52. Central and South America digital pen market revenue estimates and forecast by product, 2017 - 2030 (USD Million)
- 53. Central and South America digital pen market revenue estimates and forecast by usage, 2017 - 2030 (USD Million)
- 54. Central and South America digital pen market revenue estimates and forecast by end-users, 2017 - 2030 (USD Million)
- 55. Brazil digital pen market estimates and forecast, 2017 - 2030 (USD Million)
- 56. Brazil digital pen market revenue estimates and forecast by product, 2017 - 2030 (USD Million)
- 57. Brazil digital pen market revenue estimates and forecast by usage, 2017 - 2030 (USD Million)
- 58. Brazil digital pen market revenue estimates and forecast by end-users, 2017 - 2030 (USD Million)
- 59. Middle East and Africa digital pen market estimates and forecast, 2017 - 2030 (USD Million)
- 60. Middle East and Africa digital pen revenue estimates and forecast by product, 2017 - 2030 (USD Million)
- 61. Middle East and Africa digital pen market revenue estimates and forecast by usage, 2017 - 2030 (USD Million)
- 62. Middle East and Africa digital pen market revenue estimates and forecast by end-users, 2017 - 2030 (USD Million)
- 63. Company categorization
List of Figures
- 1. Digital pen market segmentation & scope
- 2. Information procurement
- 3. Primary research pattern
- 4. Primary research approaches
- 5. Primary research process
- 6. Digital pen market - Penetration & growth prospect mapping
- 7. Digital pen market - Value chain analysis
- 8. Digital pen market: Porter's Five Forces Analysis
- 9. Digital pen market: Roadmap
- 10. Factors affecting the buying decision for digital pen market
- 11. Digital pen market: Product content (%) analysis, 2021 & 2030
- 12. Digital pen market: Usage content (%) analysis, 2021 & 2030
- 13. Digital pen market: End-users share (%) analysis, 2021 & 2030
- 14. Digital pen market: Regional share (%) analysis, 2021 & 2030
Digital Pen Market Growth & Trends:
The global digital pen market is expected to reach USD 6.29 billion by 2030, at a CAGR of 13.3% according to a new report by Grand View Research, Inc. The growth of the market is majorly driven by the growth in internet penetration and the rise in the adoption of smart devices coupled with an increase in the adoption of BYOD policy. Furthermore, a rise in the adoption of business process automation is anticipated to drive market growth.
The digital pen is a writing application equipped with a battery and scanning solution that allows users to capture handwritten documents and drawing in digital form. Further, few digital pens are equipped with handheld scanners that are intended to use optical character recognition to turn printed text into editable text on computer applications. In addition, the rise in the utilization of smart infrastructure solutions such as smart pens and digital art pens across commercial and manufacturing sectors is anticipated to drive the digital pen market.
The coronavirus pandemic has left an indelible mark on education systems all over the world. The paradigm shift to remote countries has accelerated access to devices and broadband internet across the country. Wacom, a Japanese device manufacturer, announced that its digital pen tablet is now fully compatible with Google OS and Chromebooks. During the pandemic, the two most recent trends in digital transformation in the education industry have been the expansion of distance education and the rise of educational technology innovations.
The integration of a digital pen and paper system is a new technology that must overcome these constraints. A slew of new technologies for clinical documentation has emerged. These include barcode systems, speech recognition systems, pen-based systems, as well as scanning technology. Existing technology for documentation and data entry has proven to be problematic over the years.
According to the National Center for Biotechnology Information, U.S. National Library of Medicine, usability testing was conducted to evaluate the new technology, and a digital pen and paper system would be integrated for hospital nurses. The research study concluded that because existing technologies for documentation and data entry are problematic, most computer interactions require the use of a keyboard and mouse, which are unsuitable for bedside nursing. As a result, the demand for digital pens outnumbers the demand for traditional pens and paper in clinical documentation. Such factors have a positive impact on the ultimate growth of the handwriting digital pen market.
North America accounts for the largest market share in the market as the citizens in this region are tech-savvy, and the adoption of smart devices in the US and Canada is high as compared to other countries. Europe holds the second largest market share in the digital pen market as the countries in this region including Germany and the UK are making rapid innovations in automotive and electronic industries.
For instance, in US and Germany, the police officers and other authorities use these pens to generate intelligence and crime reports, as it saves time by recording information on a device and transferring it to a computer or sharing it through various connecting technologies. Asia-Pacific is expected to be the fastest-growing market as companies are largely investing in digital technology tools to save effort as well as time. The digital pen market in the Middle East and Africa, and Central and South America are in a nascent stage but are expected to show significant growth during the forecast period. However, a lack of technology readiness across various underdeveloped nations may limit the growth of this market.
Digital Pen Market Report Highlights:
- Digital pen with handwriting ability is projected to register the highest market share owing to the increasing demand among millennials and Gen Z. Under handwriting digital pens, the fastest growing sector is Stylus.
- Tablet is anticipated to register faster growth during the forecast years with a CAGR of 13.8% from 2022 to 2030 due to rising demand for it instead of smartphones and PCs.
- The BFSI sector is expected to witness the fastest growth owing to the rapidly changing environment of the sector to improve customer services. Furthermore, it helps in reducing the labor and time consumed in the process of moving the data from analog to digital versions.
- North America was the largest market, accounting for more than 37.0% share of the global revenue in 2020. The rapid adoption of the digital pen in countries such as the U.S. and Canada as a result of increased diffusion of digital technologies in the majority of businesses is a key factor driving the market.
Table of Contents
Chapter 1. Methodology and Scope
- 1.1. Market Segmentation & Scope
- 1.2. Market Definition
- 1.3. Information Procurement
- 1.3.1. Purchased Database
- 1.3.2. GVR's Internal Database
- 1.3.3. Secondary Sources & Third-Party Perspectives
- 1.3.4. Primary Research
- 1.4. Information Analysis
- 1.4.1. Data Analysis Models
- 1.5. Market Formulation & Data Visualization
- 1.6. Data Validation & Publishing
Chapter 2. Executive Summary
- 2.1. Market Outlook
- 2.2. Product Outlook
- 2.3. Usage Outlook
- 2.4. End users Outlook
Chapter 3. Digital Pen Market Variables, Trends & Scope
- 3.1. Market Introduction
- 3.2. Penetration & Growth Prospect Mapping
- 3.3. Impact of COVID-19 on the Digital Pen Market
- 3.4. Industry Value Chain Analysis
- 3.4.1. Sales/Retail Channel Analysis
- 3.4.2. Profit Margin Analysis
- 3.5. Market Dynamics
- 3.5.1. Market Driver Analysis
- 3.5.2. Market Restraint Analysis
- 3.5.3. Industry Challenges
- 3.5.4. Industry Opportunities
- 3.6. Business Environment Analysis
- 3.6.1. Industry Analysis - Porter's Five Forces Analysis
- 3.6.1.1. Supplier Power
- 3.6.1.2. Buyer Power
- 3.6.1.3. Substitution Threat
- 3.6.1.4. Threat from New Entrant
- 3.6.1.5. Competitive Rivalry
- 3.6.1. Industry Analysis - Porter's Five Forces Analysis
- 3.7. Roadmap of Digital Pen Market
- 3.8. Market Entry Strategies
Chapter 4. Consumer Behavior Analysis
- 4.1. Demographic Analysis
- 4.2. Consumer Trends and Preferences
- 4.3. Factors Affecting Buying Decision
- 4.4. Consumer Product Adoption
- 4.5. Observations & Recommendations
Chapter 5. Digital Pen Market: Product Estimates & Trend Analysis
- 5.1. Product Movement Analysis & Market Share, 2021 & 2030
- 5.2. Scanning Pen
- 5.2.1. Market estimates and forecast for scanning pen content 2017 - 2030 (USD Million)
- 5.3. Handwriting Pen
- 5.3.1. Market estimates and forecast for handwriting pen ABV content 2017 - 2030 (USD Million)
Chapter 6. Digital Pen Market: Usage Estimates & Trend Analysis
- 6.1. Usage Movement Analysis & Market Share, 2021 & 2030
- 6.2. PC
- 6.2.1. Market estimates and forecast for digital pen usage on PC, 2017 - 2030 (USD Million)
- 6.3. Tablet
- 6.3.1. Market estimates and forecast for digital pen usage on tablet 2017 - 2030 (USD Million)
- 6.4. Smartphone
- 6.4.1. Market estimates and forecast for digital pen usage on smartphone 2017 - 2030 (USD Million)
Chapter 7. Digital Pen Market: End-users Estimates & Trend Analysis
- 7.1. End users Movement Analysis & Market Share, 2021 & 2030
- 7.2. BFSI
- 7.2.1. Market estimates and forecast through BFSI, 2017 - 2030 (USD Million)
- 7.3. Healthcare
- 7.3.1. Market estimates and forecast through healthcare, 2017 - 2030 (USD Million)
- 7.4. Government
- 7.4.1. Market estimates and forecast through healthcare, 2017 - 2030 (USD Million)
- 7.5. Media and Entertainment
- 7.5.1. Market estimates and forecast through media and entertainment, 2017 - 2030 (USD Million)
- 7.6. Retail
- 7.6.1. Market estimates and forecast through retail, 2017 - 2030 (USD Million)
- 7.7. Others
- 7.7.1. Market estimates and forecast through others, 2017 - 2030 (USD Million)
Chapter 8. Digital Pen Market: Regional Estimates & Trend Analysis
- 8.1. Regional Movement Analysis & Market Share, 2021 & 2030
- 8.2. North America
- 8.2.1. Market estimates and forecast, 2017 - 2030 (USD Million)
- 8.2.2. Market estimates and forecast, by product, 2017 - 2030 (USD Million)
- 8.2.3. Market estimates and forecast, by usage, 2017 - 2030 (USD Million)
- 8.2.4. Market estimates and forecast, by end-users, 2017 - 2030 (USD Million)
- 8.2.5. U.S.
- 8.2.5.1. Market estimates and forecast, 2017 - 2030 (USD Million)
- 8.2.5.2. Market estimates and forecast, by product, 2017 - 2030 (USD Million)
- 8.2.5.3. Market estimates and forecast, by usage, 2017 - 2030 (USD Million)
- 8.2.5.4. Market estimates and forecast, by end-users, 2017 - 2030 (USD Million)
- 8.3. Europe
- 8.3.1. Market estimates and forecast, 2017 - 2030 (USD Million)
- 8.3.2. Market estimates and forecast, by product, 2017 - 2030 (USD Million)
- 8.3.3. Market estimates and forecast, by usage, 2017 - 2030 (USD Million)
- 8.3.4. Market estimates and forecast, by end-users, 2017 - 2030 (USD Million)
- 8.3.5. U.K.
- 8.3.5.1. Market estimates and forecast, 2017 - 2030 (USD Million)
- 8.3.5.2. Market estimates and forecast, by product, 2017 - 2030 (USD Million)
- 8.3.5.3. Market estimates and forecast, by usage, 2017 - 2030 (USD Million)
- 8.3.5.4. Market estimates and forecast, by end-users, 2017 - 2030 (USD Million)
- 8.3.6. Germany
- 8.3.6.1. Market estimates and forecast, 2017 - 2030 (USD Million)
- 8.3.6.2. Market estimates and forecast, by product, 2017 - 2030 (USD Million)
- 8.3.6.3. Market estimates and forecast, by usage, 2017 - 2030 (USD Million)
- 8.3.6.4. Market estimates and forecast, by end-users, 2017 - 2030 (USD Million)
- 8.4. Asia Pacific
- 8.4.1. Market estimates and forecast, 2017 - 2030 (USD Million)
- 8.4.2. Market estimates and forecast, by product, 2017 - 2030 (USD Million)
- 8.4.3. Market estimates and forecast, by usage, 2017 - 2030 (USD Million)
- 8.4.4. Market estimates and forecast, by end-users, 2017 - 2030 (USD Million)
- 8.4.5. China
- 8.4.5.1. Market estimates and forecast, 2017 - 2030 (USD Million)
- 8.4.5.2. Market estimates and forecast, by product, 2017 - 2030 (USD Million)
- 8.4.5.3. Market estimates and forecast, by usage, 2017 - 2030 (USD Million)
- 8.4.5.4. Market estimates and forecast, by end-users, 2017 - 2030 (USD Million)
- 8.4.6. Japan
- 8.4.6.1. Market estimates and forecast, 2017 - 2030 (USD Million)
- 8.4.6.2. Market estimates and forecast, by product, 2017 - 2030 (USD Million)
- 8.4.6.3. Market estimates and forecast, by usage, 2017 - 2030 (USD Million)
- 8.4.6.4. Market estimates and forecast, by end-users, 2017 - 2030 (USD Million)
- 8.4.7. India
- 8.4.7.1. Market estimates and forecast, 2017 - 2030 (USD Million)
- 8.4.7.2. Market estimates and forecast, by product, 2017 - 2030 (USD Million)
- 8.4.7.3. Market estimates and forecast, by usage, 2017 - 2030 (USD Million)
- 8.4.7.4. Market estimates and forecast, by end-users, 2017 - 2030 (USD Million)
- 8.5. Central and South America
- 8.5.1. Market estimates and forecast, 2017 - 2030 (USD Million)
- 8.5.2. Market estimates and forecast, by product, 2017 - 2030 (USD Million)
- 8.5.3. Market estimates and forecast, by usage, 2017 - 2030 (USD Million)
- 8.5.4. Market estimates and forecast, by end-users, 2017 - 2030 (USD Million)
- 8.5.5. Brazil
- 8.5.5.1. Market estimates and forecast, 2017 - 2030 (USD Million)
- 8.5.5.2. Market estimates and forecast, by product, 2017 - 2030 (USD Million)
- 8.5.5.3. Market estimates and forecast, by usage, 2017 - 2030 (USD Million)
- 8.5.5.4. Market estimates and forecast, by end-users, 2017 - 2030 (USD Million)
- 8.6. Middle East and Africa
- 8.6.1. Market estimates and forecast, 2017 - 2030 (USD Million)
- 8.6.2. Market estimates and forecast, by product, 2017 - 2030 (USD Million)
- 8.6.3. Market estimates and forecast, by usage, 2017 - 2030 (USD Million)
- 8.6.4. Market estimates and forecast, by end-users, 2017 - 2030 (USD Million)
Chapter 9. Competitive Analysis
- 9.1. Key global players, recent developments & their impact on the industry
- 9.2. Key Company/Competition Categorization (Key innovators, Market leaders, Emerging players)
- 9.3. Vendor Landscape
- 9.3.1. Key company market share analysis, 2021
Chapter 10. Company Profiles
- 10.1. IRIS S.A.
- 10.1.1. Company Overview
- 10.1.2. Financial Performance
- 10.1.3. Product Benchmarking
- 10.1.4. Strategic Initiatives
- 10.2. Lucidia Inc.
- 10.2.1. Company Overview
- 10.2.2. Financial Performance
- 10.2.3. Product Benchmarking
- 10.2.4. Strategic Initiatives
- 10.3. Kent Displays
- 10.3.1. Company Overview
- 10.3.2. Financial Performance
- 10.3.3. Product Benchmarking
- 10.3.4. Strategic Initiatives
- 10.4. Wacom Co. Ltd.
- 10.4.1. Company Overview
- 10.4.2. Financial Performance
- 10.4.3. Product Benchmarking
- 10.4.4. Strategic Initiatives
- 10.5. ACECAD Digital Corp.
- 10.5.1. Company Overview
- 10.5.2. Financial Performance
- 10.5.3. Product Benchmarking
- 10.5.4. Strategic Initiatives
- 10.6. NeoLAB Convergence Lab
- 10.6.1. Company Overview
- 10.6.2. Financial Performance
- 10.6.3. Product Benchmarking
- 10.6.4. Strategic Initiatives
- 10.7. Livescribe Inc.
- 10.7.1. Company Overview
- 10.7.2. Financial Performance
- 10.7.3. Product Benchmarking
- 10.7.4. Strategic Initiatives
- 10.8. Moleskine S.p.A
- 10.8.1. Company Overview
- 10.8.2. Financial Performance
- 10.8.3. Product Benchmarking
- 10.8.4. Strategic Initiatives
- 10.9. Apple Inc.
- 10.9.1. Company Overview
- 10.9.2. Financial Performance
- 10.9.3. Product Benchmarking
- 10.9.4. Strategic Initiatives
- 10.10. Microsoft Inc.
- 10.10.1. Company Overview
- 10.10.2. Financial Performance
- 10.10.3. Product Benchmarking
- 10.10.4. Strategic Initiatives