|
|
市場調査レポート
商品コード
1631167
Eバイクの市場規模、シェア、動向分析レポート:駆動方式別、バッテリー別、最終用途別、地域別、セグメント予測、2025年~2030年E-Bike Market Size, Share, & Trends Analysis Report By Drive (Chain Drive, Belt Drive), By Battery (Lead-acid Battery, Lithium-ion Battery), By End-use (Personal, Commercial), By Region, And Segment Forecasts, 2025 - 2030 |
||||||

|
|||||||
カスタマイズ可能
|
|||||||

| Eバイクの市場規模、シェア、動向分析レポート:駆動方式別、バッテリー別、最終用途別、地域別、セグメント予測、2025年~2030年 |
|
出版日: 2024年12月10日
発行: Grand View Research
ページ情報: 英文 130 Pages
納期: 2~10営業日
|

全表示
- 概要
- 図表
- 目次
Eバイク市場の成長と動向:
Grand View Research, Inc.の最新レポートによると、世界のEバイクの市場規模は2025年から2030年にかけてCAGR 10.3%で拡大し、2030年には1,136億4,000万米ドルに達すると推定されます。
Eバイクは環境に優しく柔軟な交通手段と考えられています。交通渋滞を回避し、最小限の労力で高速走行が可能なため、公共交通機関、スクーター、スマートカーの理想的な代替手段です。さらに、ライダーは運動量を増やすことで健康的なライフスタイルを維持できます。こうした要因が世界市場の成長に寄与しています。
道路交通量の増加や都市化の進展に起因する消費者の自動車志向の低下は、世界中の市場に有利な成長機会を提供すると予想されます。さらに、インド、英国、カナダを含む数カ国の政府は、Eバイクに対する消費者の嗜好の高まりを受け、自転車用インフラの開発に注力しています。例えば、2017年、商業用駐輪システムと自転車ラックのメーカーであるBikeep社は、電動自転車充電を提供するスマート自転車ラックソリューションを発表しました。このソリューションは、様々な人気の電動自転車に対応するように設計されています。
同市場の主要企業は、事業運営と製品提供を強化するため、新製品の発売や地理的拡大などの戦略に注力しています。例えば、2020年10月にGiant Manufacturing Co.Ltd.は、フルコンポジットトレイルバイク「Trance X Advanced Pro 29」の発売を発表しました。このバイクは、最新のマエストロリアサスペンションと、ライダーがフレームジオメトリーを変更できるフリップチップ機能を搭載しています。同様に2020年10月、Pedego Electric Bikesはフロリダ州ボカラトンに新店舗をオープンしました。この店舗では、電動自転車のレンタルと販売、関連アクセサリーやサービスを提供しています。
Eバイク市場レポートのハイライト
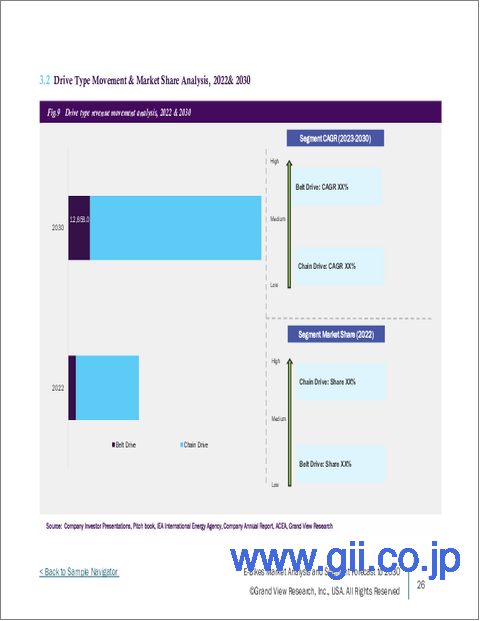
- 駆動方式別では、チェーン駆動分野が2024年に88.90%の最大売上シェアで市場を牽引。Eバイク産業におけるチェーン駆動分野の優位性は、その実証された信頼性、費用対効果、メーカーや消費者に広く親しまれていることに起因します。
- バッテリー別では、リチウムイオンバッテリーセグメントは2024年に82.87%の最大収益シェアで市場をリードし、予測期間中に最も速いCAGRで成長すると予測されています。
- アジア太平洋地域は、自動車充電インフラへの多額の投資とバッテリー駆動車に対する政府の補助金により、予測期間中最大の地域市場になると予想されます。
目次
第1章 調査手法と範囲
第2章 エグゼクティブサマリー
第3章 Eバイク市場の変数と動向
- 親市場の見通し
- 業界バリューチェーン分析
- 原材料および部品サプライヤー
- 電動自転車メーカー
- 販売代理店
- エンドユーザー
- 市場力学
- 市場促進要因の影響分析
- 市場課題の影響分析
- 市場機会の影響分析
- 業界分析ツール
- ポーターの分析
- PESTEL分析
第4章 Eバイク市場:駆動方法別の推定・動向分析
- 駆動方法別の変動分析と市場シェア(2024年・2030年)
- 駆動方法別
- ベルト駆動
- チェーン駆動
第5章 Eバイク市場:バッテリー別の推定・動向分析
- バッテリー別の変動分析と市場シェア(2024年・2030年)
- バッテリー別
- 鉛蓄電池
- リチウムイオン電池
- その他
第6章 Eバイク市場:最終用途別の推定・動向分析
- 最終用途別の変動分析と市場シェア(2024年・2030年)
- 最終用途別
- 個人
- 商業
第7章 Eバイク市場:地域別の推定・動向分析
- Eバイク市場:地域別の展望
- 北米
- 米国
- カナダ
- メキシコ
- 欧州
- 英国
- ドイツ
- フランス
- アジア太平洋
- 中国
- インド
- 日本
- 韓国
- オーストラリア
- ラテンアメリカ
- ブラジル
- 中東・アフリカ
- サウジアラビア王国
- アラブ首長国連邦
- 南アフリカ
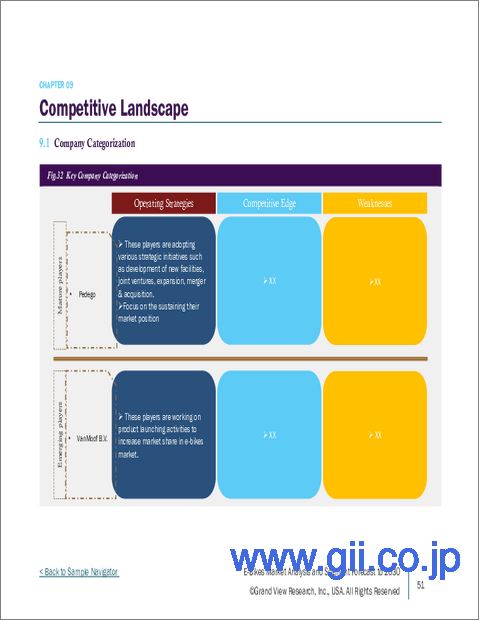
第8章 Eバイク市場:競合情勢
- 企業分類
- Giant Manufacturing Co. Ltd.
- Yadea Group Holdings Ltd.
- Pedego Electric Bikes
- Merida Industry Co. Ltd.
- Trek Bicycle Corporation
- Accell Group N.V.
- Brompton Bicycle Ltd.
- Yamaha Motor Company
- Pon.Bike
- Aima Technology Group Co. Ltd.
- 企業市場シェア分析(2024年)
- 企業の市場ポジショニング
- 企業ヒートマップ分析
List of Tables
- Table 1 Global E-Bike market, by Drive, 2018 - 2030 (USD Million)
- Table 2 Global E-Bike market, by Drive, 2018 - 2030 (Thousand Units)
- Table 3 Global E-Bike market, by Battery, 2018 - 2030 (USD Million)
- Table 4 Global E-Bike market, by Battery, 2018 - 2030 (Thousand Units)
- Table 5 Global E-Bike market, by End Use, 2018 - 2030 (USD Million)
- Table 6 Global E-Bike market, by End Use, 2018 - 2030 (Thousand Units)
List of Figures
- Fig. 1 E-Bike market segmentation
- Fig. 2 Information procurement
- Fig. 3 Data analysis models
- Fig. 4 Market formulation and validation
- Fig. 5 Data validating & publishing
- Fig. 6 Market snapshot
- Fig. 7 Segment snapshot
- Fig. 8 Segment snapshot
- Fig. 9 Competitive landscape snapshot
- Fig. 10 Global telecommunication market vs E-Bike market value, 2023 (USD Million)
- Fig. 11 E-Bike market - Industry value chain analysis
- Fig. 12 E-Bike market dynamics
- Fig. 13 Global 5G connection (in Million)
- Fig. 14 E-Bike market: PORTER's analysis
- Fig. 15 E-Bike market: PESTEL analysis
- Fig. 16 E-Bike market, by Drive : Key takeaways
- Fig. 17 E-Bike market, by Drive : Market share, 2024 & 2030
- Fig. 18 E-Bike market, by belt drive, 2018 - 2030 (USD Million)
- Fig. 19 E-Bike market, by belt drive, 2018 - 2030 (Thousand Units)
- Fig. 20 E-Bike market, by chain drive, 2018 - 2030 (USD Million)
- Fig. 21 E-Bike market, by chain drive, 2018 - 2030 (Thousand Units)
- Fig. 22 E-Bike market, by Battery: Key takeaways
- Fig. 23 E-Bike market, by Battery: Market share, 2024 & 2030
- Fig. 24 E-Bike market, by Lead-acid Battery, 2018 - 2030 (USD Million)
- Fig. 25 E-Bike market, by Lead-acid Battery, 2018 - 2030 (Thousand Units)
- Fig. 26 E-Bike market, by Lithium-ion Battery, 2018 - 2030 (USD Million)
- Fig. 27 E-Bike market, by Lithium-ion Battery, 2018 - 2030 (Thousand Units)
- Fig. 28 E-Bike market, by Others, 2018 - 2030 (USD Million)
- Fig. 29 E-Bike market, by Others, 2018 - 2030 (Thousand Units)
- Fig. 30 E-Bike market, by end use : Key takeaways
- Fig. 31 E-Bike market, by end use : Market share, 2024 & 2030
- Fig. 32 E-Bike market, by personal, 2018 - 2030 (USD Million)
- Fig. 33 E-Bike market, by personal, 2018 - 2030 (Thousand Units)
- Fig. 34 E-Bike market, by commercial, 2018 - 2030 (USD Million)
- Fig. 35 E-Bike market, by commercial, 2018 - 2030 (Thousand Units)
- Fig. 36 E-Bike market revenue, by region, 2024 & 2030 (USD Million)
- Fig. 37 Regional marketplace: Key takeaways
- Fig. 38 Regional marketplace: Key takeaways
- Fig. 39 North America E-Bike market estimates & forecasts, 2018 - 2030 (USD Million, Thousand Units)
- Fig. 40 U.S. E-Bike market estimates & forecasts, 2018 - 2030 (USD Million, Thousand Units)
- Fig. 41 Mexico E-Bike market estimates & forecasts, 2018 - 2030 (USD Million, Thousand Units)
- Fig. 42 Canada E-Bike market estimates & forecasts, 2018 - 2030 (USD Million, Thousand Units)
- Fig. 43 Europe E-Bike market estimates & forecasts, 2018 - 2030 (USD Million, Thousand Units)
- Fig. 44 UK E-Bike market estimates & forecasts, 2018 - 2030 (USD Million, Thousand Units)
- Fig. 45 Germany E-Bike market estimates & forecasts, 2018 - 2030 (USD Million, Thousand Units)
- Fig. 46 France E-Bike market estimates & forecasts, 2018 - 2030 (USD Million, Thousand Units)
- Fig. 47 Asia Pacific E-Bike market estimates & forecasts, 2018 - 2030 (USD Million, Thousand Units)
- Fig. 48 China E-Bike market estimates & forecasts, 2018 - 2030 (USD Million, Thousand Units)
- Fig. 49 India E-Bike market estimates & forecasts, 2018 - 2030 (USD Million, Thousand Units)
- Fig. 50 Japan E-Bike market estimates & forecasts, 2018 - 2030 (USD Million, Thousand Units)
- Fig. 51 South Korea E-Bike market estimates & forecasts, 2018 - 2030 (USD Million, Thousand Units)
- Fig. 52 Australia E-Bike market estimates & forecasts, 2018 - 2030 (USD Million, Thousand Units)
- Fig. 53 Latin America E-Bike market estimates & forecasts, 2018 - 2030 (USD Million, Thousand Units)
- Fig. 54 Brazil E-Bike market estimates & forecasts, 2018 - 2030 (USD Million, Thousand Units)
- Fig. 55 Middle East & Africa E-Bike market estimates & forecasts, 2018 - 2030 (USD Million, Thousand Units)
- Fig. 56 Kingdom of Saudi Arabia E-Bike market estimates & forecasts, 2018 - 2030 (USD Million, Thousand Units)
- Fig. 57 UAE E-Bike market estimates & forecasts, 2018 - 2030 (USD Million, Thousand Units)
- Fig. 58 South Africa E-Bike market estimates & forecasts, 2018 - 2030 (USD Million, Thousand Units)
- Fig. 59 Key company categorization
- Fig. 60 Company market share analysis, 2024
- Fig. 61 Company market positioning
E-Bike Market Growth & Trends:
The global e-bike market size is estimated to reach USD 113.64 billion by 2030, expanding at a CAGR of 10.3% from 2025 to 2030, according to a new report by Grand View Research, Inc. Electric bikes are considered an eco-friendly and flexible mode of transportation. They are an ideal substitute for public transport, scooters, and smart cars as they help avoid traffic jams and achieve high speed with minimal effort. Moreover, they enable riders to maintain a healthy lifestyle through increased physical activity. These factors are contributing to the growth of the global market.
The declining consumer inclination toward cars owing to increased traffic on streets and growing urbanization is expected to offer lucrative growth opportunities for the market across the globe. Additionally, governments of several countries, including India, U.K., and Canada, are focused on developing infrastructures for bicycles owing to the growing consumer preferences for electric bikee-bikes. For instance, in 2017, Bikeep, a commercial bike parking systems and bike racks manufacturer, introduced a smart bicycle rack solution that offers electric bicycle charging. The solution is designed to cater to various popular electric bicycles.
Key players in the market are focused on strategies such as new product launch and geographic expansion to enhance their business operations and product offerings. For instance, in October 2020, Giant Manufacturing Co. Ltd. announced the launch of a full-composite trail bike, Trance X Advanced Pro 29. The bike is equipped with an updated Maestro rear suspension and flip-chip feature that permits riders to modify the frame geometry. Similarly, in October 2020, Pedego Electric Bikes opened a new store in Boca Raton, Florida. The store offers a full range of electric bikes for rental and sale, along with related accessories and services.
E-Bike Market Report Highlights:
- Based on drive, the chain drive segment led the market with the largest revenue share of 88.90% in 2024. The dominance of the chain drive segment in the e-bike industry is attributed to its proven reliability, cost-effectiveness, and widespread familiarity among manufacturers and consumers.
- Based on battery, the lithium-ion battery segment led the market with the largest revenue share of 82.87% in 2024 and is anticipated to grow at the fastest CAGR during the forecast period.
- The Asia Pacific is expected to become the largest regional market over the forecast period owing to significant investments in the vehicle charging infrastructure and government subsidies for battery-powered vehicles
Table of Contents
Chapter 1. Methodology and Scope
- 1.1. Market Segmentation and Scope
- 1.2. Market Definitions
- 1.3. Information Procurement
- 1.4. Information Analysis
- 1.4.1. Market Formulation & Data Visualization
- 1.4.2. Data Validation & Publishing
- 1.5. Research Scope and Assumptions
- 1.6. List to Data Sources
Chapter 2. Executive Summary
- 2.1. Market Snapshot
- 2.2. Segment Snapshot
- 2.3. Competitive Landscape Snapshot
Chapter 3. E-Bike Market Variables and Trends
- 3.1. Parent Market Outlook
- 3.2. Industry Value Chain Analysis
- 3.2.1. Raw material and component suppliers
- 3.2.2. E-Bikes manufacturers
- 3.2.3. Distributors
- 3.2.4. End Users
- 3.3. Market Dynamics
- 3.3.1. Market driver impact analysis
- 3.3.2. Market challenge impact analysis
- 3.3.3. Market opportunity impact analysis
- 3.4. Industry Analysis Tools
- 3.4.1. Porter's analysis
- 3.4.2. PESTEL analysis
Chapter 4. E-Bike Market: Drive Estimates & Trend Analysis
- 4.1. Drive Movement Analysis & Market Share, 2024 & 2030
- 4.2. E-Bike Market Estimates & Forecast, By Drive (Revenue, Volume)
- 4.2.1. Belt Drive
- 4.2.2. Chain Drive
Chapter 5. E-Bike Market: Battery Estimates & Trend Analysis
- 5.1. Battery Movement Analysis & Market Share, 2024 & 2030
- 5.2. E-Bike Market Estimates & Forecast, By Battery (Revenue, Volume)
- 5.2.1. Lead-acid Battery
- 5.2.2. Lithium-ion Battery
- 5.2.3. Others
Chapter 6. E-Bike Market: End Use Estimates & Trend Analysis
- 6.1. End Use Movement Analysis & Market Share, 2024 & 2030
- 6.2. E-Bike Market Estimates & Forecast, By End Use (Revenue, Volume)
- 6.2.1. Personal
- 6.2.2. Commercial
Chapter 7. E-Bike Market: Regional Estimates & Trend Analysis
- 7.1. E-Bike Market: Regional Outlook
- 7.2. North America
- 7.2.1. North America e-bike market estimates & forecasts, 2018 - 2030 (USD Million, Thousand Units)
- 7.2.2. U.S.
- 7.2.2.1. U.S. E-bike market estimates & forecasts, 2018 - 2030 (USD Million, Thousand Units)
- 7.2.3. Canada
- 7.2.3.1. Canada e-bike market estimates & forecasts, 2018 - 2030 (USD Million, Thousand Units)
- 7.2.4. Mexico
- 7.2.4.1. Mexico e-bike market estimates & forecasts, 2018 - 2030 (USD Million, Thousand Units)
- 7.3. Europe
- 7.3.1. Europe e-bike market estimates & forecasts, 2018 - 2030 (USD Million, Thousand Units)
- 7.3.2. UK
- 7.3.2.1. UK e-bike market estimates & forecasts, 2018 - 2030 (USD Million, Thousand Units)
- 7.3.3. Germany
- 7.3.3.1. Germany e-bike market estimates & forecasts, 2018 - 2030 (USD Million, Thousand Units)
- 7.3.4. France
- 7.3.4.1. France e-bike market estimates & forecasts, 2018 - 2030 (USD Million, Thousand Units)
- 7.4. 7.4 Asia Pacific
- 7.4.1. Asia Pacific e-bike market estimates & forecasts, 2018 - 2030 (USD Million, Thousand Units)
- 7.4.2. China
- 7.4.2.1. China e-bike market estimates & forecasts, 2018 - 2030 (USD Million, Thousand Units)
- 7.4.3. India
- 7.4.3.1. India e-bike market estimates & forecasts, 2018 - 2030 (USD Million, Thousand Units)
- 7.4.4. Japan
- 7.4.4.1. Japan e-bike market estimates & forecasts, 2018 - 2030 (USD Million, Thousand Units)
- 7.4.5. South Korea
- 7.4.5.1. South Korea e-bike market estimates & forecasts, 2018 - 2030 (USD Million, Thousand Units)
- 7.4.6. Australia
- 7.4.6.1. Australia e-bike market estimates & forecasts, 2018 - 2030 (USD Million, Thousand Units)
- 7.5. Latin America
- 7.5.1. Latin America e-bike market estimates & forecasts, 2018 - 2030 (USD Million, Thousand Units)
- 7.5.2. Brazil
- 7.5.2.1. Brazil e-bike market estimates & forecasts, 2018 - 2030 (USD Million, Thousand Units)
- 7.6. Middle East & Africa
- 7.6.1. Middle East & Africa e-bike market estimates & forecasts, 2018 - 2030 (USD Million, Thousand Units)
- 7.6.2. Kingdom of Saudi Arabia
- 7.6.2.1. Kingdom of Saudi Arabia e-bike market estimates & forecasts, 2018 - 2030 (USD Million, Thousand Units)
- 7.6.3. UAE
- 7.6.3.1. UAE e-bike market estimates & forecasts, 2018 - 2030 (USD Million, Thousand Units)
- 7.6.4. South Africa
- 7.6.4.1. South Africa e-bike market estimates & forecasts, 2018 - 2030 (USD Million, Thousand Units)
Chapter 8. E-Bike market - Competitive Landscape
- 8.1. Company Categorization
- 8.1.1. Giant Manufacturing Co. Ltd.
- 8.1.1.1. Business overview
- 8.1.1.2. Financial Performance
- 8.1.1.3. Product benchmarking
- 8.1.1.4. Strategic initiatives
- 8.1.2. Yadea Group Holdings Ltd.
- 8.1.2.1. Business overview
- 8.1.2.2. Financial Performance
- 8.1.2.3. Product benchmarking
- 8.1.2.4. Strategic initiatives
- 8.1.3. Pedego Electric Bikes
- 8.1.3.1. Business overview
- 8.1.3.2. Financial Performance
- 8.1.3.3. Product benchmarking
- 8.1.3.4. Strategic initiatives
- 8.1.4. Merida Industry Co. Ltd.
- 8.1.4.1. Business overview
- 8.1.4.2. Financial Performance
- 8.1.4.3. Product benchmarking
- 8.1.5. Trek Bicycle Corporation
- 8.1.5.1. Business overview
- 8.1.5.2. Financial Performance
- 8.1.5.3. Product benchmarking
- 8.1.5.4. Strategic initiatives
- 8.1.6. Accell Group N.V.
- 8.1.6.1. Business overview
- 8.1.6.2. Financial Performance
- 8.1.6.3. Product benchmarking
- 8.1.7. Brompton Bicycle Ltd.
- 8.1.7.1. Business overview
- 8.1.7.2. Financial Performance
- 8.1.7.3. Product benchmarking
- 8.1.7.4. Strategic initiatives
- 8.1.8. Yamaha Motor Company
- 8.1.8.1. Business overview
- 8.1.8.2. Financial Performance
- 8.1.8.3. Product benchmarking
- 8.1.8.4. Strategic initiatives
- 8.1.9. Pon.Bike
- 8.1.9.1. Business overview
- 8.1.9.2. Financial Performance
- 8.1.9.3. Product benchmarking
- 8.1.9.4. Strategic initiatives
- 8.1.10. Aima Technology Group Co. Ltd.
- 8.1.10.1. Business overview
- 8.1.10.2. Financial Performance
- 8.1.10.3. Product benchmarking
- 8.1.1. Giant Manufacturing Co. Ltd.
- 8.2. Company Market Share Analysis, 2024
- 8.3. Company Market Positioning
- 8.4. Company Heat Map Analysis

