|
|
市場調査レポート
商品コード
1301185
高所作業プラットフォームの市場規模、シェア、動向分析レポート:製品タイプ別(ブーム、シザー)、推進タイプ別(ICE、電気)、用途別(建設、公共事業)、昇降高さ別、地域別、セグメント別予測、2023年~2030年Aerial Work Platform Market Size, Share & Trends Analysis Report By Product (Boom, Scissor), By Propulsion Type (ICE, Electric), By Application (Construction, Utilities), By Lifting Height, By Region And Segment Forecasts, 2023 - 2030 |
||||||
カスタマイズ可能
|
|||||||


| 高所作業プラットフォームの市場規模、シェア、動向分析レポート:製品タイプ別(ブーム、シザー)、推進タイプ別(ICE、電気)、用途別(建設、公共事業)、昇降高さ別、地域別、セグメント別予測、2023年~2030年 |
|
出版日: 2023年06月01日
発行: Grand View Research
ページ情報: 英文 120 Pages
納期: 2~10営業日
|

- 全表示
- 概要
- 図表
- 目次
高所作業プラットフォーム市場の成長と動向
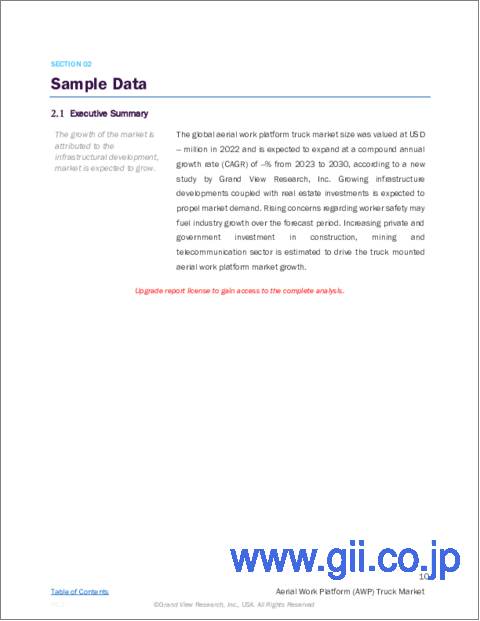
Grand View Research, Inc.の最新レポートによると、高所作業プラットフォームの世界市場規模は2023年から2030年にかけてCAGR 8.9%で成長し、2030年には337億8,000万米ドルに達すると予測されています。
特に新興国の建設部門の成長が市場拡大に大きく寄与しています。急速な都市化、インフラ開発イニシアティブ、既存構造物の保守・修理の必要性が、信頼性が高く安全な空中リフトの強い需要を生み出しています。高所作業プラットフォームは、主に多様な産業における建設やメンテナンス活動で使用され、効率的な製品の配置、倉庫での商品の保管、その他の様々な用途などの作業を可能にします。
市場は経済状況や地政学的要因の影響を受ける。景気後退、不況、為替レートの変動は、建設やインフラ開発プロジェクトに直接的な影響を及ぼし、その結果、AWPの需要が減少する可能性があります。さらに、地政学的緊張、貿易紛争、規制の不確実性は、世界なサプライチェーンを混乱させ、メーカーが原材料を調達し、製品を効率的に流通させることを困難にする可能性があります。これらの要因は市場に課題をもたらし、市場全体のパフォーマンスに影響を与える可能性があります。AWPの機能性と効率性は、技術の進歩によって大幅に向上しています。
メーカーは、伸縮ブーム、連結アーム、セルフレベリング機能、高度な制御システムなどの革新的な機能を統合しています。これらの開発により、AWPの用途は拡大し、全体的な性能も向上し、エンドユーザーにとってより魅力的なものとなっています。例えば、先進国における自動倉庫の台頭は、製品やパレットを配置するための多数のシングル・シザーズ・リフト、ダブル・シザーズ・リフト、その他のリフティング・テーブルの必要性を生み出しました。世界中のさまざまなeコマースおよびロジスティクス企業が倉庫ビルの建設に多額の資金と投資を行っており、市場全体の成長に大きく貢献すると予想されます。
高所作業プラットフォーム市場レポートハイライト
- ブームリフト分野は予測期間中に最も高いCAGRで成長する見込み。予防保守と安全規制の遵守が重視されるようになり、産業分野でのブームリフトの需要に拍車をかけています。
- 電動AWPは予測期間中に10.5%近い最高のCAGRで成長する見込み。電動AWPの主な用途は、回転半径が小さく操縦性に優れているため屋内です。
- 20フィート未満のセグメントは、予測期間中ほぼ9.5%のCAGRで成長すると予想されます。リフティングハイトの低いAWPは、幅広い用途に使用できる汎用性の高い機械です。
- 建設セクターは、予測期間中に約9.5%のCAGRで成長すると予想されます。建設現場では高所へのアクセスがあり、主に不整地用空中プラットフォームが使用されます。
- これらの現場では、高所で作業する作業員に関連する事故が発生しやすいです。AWPは、従来のソリューションと比較して、作業員やオペレータに安全性と柔軟性を提供します。
- 予測期間中、アジア太平洋地域が最も高いCAGRで成長すると予想されます。物流、小売、倉庫部門における自動化の急速な発展が、同地域のAWP需要を牽引すると予測される
目次
第1章 調査手法と範囲
- 調査手法
- 情報調達
- 購入したデータベース
- GVRの内部データベース
- 二次情報と第三者の視点
- 1次調査
- 情報分析
- データ分析モデル
- 市場の形成とデータの視覚化
- データの検証と公開
第2章 エグゼクティブサマリー
- 高所作業プラットフォーム市場スナップショット、2022年および2030年
- 製品セグメントのスナップショット、2022年と2030年
- 推進タイプセグメントのスナップショット、2022年および2030年
- 昇降高さセグメントのスナップショット、2022年と2030年
- 用途セグメントのスナップショット、2022年と2030年
- 2022年と2030年の競合情勢のスナップショット
第3章 高所作業プラットフォームの市場変数、動向、範囲
- 市場系統の見通し
- 高所作業プラットフォーム市場-バリューチェーン分析
- 高所作業プラットフォーム市場-市場力学
- 市場促進要因の分析
- 市場抑制要因分析
- 市場機会分析
- 業界分析ツール
- 高所作業プラットフォーム市場- ポーターの分析
- 高所作業プラットフォーム市場-PESTEL分析
第4章 高所作業プラットフォーム市場、製品の展望
- 高所作業プラットフォームの製品別市場シェア、2022年および2030年(100万米ドル)
- ブームリフト
- 市場推計・予測、2018年から2030年(100万米ドル)
- シザーリフト
- 市場推計・予測、2018年から2030年(100万米ドル)
- 垂直リフト
- 市場推計・予測、2018年から2030年(100万米ドル)
第5章 高所作業プラットフォーム市場、推進タイプの展望
- 推進タイプ別の高所作業プラットフォーム市場シェア、2022年および2030年(100万米ドル)
- ICE
- 市場推計・予測、2018年から2030年(100万米ドル)
- 電気
- 市場推計・予測、2018年から2030年(100万米ドル)
第6章 高所作業プラットフォーム市場、昇降高さの展望
- 昇降高さ別高所作業プラットフォーム市場シェア、2022年および2030年(100万米ドル)
- 20フィート未満
- 市場推計・予測、2018年から2030年(100万米ドル)
- 21~50フィート
- 市場推計・予測、2018年から2030年(100万米ドル)
- 51フィート以上
- 市場推計・予測、2018年から2030年(100万米ドル)
第7章 高所作業プラットフォーム市場、用途の展望
- 用途別の高所作業プラットフォーム市場シェア、2022年および2030年(100万米ドル)
- 建設
- 市場推計・予測、2018年から2030年(100万米ドル)
- 公共事業
- 市場推計・予測、2018年から2030年(100万米ドル)
- 物流と輸送
- 市場推計・予測、2018年から2030年(100万米ドル)
- その他
- 市場推計・予測、2018年から2030年(100万米ドル)
第8章 高所作業プラットフォーム市場、地域別の展望
- 地域別高所作業車市場シェア、2022年および2030年(100万米ドル)
- 北米
- 市場推計・予測、2018年から2030年(100万米ドル)
- 製品別、2018~2030年
- 推進タイプ別、2018~2030年
- 昇降高さ別、2018-2030
- 用途別、2018~2030年
- 米国
- カナダ
- 欧州
- 市場推計・予測、2018年から2030年(100万米ドル)
- 製品別、2018~2030年
- 推進タイプ別、2018~2030年
- 昇降高さ別、2018-2030
- 用途別、2018~2030年
- 英国
- ドイツ
- フランス
- イタリア
- スペイン
- アジア太平洋地域
- 市場推計・予測、2018年から2030年(100万米ドル)
- 製品別、2018~2030年
- 推進タイプ別、2018~2030年
- 昇降高さ別、2018-2030
- 用途別、2018~2030年
- 中国
- インド
- 日本
- オーストラリア
- 韓国
- ラテンアメリカ
- 市場推計・予測、2018年から2030年(100万米ドル)
- 製品別、2018~2030年
- 推進タイプ別、2018~2030年
- 昇降高さ別、2018-2030
- 用途別、2018~2030年
- ブラジル
- メキシコ
- アルゼンチン
- 中東とアフリカ
- 市場推計・予測、2018年から2030年(100万米ドル)
- 製品別、2018~2030年
- 推進タイプ別、2018~2030年
- 昇降高さ別、2018-2030
- 用途別、2018~2030年
- アラブ首長国連邦
- サウジアラビア
- 南アフリカ
第9章 競合情勢
- 会社の分類
- 企業市場ランキング・シェア分析、2022年
- 企業ヒートマップ分析
- 戦略マッピング
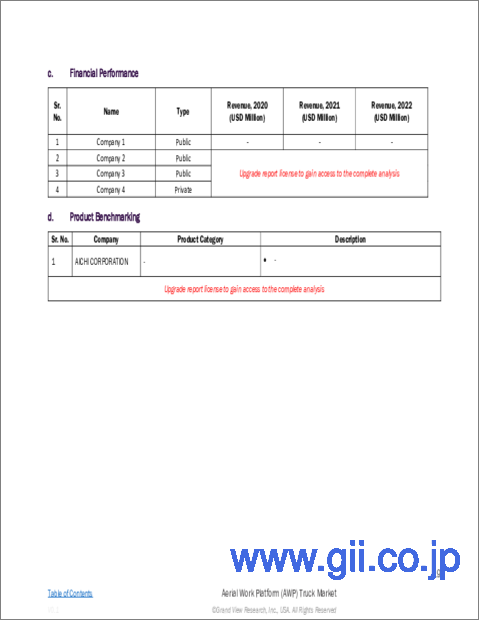
- 企業プロファイル(会社概要、業績、製品概要、戦略的取り組み)
- AICHI CORPORATION
- Advance Lifts, Inc.
- Altec Industries
- Bronto Skylift
- DINOLIFT OY
- EdmoLift AB
- HAULOTTE GROUP
- JLG Industries
- Linamar Corporation
- MEC
- RUNSHARE Heavy Industry Company, Ltd
- Tadano Ltd.
- Terex Corporation
- WIESE USA
- Zhejiang Dingli Machinery Co., Ltd.
List of Tables
- Table 1 Aerial work platform market - Industry snapshot & key buying criteria, 2018 - 2030
- Table 2 Global aerial work platform market, 2018 - 2030 (USD Million)
- Table 3 Global aerial work platform market, 2018 - 2030 (Volume Units)
- Table 4 Global aerial work platform market, by region, 2018 - 2030 (USD Million)
- Table 5 Global aerial work platform market, by product, 2018 - 2030 (USD Million)
- Table 6 Global aerial work platform market, by product, 2018 - 2030 (Volume Units)
- Table 7 Global aerial work platform market, by propulsion type, 2018 - 2030 (USD Million)
- Table 8 Global aerial work platform market, by lifting height, 2018 - 2030 (USD Million)
- Table 9 Global aerial work platform market, by application, 2018 - 2030 (USD Million)
- Table 10 Vendor landscape
- Table 11 Boom Lifts aerial work platform market, 2018 - 2030 (USD Million)
- Table 12 Boom Lifts aerial work platform market, by region, 2018 - 2030 (USD Million)
- Table 13 Boom Lifts aerial work platform market, by region, 2018 - 2030 (Volume Units)
- Table 14 Scissor Lifts aerial work platform market, 2018 - 2030 (USD Million)
- Table 15 Scissor Lifts aerial work platform market, by region, 2018 - 2030 (USD Million)
- Table 16 Scissor Lifts aerial work platform market, by region, 2018 - 2030 (Volume Units)
- Table 17 Vertical Lifts aerial work platform market, 2018 - 2030 (USD Million)
- Table 18 Vertical Lifts aerial work platform market, by region, 2018 - 2030 (USD Million)
- Table 19 Vertical Lifts aerial work platform market, by region, 2018 - 2030 (Volume Units)
- Table 20 ICE aerial work platform market, 2018 - 2030 (USD Million)
- Table 21 ICE aerial work platform market, by region, 2018 - 2030 (USD Million)
- Table 22 Electric aerial work platform market, 2018 - 2030 (USD Million)
- Table 23 Electric aerial work platform market, by region, 2018 - 2030 (USD Million)
- Table 24 Less than 20 ft aerial work platform market, 2018 - 2030 (USD Million)
- Table 25 Less than 20 ft aerial work platform market, by region, 2018 - 2030 (USD Million)
- Table 26 21-50 ft aerial work platform services market, 2018 - 2030 (USD Million)
- Table 27 21-50 ft aerial work platform services market, by region, 2018 - 2030 (USD Million)
- Table 28 More than 51 ft aerial work platform services market, 2018 - 2030 (USD Million)
- Table 29 More than 51 ft aerial work platform services market, by region, 2018 - 2030 (USD Million)
- Table 30 Construction aerial work platform market, 2018 - 2030 (USD Million)
- Table 31 Construction aerial work platform market, by region, 2018 - 2030 (USD Million)
- Table 32 Utilities aerial work platform market, 2018 - 2030 (USD Million)
- Table 33 Utilities aerial work platform market, by region, 2018 - 2030 (USD Million)
- Table 34 Logistics & Transportation aerial work platform market, 2018 - 2030 (USD Million)
- Table 35 Logistics & Transportation aerial work platform market, by region, 2018 - 2030 (USD Million)
- Table 36 Others aerial work platform services market, 2018 - 2030 (USD Million)
- Table 37 Others aerial work platform services market, by region, 2018 - 2030 (USD Million)
- Table 38 North America aerial work platform market, 2018 - 2030 (USD Million)
- Table 39 North America aerial work platform market, by product, 2018 - 2030 (USD Million)
- Table 40 North America aerial work platform market, by product, 2018 - 2030 (Volume Units)
- Table 41 North America aerial work platform market, by propulsion type, 2018 - 2030 (USD Million)
- Table 42 North America aerial work platform market, by lifting height, 2018 - 2030 (USD Million)
- Table 43 North America aerial work platform market, by application, 2018 - 2030 (USD Million)
- Table 44 The U.S. aerial work platform market, 2018 - 2030 (USD Million)
- Table 45 The U.S. aerial work platform market, by product, 2018 - 2030 (USD Million)
- Table 46 The U.S. aerial work platform market, by product, 2018 - 2030 (Volume Units)
- Table 47 The U.S. aerial work platform market, by propulsion type, 2018 - 2030 (USD Million)
- Table 48 The U.S. aerial work platform market, by lifting height, 2018 - 2030 (USD Million)
- Table 49 The U.S. aerial work platform market, by application, 2018 - 2030 (USD Million)
- Table 50 Canada aerial work platform market, 2018 - 2030 (USD Million)
- Table 51 Canada aerial work platform market, by product, 2018 - 2030 (USD Million)
- Table 52 Canada aerial work platform market, by product, 2018 - 2030 (Volume Units)
- Table 53 Canada aerial work platform market, by propulsion type, 2018 - 2030 (USD Million)
- Table 54 Canada aerial work platform market, by lifting height, 2018 - 2030 (USD Million)
- Table 55 Canada aerial work platform market, by application, 2018 - 2030 (USD Million)
- Table 56 Europe aerial work platform market, 2018 - 2030 (USD Million)
- Table 57 Europe aerial work platform market, by product, 2018 - 2030 (USD Million)
- Table 58 Europe aerial work platform market, by product, 2018 - 2030 (Volume Units)
- Table 59 Europe aerial work platform market, by propulsion type, 2018 - 2030 (USD Million)
- Table 60 Europe aerial work platform market, by lifting height, 2018 - 2030 (USD Million)
- Table 61 Europe aerial work platform market, by application, 2018 - 2030 (USD Million)
- Table 62 Germany aerial work platform market, 2018 - 2030 (USD Million)
- Table 63 Germany aerial work platform market, by product, 2018 - 2030 (USD Million)
- Table 64 Germany aerial work platform market, by product, 2018 - 2030 (Volume Units)
- Table 65 Germany aerial work platform market, by propulsion type, 2018 - 2030 (USD Million)
- Table 66 Germany aerial work platform market, by lifting height, 2018 - 2030 (USD Million)
- Table 67 Germany aerial work platform market, by application, 2018 - 2030 (USD Million)
- Table 68 The UK aerial work platform market, 2018 - 2030 (USD Million)
- Table 69 The UK aerial work platform market, by product, 2018 - 2030 (USD Million)
- Table 70 The UK aerial work platform market, by product, 2018 - 2030 (Volume Units)
- Table 71 The UK aerial work platform market, by propulsion type, 2018 - 2030 (USD Million)
- Table 72 The UK aerial work platform market, by lifting height, 2018 - 2030 (USD Million)
- Table 73 The UK aerial work platform market, by application, 2018 - 2030 (USD Million)
- Table 74 France aerial work platform market, 2018 - 2030 (USD Million)
- Table 75 France aerial work platform market, by product, 2018 - 2030 (USD Million)
- Table 76 France aerial work platform market, by product, 2018 - 2030 (Volume Units)
- Table 77 France aerial work platform market, by propulsion type, 2018 - 2030 (USD Million)
- Table 78 France aerial work platform market, by lifting height, 2018 - 2030 (USD Million)
- Table 79 Italy aerial work platform market, by application, 2018 - 2030 (USD Million)
- Table 80 Italy aerial work platform market, 2018 - 2030 (USD Million)
- Table 81 Italy aerial work platform market, by product, 2018 - 2030 (USD Million)
- Table 82 Italy aerial work platform market, by product, 2018 - 2030 (Volume Units)
- Table 83 Italy aerial work platform market, by propulsion type, 2018 - 2030 (USD Million)
- Table 84 Italy aerial work platform market, by lifting height, 2018 - 2030 (USD Million)
- Table 85 Italy aerial work platform market, by application, 2018 - 2030 (USD Million)
- Table 86 Spain aerial work platform market, 2018 - 2030 (USD Million)
- Table 87 Spain aerial work platform market, by product, 2018 - 2030 (USD Million)
- Table 88 Spain aerial work platform market, by product, 2018 - 2030 (Volume Units)
- Table 89 Spain aerial work platform market, by propulsion type, 2018 - 2030 (USD Million)
- Table 90 Spain aerial work platform market, by lifting height, 2018 - 2030 (USD Million)
- Table 91 Spain aerial work platform market, by application, 2018 - 2030 (USD Million)
- Table 92 Asia Pacific aerial work platform market, 2018 - 2030 (USD Million)
- Table 93 Asia Pacific aerial work platform market, by product, 2018 - 2030 (USD Million)
- Table 94 Asia Pacific aerial work platform market, by product, 2018 - 2030 (Volume Units)
- Table 95 Asia Pacific aerial work platform market, by propulsion type, 2018 - 2030 (USD Million)
- Table 96 Asia Pacific aerial work platform market, by lifting height, 2018 - 2030 (USD Million)
- Table 97 Asia Pacific aerial work platform market, by application, 2018 - 2030 (USD Million)
- Table 98 China aerial work platform market, 2018 - 2030 (USD Million)
- Table 99 China aerial work platform market, by product, 2018 - 2030 (USD Million)
- Table 100 China aerial work platform market, by product, 2018 - 2030 (Volume Units)
- Table 101 China aerial work platform market, by propulsion type, 2018 - 2030 (USD Million)
- Table 102 China aerial work platform market, by lifting height, 2018 - 2030 (USD Million)
- Table 103 China aerial work platform market, by application, 2018 - 2030 (USD Million)
- Table 104 India aerial work platform market, 2018 - 2030 (USD Million)
- Table 105 India aerial work platform market, by product, 2018 - 2030 (USD Million)
- Table 106 India aerial work platform market, by product, 2018 - 2030 (Volume Units)
- Table 107 India aerial work platform market, by propulsion type, 2018 - 2030 (USD Million)
- Table 108 India aerial work platform market, by lifting height, 2018 - 2030 (USD Million)
- Table 109 India aerial work platform market, by application, 2018 - 2030 (USD Million)
- Table 110 Japan aerial work platform market, 2018 - 2030 (USD Million)
- Table 111 Japan aerial work platform market, by product, 2018 - 2030 (USD Million)
- Table 112 Japan aerial work platform market, by product, 2018 - 2030 (Volume Units)
- Table 113 Japan aerial work platform market, by propulsion type, 2018 - 2030 (USD Million)
- Table 114 Japan aerial work platform market, by lifting height, 2018 - 2030 (USD Million)
- Table 115 Japan aerial work platform market, by application, 2018 - 2030 (USD Million)
- Table 116 Australia aerial work platform market, 2018 - 2030 (USD Million)
- Table 117 Australia aerial work platform market, by product, 2018 - 2030 (USD Million)
- Table 118 Australia aerial work platform market, by product, 2018 - 2030 (Volume Units)
- Table 119 Australia aerial work platform market, by propulsion type, 2018 - 2030 (USD Million)
- Table 120 Australia aerial work platform market, by lifting height, 2018 - 2030 (USD Million)
- Table 121 Australia aerial work platform market, by application, 2018 - 2030 (USD Million)
- Table 122 South Korea aerial work platform market, 2018 - 2030 (USD Million)
- Table 123 South Korea aerial work platform market, by product, 2018 - 2030 (USD Million)
- Table 124 South Korea aerial work platform market, by product, 2018 - 2030 (Volume Units)
- Table 125 South Korea aerial work platform market, by propulsion type, 2018 - 2030 (USD Million)
- Table 126 South Korea aerial work platform market, by lifting height, 2018 - 2030 (USD Million)
- Table 127 South Korea aerial work platform market, by application, 2018 - 2030 (USD Million)
- Table 128 Latin America aerial work platform market, 2018 - 2030 (USD Million)
- Table 129 Latin America aerial work platform market, by product, 2018 - 2030 (USD Million)
- Table 130 Latin America aerial work platform market, by product, 2018 - 2030 (Volume Units)
- Table 131 Latin America aerial work platform market, by propulsion type, 2018 - 2030 (USD Million)
- Table 132 Latin America aerial work platform market, by lifting height, 2018 - 2030 (USD Million)
- Table 133 Latin America aerial work platform market, by application, 2018 - 2030 (USD Million)
- Table 134 Brazil aerial work platform market, 2018 - 2030 (USD Million)
- Table 135 Brazil aerial work platform market, by product, 2018 - 2030 (USD Million)
- Table 136 Brazil aerial work platform market, by product, 2018 - 2030 (Volume Units)
- Table 137 Brazil aerial work platform market, by propulsion type, 2018 - 2030 (USD Million)
- Table 138 Brazil aerial work platform market, by lifting height, 2018 - 2030 (USD Million)
- Table 139 Brazil aerial work platform market, by application, 2018 - 2030 (USD Million)
- Table 140 Mexico aerial work platform market, 2018 - 2030 (USD Million)
- Table 141 Mexico aerial work platform market, by product, 2018 - 2030 (USD Million)
- Table 142 Mexico aerial work platform market, by product, 2018 - 2030 (Volume Units)
- Table 143 Mexico aerial work platform market, by propulsion type, 2018 - 2030 (USD Million)
- Table 144 Mexico aerial work platform market, by lifting height, 2018 - 2030 (USD Million)
- Table 145 Mexico aerial work platform market, by application, 2018 - 2030 (USD Million)
- Table 146 Argentina aerial work platform market, 2018 - 2030 (USD Million)
- Table 147 Argentina aerial work platform market, by product, 2018 - 2030 (USD Million)
- Table 148 Argentina aerial work platform market, by product, 2018 - 2030 (Volume Units)
- Table 149 Argentina aerial work platform market, by propulsion type, 2018 - 2030 (USD Million)
- Table 150 Argentina aerial work platform market, by lifting height, 2018 - 2030 (USD Million)
- Table 151 Argentina aerial work platform market, by application, 2018 - 2030 (USD Million)
- Table 152 Middle East & Africa aerial work platform market, 2018 - 2030 (USD Million)
- Table 153 Middle East & Africa aerial work platform market, by product, 2018 - 2030 (USD Million)
- Table 154 Middle East & Africa aerial work platform market, by product, 2018 - 2030 (Volume Units)
- Table 155 Middle East & Africa aerial work platform market, by propulsion type, 2018 - 2030 (USD Million)
- Table 156 Middle East & Africa aerial work platform market, by lifting height, 2018 - 2030 (USD Million)
- Table 157 Middle East & Africa aerial work platform market, by application, 2018 - 2030 (USD Million)
- Table 158 The U.A.E. aerial work platform market, 2018 - 2030 (USD Million)
- Table 159 The U.A.E. aerial work platform market, by product, 2018 - 2030 (USD Million)
- Table 160 The U.A.E. aerial work platform market, by product, 2018 - 2030 (Volume Units)
- Table 161 The U.A.E. aerial work platform market, by propulsion type, 2018 - 2030 (USD Million)
- Table 162 The U.A.E. aerial work platform market, by lifting height, 2018 - 2030 (USD Million)
- Table 163 The U.A.E. aerial work platform market, by application, 2018 - 2030 (USD Million)
- Table 164 Saudi Arabia aerial work platform market, 2018 - 2030 (USD Million)
- Table 165 Saudi Arabia aerial work platform market, by product, 2018 - 2030 (USD Million)
- Table 166 Saudi Arabia aerial work platform market, by product, 2018 - 2030 (Volume Units)
- Table 167 Saudi Arabia aerial work platform market, by propulsion type, 2018 - 2030 (USD Million)
- Table 168 Saudi Arabia aerial work platform market, by lifting height, 2018 - 2030 (USD Million)
- Table 169 Saudi Arabia aerial work platform market, by application, 2018 - 2030 (USD Million)
- Table 170 South Africa aerial work platform market, 2018 - 2030 (USD Million)
- Table 171 South Africa aerial work platform market, by product, 2018 - 2030 (USD Million)
- Table 172 South Africa aerial work platform market, by product, 2018 - 2030 (Volume Units)
- Table 173 South Africa aerial work platform market, by propulsion type, 2018 - 2030 (USD Million)
- Table 174 South Africa aerial work platform market, by lifting height, 2018 - 2030 (USD Million)
- Table 175 South Africa aerial work platform market, by application, 2018 - 2030 (USD Million)
List of Figures
- Fig. 1 Market segmentation and scope
- Fig. 2 Aerial work platform market, 2018 - 2030 (USD Million)
- Fig. 3 Aerial work platform market - Value chain analysis
- Fig. 4 Aerial work platform market - Market dynamics
- Fig. 5 Aerial work platform market - Key market driver impact
- Fig. 6 Aerial work platform market - Key market restraint impact
- Fig. 7 Aerial work platform market - Key opportunities prioritized
- Fig. 8 Aerial work platform market - Porter's five forces analysis
- Fig. 9 Aerial work platform market - PESTEL analysis
- Fig. 10 Aerial work platform market, by product, 2022
- Fig. 11 Aerial work platform market, by propulsion type, 2022
- Fig. 12 Aerial work platform market, by lifting height, 2022
- Fig. 13 Aerial work platform market, by application, 2022
- Fig. 14 Aerial work platform market, by region, 2022
- Fig. 15 Aerial work platform market - Regional takeaways
- Fig. 16 North America aerial work platform market - Key takeaways
- Fig. 17 Europe aerial work platform market - Key takeaways
- Fig. 18 Asia Pacific aerial work platform market - Key takeaways
- Fig. 19 Latin America aerial work platform market - Key takeaways
- Fig. 20 Middle East & Africa aerial work platform market - Key takeaways
Aerial Work Platform Market Growth & Trends
The global aerial work platform market size is expected to reach USD 33.78 billion by 2030, registering a CAGR of 8.9% from 2023 to 2030, according to the recent reports of Grand View Research, Inc. The growth of the construction sector, especially in developing countries, has significantly contributed to the expansion of the market. Rapid urbanization, infrastructure development initiatives, and the need to maintain & repair existing structures have created a strong demand for reliable and safe aerial lifts. Aerial work platforms are primarily used in construction and maintenance activities across diverse industries, enabling tasks, such as efficient product placement, storage of goods in warehouses, and various other applications.
The market is influenced by economic conditions and geopolitical factors. Economic downturns, recessions, and fluctuations in currency exchange rates can have a direct impact on construction and infrastructure development projects, resulting in a decrease in demand for AWPs. Moreover, geopolitical tensions, trade disputes, and regulatory uncertainties can disrupt global supply chains, making it difficult for manufacturers to source raw materials and distribute their products efficiently. These factors pose challenges to the market and can affect its overall performance. The functionality and efficiency of AWPs have been significantly enhanced through technological advancements.
Manufacturers are integrating innovative features, such as telescopic booms, articulating arms, self-leveling capabilities, and advanced control systems. These developments have expanded the range of applications for AWPs and improved their overall performance, making them more appealing to end-users. For example, the rise of automated warehouses in developed countries has created a need for numerous single-scissor lifts, double-scissor lifts, and other lifting tables for product and pallet placement. Substantial funding and investments from various e-commerce and logistics companies worldwide in constructing warehouse buildings are expected to contribute significantly to the overall growth of the market.
Aerial Work Platform Market Report Highlights
- The boom lifts segment is expected to register the highest CAGR over the forecast period. The growing emphasis on preventive maintenance and adherence to safety regulations is fueling the demand for boom lifts in the industrial sector
- Electric AWP is expected to register the highest CAGR of nearly 10.5% over the forecast period. The main application of electric AWPs is indoors due to their superior maneuverability with a smaller turning radius
- The less than 20 ft segment is expected to register the highest CAGR of nearly 9.5% over the forecast period. AWPs with lower lifting heights are versatile machines that can be employed in a wide range of applications
- The construction sector is expected to register the highest CAGR of approximately 9.5% over the forecast period. Construction sites involve accessing higher heights and majorly use rough terrain aerial platforms
- These sites are prone to accidents related to workers operating at high heights. AWPs offer increased safety and flexibility to workers and operators as compared to conventional solutions
- Asia Pacific is expected to register the highest CAGR over the forecast period. Rapid development in the logistics, retail, and warehousing sectors in terms of automation is projected to drive the AWP demand in the region
Table of Contents
Chapter 1. Methodology and Scope
- 1.1. Research Methodology
- 1.2. Information Procurement
- 1.2.1. Purchased database.
- 1.2.2. GVR's internal database
- 1.2.3. Secondary sources & third - party perspectives
- 1.2.4. Primary research
- 1.3. Information Analysis
- 1.3.1. Data Analysis Models
- 1.4. Market Formulation & Data Visualization
- 1.5. Data Validation & Publishing
Chapter 2. Executive Summary
- 2.1. Aerial Work Platform Market Snapshot, 2022 & 2030
- 2.2. Product Segment Snapshot, 2022 & 2030
- 2.3. Propulsion Type Segment Snapshot, 2022 & 2030
- 2.4. Lifting Height Segment Snapshot, 2022 & 2030
- 2.5. Application Segment Snapshot, 2022 & 2030
- 2.6. Competitive Landscape Snapshot, 2022 & 2030
Chapter 3. Aerial Work Platform Market Variables, Trends & Scope
- 3.1. Market Lineage Outlook
- 3.2. Aerial Work Platform Market - Value Chain Analysis
- 3.3. Aerial Work Platform Market - Market Dynamics
- 3.3.1. Market Driver Analysis
- 3.3.2. Market Restraint Analysis
- 3.3.3. Market Opportunity Analysis
- 3.4. Industry Analysis Tools
- 3.4.1. Aerial Work Platform Market - Porter's Analysis
- 3.4.2. Aerial Work Platform Market - PESTEL Analysis
Chapter 4. Aerial Work Platform Market Product Outlook
- 4.1. Aerial Work Platform Market Share by Product, 2022 & 2030 (USD Million) (Volume Units)
- 4.2. Boom Lifts
- 4.2.1. Market Estimates and Forecast, 2018 - 2030 (USD Million) (Volume Units)
- 4.3. Scissor Lifts
- 4.3.1. Market Estimates and Forecast, 2018 - 2030 (USD Million) (Volume Units)
- 4.4. Vertical Lifts
- 4.4.1. Market Estimates and Forecast, 2018 - 2030 (USD Million) (Volume Units)
Chapter 5. Aerial Work Platform Market Propulsion Type Outlook
- 5.1. Aerial Work Platform Market Share by Propulsion Type, 2022 & 2030 (USD Million)
- 5.2. ICE
- 5.2.1. Market Estimates and Forecast, 2018 - 2030 (USD Million)
- 5.3. Electric
- 5.3.1. Market Estimates and Forecast, 2018 - 2030 (USD Million)
Chapter 6. Aerial Work Platform Market Lifting Height Outlook
- 6.1. Aerial Work Platform Market Share by Lifting Height, 2022 & 2030 (USD Million)
- 6.2. Less than 20 ft
- 6.2.1. Market Estimates and Forecast, 2018 - 2030 (USD Million)
- 6.3. 21-50 ft
- 6.3.1. Market Estimates and Forecast, 2018 - 2030 (USD Million)
- 6.4. More than 51 ft
- 6.4.1. Market Estimates and Forecast, 2018 - 2030 (USD Million)
Chapter 7. Aerial Work Platform Market Application Outlook
- 7.1. Aerial Work Platform Market Share by Application, 2022 & 2030 (USD Million)
- 7.2. Construction
- 7.2.1. Market Estimates and Forecast, 2018 - 2030 (USD Million)
- 7.3. Utilities
- 7.3.1. Market Estimates and Forecast, 2018 - 2030 (USD Million)
- 7.4. Logistics & Transportation
- 7.4.1. Market Estimates and Forecast, 2018 - 2030 (USD Million)
- 7.5. Others
- 7.5.1. Market Estimates and Forecast, 2018 - 2030 (USD Million)
Chapter 8. Aerial Work Platform Market: Regional Outlook
- 8.1. Aerial Work Platform Market Share by Region, 2022 & 2030 (USD Million) (Volume Units)
- 8.2. North America
- 8.2.1. Market Estimates and Forecast, 2018 - 2030 (USD Million) (Volume Units)
- 8.2.2. Market Estimates and Forecast by Product, 2018 - 2030 (USD Million) (Volume Units)
- 8.2.3. Market Estimates and Forecast by Propulsion Type, 2018 - 2030 (USD Million)
- 8.2.4. Market Estimates and Forecast by Lifting Height, 2018 - 2030 (USD Million)
- 8.2.5. Market Estimates and Forecast by Application, 2018 - 2030 (USD Million)
- 8.2.6. U.S.
- 8.2.6.1. Market Estimates and Forecast, 2018 - 2030 (USD Million) (Volume Units)
- 8.2.6.2. Market Estimates and Forecast by Product, 2018 - 2030 (USD Million) (Volume Units)
- 8.2.6.3. Market Estimates and Forecast by Propulsion Type, 2018 - 2030 (USD Million)
- 8.2.6.4. Market Estimates and Forecast by Lifting Height, 2018 - 2030 (USD Million)
- 8.2.6.5. Market Estimates and Forecast by Application, 2018 - 2030 (USD Million)
- 8.2.7. Canada
- 8.2.7.1. Market Estimates and Forecast, 2018 - 2030 (USD Million) (Volume Units)
- 8.2.7.2. Market Estimates and Forecast by Product, 2018 - 2030 (USD Million) (Volume Units)
- 8.2.7.3. Market Estimates and Forecast by Propulsion Type, 2018 - 2030 (USD Million)
- 8.2.7.4. Market Estimates and Forecast by Lifting Height, 2018 - 2030 (USD Million)
- 8.2.7.5. Market Estimates and Forecast by Application, 2018 - 2030 (USD Million)
- 8.3. Europe
- 8.3.1. Market Estimates and Forecast, 2018 - 2030 (USD Million) (Volume Units)
- 8.3.2. Market Estimates and Forecast by Product, 2018 - 2030 (USD Million) (Volume Units)
- 8.3.3. Market Estimates and Forecast by Propulsion Type, 2018 - 2030 (USD Million)
- 8.3.4. Market Estimates and Forecast by Lifting Height, 2018 - 2030 (USD Million)
- 8.3.5. Market Estimates and Forecast by Application, 2018 - 2030 (USD Million)
- 8.3.6. UK
- 8.3.6.1. Market Estimates and Forecast, 2018 - 2030 (USD Million) (Volume Units)
- 8.3.6.2. Market Estimates and Forecast by Product, 2018 - 2030 (USD Million) (Volume Units)
- 8.3.6.3. Market Estimates and Forecast by Propulsion Type, 2018 - 2030 (USD Million)
- 8.3.6.4. Market Estimates and Forecast by Lifting Height, 2018 - 2030 (USD Million)
- 8.3.6.5. Market Estimates and Forecast by Application, 2018 - 2030 (USD Million)
- 8.3.7. Germany
- 8.3.7.1. Market Estimates and Forecast, 2018 - 2030 (USD Million) (Volume Units)
- 8.3.7.2. Market Estimates and Forecast by Product, 2018 - 2030 (USD Million) (Volume Units)
- 8.3.7.3. Market Estimates and Forecast by Propulsion Type, 2018 - 2030 (USD Million)
- 8.3.7.4. Market Estimates and Forecast by Lifting Height, 2018 - 2030 (USD Million)
- 8.3.7.5. Market Estimates and Forecast by Application, 2018 - 2030 (USD Million)
- 8.3.8. France
- 8.3.8.1. Market Estimates and Forecast, 2018 - 2030 (USD Million) (Volume Units)
- 8.3.8.2. Market Estimates and Forecast by Product, 2018 - 2030 (USD Million) (Volume Units)
- 8.3.8.3. Market Estimates and Forecast by Propulsion Type, 2018 - 2030 (USD Million)
- 8.3.8.4. Market Estimates and Forecast by Lifting Height, 2018 - 2030 (USD Million)
- 8.3.8.5. Market Estimates and Forecast by Application, 2018 - 2030 (USD Million)
- 8.3.9. Italy
- 8.3.9.1. Market Estimates and Forecast, 2018 - 2030 (USD Million) (Volume Units)
- 8.3.9.2. Market Estimates and Forecast by Product, 2018 - 2030 (USD Million) (Volume Units)
- 8.3.9.3. Market Estimates and Forecast by Propulsion Type, 2018 - 2030 (USD Million)
- 8.3.9.4. Market Estimates and Forecast by Lifting Height, 2018 - 2030 (USD Million)
- 8.3.9.5. Market Estimates and Forecast by Application, 2018 - 2030 (USD Million)
- 8.3.10. Spain
- 8.3.10.1. Market Estimates and Forecast, 2018 - 2030 (USD Million) (Volume Units)
- 8.3.10.2. Market Estimates and Forecast by Product, 2018 - 2030 (USD Million) (Volume Units)
- 8.3.10.3. Market Estimates and Forecast by Propulsion Type, 2018 - 2030 (USD Million)
- 8.3.10.4. Market Estimates and Forecast by Lifting Height, 2018 - 2030 (USD Million)
- 8.3.10.5. Market Estimates and Forecast by Application, 2018 - 2030 (USD Million)
- 8.4. Asia Pacific
- 8.4.1. Market Estimates and Forecast, 2018 - 2030 (USD Million) (Volume Units)
- 8.4.2. Market Estimates and Forecast by Product, 2018 - 2030 (USD Million) (Volume Units)
- 8.4.3. Market Estimates and Forecast by Propulsion Type, 2018 - 2030 (USD Million)
- 8.4.4. Market Estimates and Forecast by Lifting Height, 2018 - 2030 (USD Million)
- 8.4.5. Market Estimates and Forecast by Application, 2018 - 2030 (USD Million)
- 8.4.6. China
- 8.4.6.1. Market Estimates and Forecast, 2018 - 2030 (USD Million) (Volume Units)
- 8.4.6.2. Market Estimates and Forecast by Product, 2018 - 2030 (USD Million) (Volume Units)
- 8.4.6.3. Market Estimates and Forecast by Propulsion Type, 2018 - 2030 (USD Million)
- 8.4.6.4. Market Estimates and Forecast by Lifting Height, 2018 - 2030 (USD Million)
- 8.4.6.5. Market Estimates and Forecast by Application, 2018 - 2030 (USD Million)
- 8.4.7. India
- 8.4.7.1. Market Estimates and Forecast, 2018 - 2030 (USD Million) (Volume Units)
- 8.4.7.2. Market Estimates and Forecast by Product, 2018 - 2030 (USD Million) (Volume Units)
- 8.4.7.3. Market Estimates and Forecast by Propulsion Type, 2018 - 2030 (USD Million)
- 8.4.7.4. Market Estimates and Forecast by Lifting Height, 2018 - 2030 (USD Million)
- 8.4.7.5. Market Estimates and Forecast by Application, 2018 - 2030 (USD Million)
- 8.4.8. Japan
- 8.4.8.1. Market Estimates and Forecast, 2018 - 2030 (USD Million) (Volume Units)
- 8.4.8.2. Market Estimates and Forecast by Product, 2018 - 2030 (USD Million) (Volume Units)
- 8.4.8.3. Market Estimates and Forecast by Propulsion Type, 2018 - 2030 (USD Million)
- 8.4.8.4. Market Estimates and Forecast by Lifting Height, 2018 - 2030 (USD Million)
- 8.4.8.5. Market Estimates and Forecast by Application, 2018 - 2030 (USD Million)
- 8.4.9. Australia
- 8.4.9.1. Market Estimates and Forecast, 2018 - 2030 (USD Million) (Volume Units)
- 8.4.9.2. Market Estimates and Forecast by Product, 2018 - 2030 (USD Million) (Volume Units)
- 8.4.9.3. Market Estimates and Forecast by Propulsion Type, 2018 - 2030 (USD Million)
- 8.4.9.4. Market Estimates and Forecast by Lifting Height, 2018 - 2030 (USD Million)
- 8.4.9.5. Market Estimates and Forecast by Application, 2018 - 2030 (USD Million)
- 8.4.10. South Korea
- 8.4.10.1. Market Estimates and Forecast, 2018 - 2030 (USD Million) (Volume Units)
- 8.4.10.2. Market Estimates and Forecast by Product, 2018 - 2030 (USD Million) (Volume Units)
- 8.4.10.3. Market Estimates and Forecast by Propulsion Type, 2018 - 2030 (USD Million)
- 8.4.10.4. Market Estimates and Forecast by Lifting Height, 2018 - 2030 (USD Million)
- 8.4.10.5. Market Estimates and Forecast by Application, 2018 - 2030 (USD Million)
- 8.5. Latin America
- 8.5.1. Market Estimates and Forecast, 2018 - 2030 (USD Million) (Volume Units)
- 8.5.2. Market Estimates and Forecast by Product, 2018 - 2030 (USD Million) (Volume Units)
- 8.5.3. Market Estimates and Forecast by Propulsion Type, 2018 - 2030 (USD Million)
- 8.5.4. Market Estimates and Forecast by Lifting Height, 2018 - 2030 (USD Million)
- 8.5.5. Market Estimates and Forecast by Application, 2018 - 2030 (USD Million)
- 8.5.6. Brazil
- 8.5.6.1. Market Estimates and Forecast, 2018 - 2030 (USD Million) (Volume Units)
- 8.5.6.2. Market Estimates and Forecast by Product, 2018 - 2030 (USD Million) (Volume Units)
- 8.5.6.3. Market Estimates and Forecast by Propulsion Type, 2018 - 2030 (USD Million)
- 8.5.6.4. Market Estimates and Forecast by Lifting Height, 2018 - 2030 (USD Million)
- 8.5.6.5. Market Estimates and Forecast by Application, 2018 - 2030 (USD Million)
- 8.5.7. Mexico
- 8.5.7.1. Market Estimates and Forecast, 2018 - 2030 (USD Million) (Volume Units)
- 8.5.7.2. Market Estimates and Forecast by Product, 2018 - 2030 (USD Million) (Volume Units)
- 8.5.7.3. Market Estimates and Forecast by Propulsion Type, 2018 - 2030 (USD Million)
- 8.5.7.4. Market Estimates and Forecast by Lifting Height, 2018 - 2030 (USD Million)
- 8.5.7.5. Market Estimates and Forecast by Application, 2018 - 2030 (USD Million)
- 8.5.8. Argentina
- 8.5.8.1. Market Estimates and Forecast, 2018 - 2030 (USD Million) (Volume Units)
- 8.5.8.2. Market Estimates and Forecast by Product, 2018 - 2030 (USD Million) (Volume Units)
- 8.5.8.3. Market Estimates and Forecast by Propulsion Type, 2018 - 2030 (USD Million)
- 8.5.8.4. Market Estimates and Forecast by Lifting Height, 2018 - 2030 (USD Million)
- 8.5.8.5. Market Estimates and Forecast by Application, 2018 - 2030 (USD Million)
- 8.6. Middle East & Africa
- 8.6.1. Market Estimates and Forecast, 2018 - 2030 (USD Million) (Volume Units)
- 8.6.2. Market Estimates and Forecast by Product, 2018 - 2030 (USD Million) (Volume Units)
- 8.6.3. Market Estimates and Forecast by Propulsion Type, 2018 - 2030 (USD Million)
- 8.6.4. Market Estimates and Forecast by Lifting Height, 2018 - 2030 (USD Million)
- 8.6.5. Market Estimates and Forecast by Application, 2018 - 2030 (USD Million)
- 8.6.6. U.A.E.
- 8.6.6.1. Market Estimates and Forecast, 2018 - 2030 (USD Million) (Volume Units)
- 8.6.6.2. Market Estimates and Forecast by Product, 2018 - 2030 (USD Million) (Volume Units)
- 8.6.6.3. Market Estimates and Forecast by Propulsion Type, 2018 - 2030 (USD Million)
- 8.6.6.4. Market Estimates and Forecast by Lifting Height, 2018 - 2030 (USD Million)
- 8.6.6.5. Market Estimates and Forecast by Application, 2018 - 2030 (USD Million)
- 8.6.7. Saudi Arabia
- 8.6.7.1. Market Estimates and Forecast, 2018 - 2030 (USD Million) (Volume Units)
- 8.6.7.2. Market Estimates and Forecast by Product, 2018 - 2030 (USD Million) (Volume Units)
- 8.6.7.3. Market Estimates and Forecast by Propulsion Type, 2018 - 2030 (USD Million)
- 8.6.7.4. Market Estimates and Forecast by Lifting Height, 2018 - 2030 (USD Million)
- 8.6.7.5. Market Estimates and Forecast by Application, 2018 - 2030 (USD Million)
- 8.6.8. South Africa
- 8.6.8.1. Market Estimates and Forecast, 2018 - 2030 (USD Million) (Volume Units)
- 8.6.8.2. Market Estimates and Forecast by Product, 2018 - 2030 (USD Million) (Volume Units)
- 8.6.8.3. Market Estimates and Forecast by Propulsion Type, 2018 - 2030 (USD Million)
- 8.6.8.4. Market Estimates and Forecast by Lifting Height, 2018 - 2030 (USD Million)
- 8.6.8.5. Market Estimates and Forecast by Application, 2018 - 2030 (USD Million)
Chapter 9. Competitive Landscape
- 9.1. Company Categorization
- 9.2. Company Market Ranking/Share Analysis, 2022
- 9.3. Company Heat Map Analysis
- 9.4. Strategy Mapping
- 9.5. Company Profiles (Overview, Financial Performance, Product Overview, Strategic Initiatives)
- 9.5.1. AICHI CORPORATION
- 9.5.2. Advance Lifts, Inc.
- 9.5.3. Altec Industries
- 9.5.4. Bronto Skylift
- 9.5.5. DINOLIFT OY
- 9.5.6. EdmoLift AB
- 9.5.7. HAULOTTE GROUP
- 9.5.8. JLG Industries
- 9.5.9. Linamar Corporation
- 9.5.10. MEC
- 9.5.11. RUNSHARE Heavy Industry Company, Ltd
- 9.5.12. Tadano Ltd.
- 9.5.13. Terex Corporation
- 9.5.14. WIESE USA
- 9.5.15. Zhejiang Dingli Machinery Co., Ltd. (DINGLI