|
|
市場調査レポート
商品コード
1224693
商用車の市場規模、シェア、動向分析レポート:製品別(LCV、大型トラック、バス、コーチ)、最終用途別(産業、鉱業、建設)、地域別、セグメント別予測、2023年~2030年Commercial Vehicles Market Size, Share & Trends Analysis Report By Product (LCVs, Heavy Trucks, Buses & Coaches), By End-use (Industrial, Mining & Construction), By Region, And Segment Forecasts, 2023 - 2030 |
||||||
|
|
|||||||
|
● お客様のご希望に応じて、既存データの加工や未掲載情報(例:国別セグメント)の追加などの対応が可能です。 詳細はお問い合わせください。 |
|||||||


| 商用車の市場規模、シェア、動向分析レポート:製品別(LCV、大型トラック、バス、コーチ)、最終用途別(産業、鉱業、建設)、地域別、セグメント別予測、2023年~2030年 |
|
出版日: 2023年01月06日
発行: Grand View Research
ページ情報: 英文 110 Pages
納期: 2~10営業日
|
- 全表示
- 概要
- 図表
- 目次
商用車市場の成長と動向
Grand View Research, Inc.の新しいレポートによると、世界の商用車市場規模は2030年までに1兆8500億米ドルに達すると予測されています。さらに、2023年から2030年にかけてCAGR3.7%で拡大すると予測されています。継続的なインフラ整備、建設業や鉱業の成長、それに伴う道路インフラの整備ニーズが、成長の原動力となることが予想されます。また、物流分野を劇的に変化させたeコマース産業の衰えぬ成長も、商用車の需要を押し上げると予想されます。
技術の進歩や、商用車へのテレマティクスや通信機能の継続的な搭載も、予測期間中の市場成長にとって良い兆候です。商用車への投資に意欲的な顧客は、融資、レンタル、リースなどの追加サービスを求めています。また、個別対応への要求が高まっていることも、市場で採用が進んでいる動向のひとつです。大企業や中堅企業も、特にリースソリューションにおいてカスタマイズされた金融取引を選択するようになってきています。
同時に、商用車の安全性の焦点は、事故の影響を軽減することから事故を防止することへと徐々に移行しています。そのため、お客様は事故の防止に役立つ新時代の安全機能を搭載した車両を選ぶようになってきています。COVID-19の大流行が、2020年の商用車需要に打撃を与えました。コロナウイルスの蔓延を阻止する取り組みの一環として世界各地で実施されたロックダウンは、製造業、自動車、娯楽、病院など、いくつかの業界や業種に影響を与えました。
しかし、2021年の世界の自動車生産台数は、ロックダウン手続き後の生産施設の再開に伴い、主に北米や欧州などの地域で生産台数が増加したことにより、前年比で増加しました。OICA(Organisation Internationale des Constructeursd'Automobiles)によると、世界の商用車生産台数は2020年の7762万1582台から2021年には8014万5988台と増加しました。様々な政府が徐々に規制を緩和し、社会的距離を置くなどの義務付けで事業を許可しており、中間層からの自動車需要が拡大しています。
北米は商用車市場の50%以上のシェアを占めており、これは自動車メーカーによる技術的に高度な商用車の開発への取り組みが活発化していることに起因しています。車両の操作性を向上させる新技術を取り入れることで、促進要因の安全性と経験を向上させることができます。また、顧客基盤を拡大するために、商用車メーカーは車両サービスの提供を開始し、流通ビジネスへの関与を強めています。
例えば、2022年9月、BMW AGマニュファクチャリングは米国に新しい物流施設を開設し、より持続可能でデジタルなオペレーションを明らかにしました。Xモデルのための物流センター」プロジェクトの一環として、ベックネル・インダストリアルは約100万平方フィートの施設を建設しました。このプロジェクトには1億円が投じられています。アジア太平洋地域は、建設・輸送セクターにおける商用車需要の増加により、商用車市場の著しい成長が見込まれています。そのため、この地域の主要企業は、このニーズに対応するための製品投入に注力しています。
例えば、タタ・モーターズ、2022年9月、商用車用5W30合成エンジンオイルを発売しました。BS6ディーゼルエンジンは、この新しいエンジンオイルでより良い性能を発揮します。5W30化学合成エンジンオイルは、可動部品間の摩擦を低減し、エンジン寿命を向上させることで、耐久性、信頼性、排ガス規制への適合性を向上させます。路上での稼働時間の向上は、運送業者にとって利益と収益の増加を意味します。
商用車市場のレポートハイライト
小型商用車(LCV)セグメントは、予測期間中に4.1%という最高のCAGRを記録すると推定されます。燃料価格の上昇と迅速な配送に対する高い需要により、消費者の嗜好が大型トラックから同一重量物輸送の小型商用車にシフトしている
物流分野は2022年に最大となり、予測期間中に5,561億7,000万米ドルに達すると予想されます。新興経済諸国における貿易活動の活発化と物流インフラの強化が、物流セグメントの成長を促進する主な要因の1つであると考えられる
2022年の商用車世界市場において、北米が最大の市場シェアを占めました。促進要因の安全と乗客の体験のための技術的に高度なソリューションの開発に注力するメーカーが、同地域の業界成長に寄与する主要な要因となっている
目次
第1章 調査手法と範囲
- 市場セグメンテーションと範囲
- 市場の定義
- 情報調達
- 購入したデータベース
- GVRの内部データベース
- 一次情報のリスト
- 二次情報一覧
- 情報分析
- データ分析モデル
- 市場形成とデータ可視化
- データの検証と公開
第2章 エグゼクティブサマリー
第3章 商用車市場の変数、動向、範囲
- 浸透と成長の見通しのマッピング
- 世界の商用車市場力学
- 市場促進要因分析
- 市場抑制要因分析
- 業界バリューチェーン分析
- 浸透と成長の見通しのマッピング
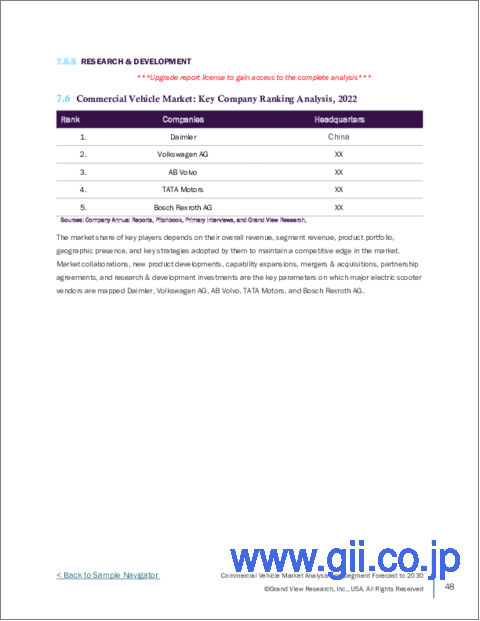
- 商用車市場の主要企業ランキング分析、2022年
- 市場分析ツール
- 商用車業界の分析- ポーターの5つの力
- 商用車業界分析-PEST分析
- COVID-19の商用車市場への影響
第4章 商用車市場:製品の見通し
- 市場規模の推計・予測、およびトレンド分析、2018~2030年(収益、USD Million)
- 小型商用車(LCV)
- 大型トラック
- バスとコーチ
第5章 商用車市場:最終用途の見通し
- 市場規模の推計・予測、およびトレンド分析、2018~2030年(収益、USD Million)
- 工業用
- 鉱業と建設
- ロジスティクス
- 旅客輸送
- その他
第6章 商用車市場:地域の見通し
- 商用車市場、地域別、2022年および2030年
- 北米
- 米国
- カナダ
- 欧州
- 英国
- ドイツ
- アジア太平洋地域
- 中国
- インド
- 日本
- ラテンアメリカ
- ブラジル
- メキシコ
- 中東とアフリカ
第7章 競合情勢
- Ashok Leyland Ltd
- 会社概要
- 財務実績
- 製品のベンチマーク
- 最近の開発
- Bosch Rexroth AG
- 会社概要
- 財務実績
- 製品のベンチマーク
- 最近の開発
- Daimler AG
- 会社概要
- 財務実績
- 製品のベンチマーク
- 最近の開発
- Volkswagen AG
- 会社概要
- 財務実績
- 製品のベンチマーク
- 最近の開発
- Toyota Motors Crop.
- 会社概要
- 財務実績
- 製品のベンチマーク
- 最近の開発
- Mahindra &Mahindra
- 会社概要
- 財務実績
- 製品のベンチマーク
- 最近の開発
- TATA Motors
- 会社概要
- 財務実績
- 製品のベンチマーク
- 最近の開発
- Volvo Trucks Corporation
- 会社概要
- 財務実績
- 製品のベンチマーク
- 最近の開発
- Xiamen Golden Dragon Bus Co.Ltd
- 会社概要
- 財務実績
- 製品のベンチマーク
- 最近の開発
- General Motors Company
- 会社概要
- 財務実績
- 製品のベンチマーク
- 最近の開発
List of Tables
- Table 1 List of Abbreviations
- Table 2 Vendor landscape, 2022
- Table 3 Commercial vehicles market - Industry snapshot & key buying criteria, 2018 - 2030 (USD Billion)
- Table 4 Light commercial vehicles (LCVs) market, 2018 - 2030 (USD Billion)
- Table 5 Heavy trucks market, 2018 - 2030 (USD Billion)
- Table 6 Buses & coaches market, 2018 - 2030 (USD Billion)
- Table 7 Industrial commercial vehicles market, 2018 - 2030 (USD Billion)
- Table 8 Mining & Construction commercial vehicles market, 2018 - 2030 (USD Billion)
- Table 9 Logistics commercial vehicles market, 2018 - 2030 (USD Billion)
- Table 10 Passenger Transportation commercial vehicles market, 2018 - 2030 (USD Billion)
- Table 11 Other commercial vehicles market, 2018 - 2030 (USD Billion)
- Table 12 North America commercial vehicles market, 2018 - 2030 (USD Billion)
- Table 13 North America commercial vehicles market, by product, 2018 - 2030 (USD Billion)
- Table 14 North America commercial vehicles market, by end-use, 2018 - 2030 (USD Billion)
- Table 15 U.S. commercial vehicles market, 2018 - 2030 (USD Billion)
- Table 16 U.S. commercial vehicles market, by product, 2018 - 2030 (USD Billion)
- Table 17 U.S. commercial vehicles market, by end-use, 2018 - 2030 (USD Billion)
- Table 18 Canada commercial vehicles market, 2018 - 2030 (USD Billion)
- Table 19 Canada commercial vehicles market, by product, 2018 - 2030 (USD Billion)
- Table 20 Canada commercial vehicles market, by end-use, 2018 - 2030 (USD Billion)
- Table 21 Europe commercial vehicles market, 2018 - 2030 (USD Billion)
- Table 22 Europe commercial vehicles market, by product, 2018 - 2030 (USD Billion)
- Table 23 Europe commercial vehicles market, by end-use, 2018 - 2030 (USD Billion)
- Table 24 U.K. commercial vehicles market, 2018 - 2030 (USD Billion)
- Table 25 U.K. commercial vehicles market, by product, 2018 - 2030 (USD Billion)
- Table 26 U.K. commercial vehicles market, by end-use, 2018 - 2030 (USD Billion)
- Table 27 Germany commercial vehicles market, 2018 - 2030 (USD Billion)
- Table 28 Germany commercial vehicles market, by product, 2018 - 2030 (USD Billion)
- Table 29 Germany commercial vehicles market, by end-use, 2018 - 2030 (USD Billion)
- Table 30 Asia Pacific commercial vehicles market, 2018 - 2030 (USD Billion)
- Table 31 Asia Pacific commercial vehicles market, by product, 2018 - 2030 (USD Billion)
- Table 32 Asia Pacific commercial vehicles market, by end-use, 2018 - 2030 (USD Billion)
- Table 33 China commercial vehicles market, 2018 - 2030 (USD Billion)
- Table 34 China commercial vehicles market, by product, 2018 - 2030 (USD Billion)
- Table 35 China commercial vehicles market, by end-use, 2018 - 2030 (USD Billion)
- Table 36 India commercial vehicles market, 2018 - 2030 (USD Billion)
- Table 37 India commercial vehicles market, by product, 2018 - 2030 (USD Billion)
- Table 38 India commercial vehicles market, by end-use, 2018 - 2030 (USD Billion)
- Table 39 Japan commercial vehicles market, 2018 - 2030 (USD Billion)
- Table 40 Japan commercial vehicles market, by product, 2018 - 2030 (USD Billion)
- Table 41 Japan commercial vehicles market, by end-use, 2018 - 2030 (USD Billion)
- Table 42 Latin America commercial vehicles market, 2018 - 2030 (USD Billion)
- Table 43 Latin America commercial vehicles market, by product, 2018 - 2030 (USD Billion)
- Table 44 Latin America commercial vehicles market, by end-use, 2018 - 2030 (USD Billion)
- Table 45 Brazil commercial vehicles market, 2018 - 2030 (USD Billion)
- Table 46 Brazil commercial vehicles market, by product, 2018 - 2030 (USD Billion)
- Table 47 Brazil commercial vehicles market, by end-use, 2018 - 2030 (USD Billion)
- Table 48 Mexico commercial vehicles market, 2018 - 2030 (USD Billion)
- Table 49 Mexico commercial vehicles market, by product, 2018 - 2030 (USD Billion)
- Table 50 Mexico commercial vehicles market, by end-use, 2018 - 2030 (USD Billion)
- Table 51 Middle East and Africa commercial vehicles market, 2018 - 2030 (USD Billion)
- Table 52 Middle East and Africa commercial vehicles market, by product, 2018 - 2030 (USD Billion)
- Table 53 Middle East and Africa commercial vehicles market, by end-use, 2018 - 2030 (USD Billion)
List of Figures
- Fig. 1 Commercial vehicles market, by 2022 (USD Billion)
- Fig. 2 Commercial vehicles market segmentation
- Fig. 3 Commercial vehicles market, 2018 - 2030 (USD Billion)
- Fig. 4 Value chain analysis
- Fig. 5 Commercial vehicles market dynamics
- Fig. 6 Commercial vehicles market driver impact
- Fig. 7 Safety belt usage for commercial vehicles
- Fig. 8 Commercial vehicles market challenge impact
- Fig. 9 Greenhouse gas emissions from vehicles
- Fig. 10 Crude oil prices, USD Barrel
- Fig. 11 Commercial vehicles market opportunity impact
- Fig. 12 Commercial vehicles penetration & growth prospects mapping
- Fig. 13 Commercial vehicles market - PEST analysis
- Fig. 14 Commercial vehicles - Emission standards
- Fig. 15 Commercial vehicles market, by product, 2018 & 2030
- Fig. 16 Commercial vehicles market, by end-use, 2018 & 2030
- Fig. 17 Commercial vehicles market, by region, 2018 & 2030
- Fig. 18 North America commercial vehicles market - Key takeaways
- Fig. 19 Europe commercial vehicles market - Key takeaways
- Fig. 20 Asia Pacific commercial vehicles market - Key takeaways
- Fig. 21 Latin America commercial vehicles market - Key takeaways
- Fig. 22 Middle East and Africa commercial vehicles market - Key takeaways
Commercial Vehicles :
The global commercial vehicles market size is expected to reach USD 1.85 trillion by 2030, according to a new report by Grand View Research, Inc. Furthermore, the industry is expected to expand at a CAGR of 3.7% from 2023 to 2030. Continued infrastructure development, the growth of the construction and mining industries, and the subsequent need for the development of road infrastructure are expected to drive the growth. The unabated growth of the e-commerce industry, which has drastically transformed the logistics sector, is also expected to drive the demand for commercial vehicles.
Advances in technology and the continued integration of telematics and communication capabilities into commercial vehicles also bode well for the growth of the market over the forecast period. Customers willing to invest in commercial vehicles are scouting for additional services, such as financing, rentals, and leasing. The growing demand for individualized solutions is another trend increasingly being adopted in the market. Large enterprises, along with medium-sized companies, are also opting for customized financial deals, especially in leasing solutions.
At the same time, the focus on safety in commercial vehicles is gradually shifting from reducing the impact of an accident to preventing an accident. Hence, customers are opting for vehicles equipped with new-age safety features that can potentially help prevent accidents. The outbreak of the COVID-19 pandemic took its toll on the demand for commercial vehicles in 2020. The lockdowns imposed in various parts of the world as part of the efforts to arrest the spread of coronavirus affected several industries and industry verticals, including manufacturing, automotive, entertainment, and hospitality.
However, the global automotive production volumes increased over the year in 2021, mainly due to the rising production volumes in North America and Europe, among other regions, as production facilities re-opened after lockdown procedures. According to the Organisation Internationale des Constructeursd' Automobiles (OICA), global commercial vehicle production increased from 77,621,582 units in 2020 to 80,145,988 units in 2021. Various governments are gradually relaxing the restrictions and allowing businesses to operate with mandates, such as social distancing; and the demand for cars from the middle-class population is growing.
North America holds more than 50% share of the commercial market, attributed to the increased initiatives taken by automakers to develop technologically advanced commercial vehicles. The incorporation of new technologies to improve vehicular maneuverability enhances drivers' safety and experience. Besides, to increase the customer base, commercial vehicle manufacturers have started providing vehicle services and increasing their involvement in the distribution business.
For instance, in September 2022, BMW AG Manufacturing opened a new logistics facility in the U.S., revealing a more sustainable, digital operation. As part of its Logistics Center for X models project, Becknell Industrial constructed a nearly one million square foot facility. The project involves an investment of 100 million. The Asia Pacific region is expected to witness significant growth in the commercial vehicle market due to an increase in demand for commercial vehicles in the construction and transportation sector. Thus, key regional players are focusing on product launches to address the need.
For instance, Tata Motors, September 2022, launched the 5W30 synthetic engine oil for commercial vehicles. BS6 diesel engines perform better with the new engine oil. The 5W30 synthetic engine oil improves durability, reliability, and emission compliance by reducing friction between moving parts and enhancing engine life. Increased uptime on the road means greater profits and revenues for the transporter.
Commercial Vehicles :
- The light commercial vehicles (LCVs) segment is estimated to register the highest CAGR of 4.1% during the forecast period. Increased fuel prices and high demand for faster delivery have shifted consumers' preference from heavy-duty trucks to light commercial vehicles for same-weight logistics
- The logistics segment was the largest in 2022 and is anticipated to reach USD 556.17 billion during the forecast period. The growing trade activities in developing economies, coupled with the strengthening logistics infrastructure, are some of the prime factors that are expected to drive the growth of the logistics segment
- North America held the largest market share in global commercial vehicles in 2022. Manufacturers focusing on developing technologically advanced solutions for drivers' safety and passengers' experience is the key factor contributing to the industry's growth in the region
Table of Contents
Chapter 1. Methodology and Scope
- 1.1. Market Segmentation & Scope
- 1.2. Market Definition
- 1.3. Information Procurement
- 1.3.1. Purchased Database
- 1.3.2. GVR's Internal Database
- 1.3.3. List of Primary Sources
- 1.3.4. List of Secondary Sources
- 1.4. Information Analysis
- 1.4.1. Data Analysis Model
- 1.5. Market Formulation & Data Visualization
- 1.6. Data Validation & Publishing
Chapter 2. Executive Summary
Chapter 3. Commercial Vehicle Market Variables, Trends & Scope
- 3.1. Penetration and Growth Prospect Mapping
- 3.2. Global Commercial Vehicle Market Dynamics
- 3.2.1. Market Driver Analysis
- 3.2.2. Market Restraints Analysis
- 3.3. Industry Value Chain Analysis
- 3.4. Penetration and Growth Prospect Mapping
- 3.5. Commercial Vehicle Market Key Company Ranking Analysis, 2022
- 3.6. Market Analysis Tools
- 3.6.1. Commercial Vehicle Industry Analysis - Porter's Five Forces
- 3.6.2. Commercial Vehicle Industry Analysis - PEST Analysis
- 3.7. Impact of COVID-19 on the Commercial Vehicle Market
Chapter 4. Commercial Vehicle Market: Product Outlook
- 4.1. Market Size Estimates & Forecasts And Trend Analysis, 2018 - 2030 (Revenue, USD Million)
- 4.2. Light Commercial Vehicles (LCVs)
- 4.2.1. Market Estimates And Forecasts By Region, 2018 - 2030 (Revenue, USD Million)
- 4.3. Heavy Trucks
- 4.3.1. Market Estimates And Forecasts By Region, 2018 - 2030 (Revenue, USD Million)
- 4.4. Buses & Coaches
- 4.4.1. Market Estimates And Forecasts By Region, 2018 - 2030 (Revenue, USD Million)
Chapter 5. Commercial Vehicle Market: End Use Outlook
- 5.1. Market Size Estimates & Forecasts And Trend Analysis, 2018 - 2030 (Revenue, USD Million)
- 5.2. Industrial
- 5.2.1. Market Estimates And Forecasts By Region, 2018 - 2030 (Revenue, USD Million)
- 5.3. Mining & Construction
- 5.3.1. Market Estimates And Forecasts By Region, 2018 - 2030 (Revenue, USD Million)
- 5.4. Logistics
- 5.4.1. Market Estimates And Forecasts By Region, 2018 - 2030 (Revenue, USD Million)
- 5.5. Passenger Transportation
- 5.5.1. Market Estimates And Forecasts By Region, 2018 - 2030 (Revenue, USD Million)
- 5.6. Others
- 5.6.1. Market Estimates And Forecasts By Region, 2018 - 2030 (Revenue, USD Million)
Chapter 6. Commercial Vehicle Market: Regional Outlook
- 6.1. Commercial Vehicle Market, By Region, 2022 & 2030
- 6.2. North America
- 6.2.1. Market Estimates And Forecasts By Product, 2018 - 2030 (Revenue, USD Million)
- 6.2.2. Market Estimates And Forecasts By End Use, 2018 - 2030 (Revenue, USD Million)
- 6.2.3. U.S.
- 6.2.3.1. Market Estimates And Forecasts By Product, 2018 - 2030 (Revenue, USD Million)
- 6.2.3.2. Market Estimates And Forecasts By End Use, 2018 - 2030 (Revenue, USD Million)
- 6.2.4. Canada
- 6.2.4.1. Market Estimates And Forecasts By Product, 2018 - 2030 (Revenue, USD Million)
- 6.2.4.2. Market Estimates And Forecasts By End Use, 2018 - 2030 (Revenue, USD Million)
- 6.3. Europe
- 6.3.1. Market Estimates And Forecasts By Product, 2018 - 2030 (Revenue, USD Million)
- 6.3.2. Market Estimates And Forecasts By End Use, 2018 - 2030 (Revenue, USD Million)
- 6.3.3. U.K.
- 6.3.3.1. Market Estimates And Forecasts By Product, 2018 - 2030 (Revenue, USD Million)
- 6.3.3.2. Market Estimates And Forecasts By End Use, 2018 - 2030 (Revenue, USD Million)
- 6.3.4. Germany
- 6.3.4.1. Market Estimates And Forecasts By Product, 2018 - 2030 (Revenue, USD Million)
- 6.3.4.2. Market Estimates And Forecasts By End Use, 2018 - 2030 (Revenue, USD Million)
- 6.4. Asia Pacific
- 6.4.1. Market Estimates And Forecasts By Product, 2018 - 2030 (Revenue, USD Million)
- 6.4.2. Market Estimates And Forecasts By End Use, 2018 - 2030 (Revenue, USD Million)
- 6.4.3. China
- 6.4.3.1. Market Estimates And Forecasts By Product, 2018 - 2030 (Revenue, USD Million)
- 6.4.3.2. Market Estimates And Forecasts By End Use, 2018 - 2030 (Revenue, USD Million)
- 6.4.4. India
- 6.4.4.1. Market Estimates And Forecasts By Product, 2018 - 2030 (Revenue, USD Million)
- 6.4.4.2. Market Estimates And Forecasts By End Use, 2018 - 2030 (Revenue, USD Million)
- 6.4.5. Japan
- 6.4.5.1. Market Estimates And Forecasts By Product, 2018 - 2030 (Revenue, USD Million)
- 6.4.5.2. Market Estimates And Forecasts By End Use, 2018 - 2030 (Revenue, USD Million)
- 6.5. Latin America
- 6.5.1. Market Estimates And Forecasts By Product, 2018 - 2030 (Revenue, USD Million)
- 6.5.2. Market Estimates And Forecasts By End Use, 2018 - 2030 (Revenue, USD Million)
- 6.5.3. Brazil
- 6.5.3.1. Market Estimates And Forecasts By Product, 2018 - 2030 (Revenue, USD Million)
- 6.5.3.2. Market Estimates And Forecasts By End Use, 2018 - 2030 (Revenue, USD Million)
- 6.5.4. Mexico
- 6.5.4.1. Market Estimates And Forecasts By Product, 2018 - 2030 (Revenue, USD Million)
- 6.5.4.2. Market Estimates And Forecasts By End Use, 2018 - 2030 (Revenue, USD Million)
- 6.6. Middle East And Africa
- 6.6.1. Market Estimates And Forecasts By Product, 2018 - 2030 (Revenue, USD Million)
- 6.6.2. Market Estimates And Forecasts By End Use, 2018 - 2030 (Revenue, USD Million)
Chapter 7. Competitive Landscape
- 7.1. Ashok Leyland Ltd
- 7.1.1. Company Overview
- 7.1.2. Financial Performance
- 7.1.3. Product Benchmarking
- 7.1.4. Recent Developments
- 7.2. Bosch Rexroth AG
- 7.2.1. Company Overview
- 7.2.2. Financial Performance
- 7.2.3. Product Benchmarking
- 7.2.4. Recent Developments
- 7.3. Daimler AG
- 7.3.1. Company Overview
- 7.3.2. Financial Performance
- 7.3.3. Product Benchmarking
- 7.3.4. Recent Developments
- 7.4. Volkswagen AG
- 7.4.1. Company Overview
- 7.4.2. Financial Performance
- 7.4.3. Product Benchmarking
- 7.4.4. Recent Developments
- 7.5. Toyota Motors Crop.
- 7.5.1. Company Overview
- 7.5.2. Financial Performance
- 7.5.3. Product Benchmarking
- 7.5.4. Recent Developments
- 7.6. Mahindra & Mahindra
- 7.6.1. Company Overview
- 7.6.2. Financial Performance
- 7.6.3. Product Benchmarking
- 7.6.4. Recent Developments
- 7.7. TATA Motors
- 7.7.1. Company Overview
- 7.7.2. Financial Performance
- 7.7.3. Product Benchmarking
- 7.7.4. Recent Developments
- 7.8. Volvo Trucks Corporation
- 7.8.1. Company Overview
- 7.8.2. Financial Performance
- 7.8.3. Product Benchmarking
- 7.8.4. Recent Developments
- 7.9. Xiamen Golden Dragon Bus Co.Ltd
- 7.9.1. Company Overview
- 7.9.2. Financial Performance
- 7.9.3. Product Benchmarking
- 7.9.4. Recent Developments
- 7.10. General Motors Company
- 7.10.1. Company Overview
- 7.10.2. Financial Performance
- 7.10.3. Product Benchmarking
- 7.10.4. Recent Developments