|
|
市場調査レポート
商品コード
1701379
免疫測定法の市場規模、シェア、動向分析レポート:製品別、技術別、用途別、検体別、最終用途別、地域別、セグメント別予測、2025年~2030年Immunoassay Market Size, Share & Trends Analysis Report By Product, By Technology, By Application, By Specimen, By End-use, By Region, And Segment Forecasts, 2025 - 2030 |
||||||
|
|||||||
カスタマイズ可能
|
|||||||

| 免疫測定法の市場規模、シェア、動向分析レポート:製品別、技術別、用途別、検体別、最終用途別、地域別、セグメント別予測、2025年~2030年 |
|
出版日: 2025年03月25日
発行: Grand View Research
ページ情報: 英文 190 Pages
納期: 2~10営業日
|

全表示
- 概要
- 図表
- 目次
免疫測定法市場の成長と動向
Grand View Research, Inc.の最新レポートによると、世界の免疫測定法市場規模は2025~2030年にかけてCAGR 4.59%を記録し、2030年には351億米ドルに達すると予測されています。
PoC迅速検査や自動免疫測定法分析装置の導入が市場成長を後押ししています。また、慢性疾患や感染症の増加が高い市場成長につながっています。
米国がん協会によると、2020年のがん患者/生存者数は推定1,690万人です。米国国立がんラボ2019年データによると、米国では約180万人のがん患者が診断されました。米国がん協会によると、2019年にがんが原因で約60万6,880人が死亡しました。このように、がんと診断される症例数の増加が免疫測定法の需要を促進しています。これは、今後数年間の市場成長を押し上げると予想されます。
さらに、感染症や予防対策に関する意識の高まりが、迅速診断検査製品への高い需要につながり、売上を伸ばしています。WHOによるWorld malaria report 2018の調査によると、メーカーは2017年にラテラルフローアッセイの売上高を2億7,600万と報告しています。また、2017年にサハラ以南のアフリカで約75.0%のマラリア症例がラテラルフローアッセイを用いて診断されたことも報告されています。
いくつかのスマートフォンベースの機器や関連ツールが次世代のポイントオブケア診断や検査機器として登場し、市場の成長を後押ししています。例えば、心筋梗塞における心筋トロポニンiの迅速検査には、スマートフォンアプリケーションと自律型キャピラリーマイクロ流体チップの組み合わせが用いられています。このプラットフォームは、資源が限られた環境でも容易に使用でき、12分以内に検査結果を得ることができます。このように、新技術の進歩は予測期間中、市場をさらに牽引すると予想されます。
米国におけるAptioオートメーション付きAtellica免疫測定法ソリューションの最初の導入は、2018年4月にSiemens医療GmbHによって発表されました。この製品の目的は、米国で先進技術製品を普及させるために設計されました。2020年12月、Danaherの事業であるBeckman Coulterは、COVID-19抗原検出のための最初の高品質だけでなくスループットアッセイを発表し、正式名称はAccess SARS-CoV-2 Antigen assayとなりました。2018年7月、Cygnus TechnologiesとGyros Protein Technologiesは、バイオ治療毒素を同定する免疫測定法を製造するために提携しました。両社の戦略的提携は、主にバイオ分析ソリューションの提供とバイオ治療製造の効率化に重点を置きます。
免疫測定法市場レポートハイライト
- 2024年には、個別化医療と疾患に対する標的療法の需要増に牽引され、キットと試薬が66.10%のシェアで市場を牽引。しかし、免疫測定法セグメントのソフトウェアとサービスは、予測期間中に最も速いCAGRで成長すると予測されており、臨床と研究用途の検査サービスを提供しています。
- 免疫測定法産業における感染症アプリケーションのシェアは66.10%で市場をリードし、予測期間中のCAGRは5.43%と予測されます。腫瘍学と自己免疫疾患は予測期間中に著しい成長が予測されています。
- 酵素免疫測定法は、個別化医療、がん診断、心血管疾患検査、感染症検出を中心に、2024年には63.90%の市場シェアを確保しました。しかし、その他セグメントは予測期間中に最も速いCAGRで成長すると予測されています。
- 血液は2024年に41.54%の最大市場シェアを占め、免疫測定法の実施に使用される最大の検体です。尿は、その非侵襲性、採取の容易さ、疾病診断への広範な応用により、予測期間中に最も急成長するセグメントとなる見込みです。
- 2024年、免疫測定法産業における病院のシェアは32.54%。その他は予測期間中にCAGR 5.45%で成長すると予測されています。
- 北米の免疫測定法市場は2024年に47.43%で最大の売上シェアを占めたが、これは主に強固な医療システム、慢性疾患の高い発生率、新しい診断技術に対する意識の高まりに支えられています。アジア太平洋は、医療改革、インフラ強化、大規模な患者プールに後押しされ、最も速いCAGRを記録すると見られています。
目次
第1章 調査手法と範囲
第2章 エグゼクティブサマリー
第3章 免疫測定法市場の変数、動向、範囲
- 市場イントロダクション/系統展望
- 市場規模と成長展望
- 市場力学
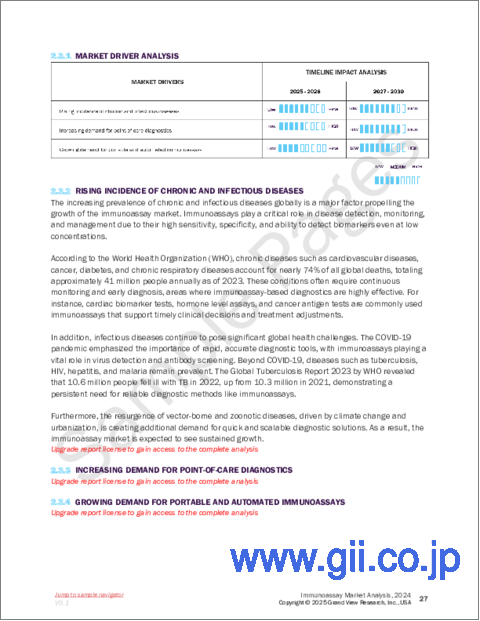
- 市場促進要因分析
- 市場抑制要因分析
- 免疫測定法市場分析ツール
- ポーターのファイブフォース分析
- PESTEL分析
第4章 免疫測定法市場:製品別、推定・動向分析
- 免疫測定法市場:製品変動分析
- 製品別2024年と2030年
- アッセイ、キット、試薬
- ELISA試薬とキット
- 迅速検査試薬・キット
- ELISPOT試薬とキット
- ウェスタンブロット試薬とキット
- その他の試薬とキット
- 分析装置/計測器
- オープンエンドシステム
- クローズドエンドシステム
- ソフトウェアとサービス
第5章 免疫測定法市場:用途別、推定・動向分析
- 免疫測定法市場:用途変動分析
- 用途別2024年と2030年
- 治療物モニタリング
- 腫瘍学
- 心臓病学
- 内分泌学
- 感染症検査
- 自己免疫疾患
- その他
第6章 免疫測定法市場:技術別、推定・動向分析
- 免疫測定法市場:技術変動分析
- 2024年と2030年の技術
- ラジオ免疫測定法(RIA)
- 酵素免疫測定法(EIA)
- 化学発光免疫測定法(CLIA)
- 蛍光免疫測定法(FIA)
- 迅速検査
- その他
第7章 免疫測定法市場:検体別、推定・動向分析
- 免疫測定法市場:検体変動分析
- サンプル別2024年と2030年
- 血液
- 唾液
- 尿
- その他
第8章 免疫測定法市場:最終用途別、推定・動向分析
- 免疫測定法市場:最終用途変動分析
- 2024年と2030年の最終用途別
- 病院
- 血液バンク
- 臨床検査室
- 製薬とバイオテクノロジー企業
- 学術研究センター
- その他
第9章 免疫測定法市場:地域別、推定・動向分析
- 免疫測定法市場シェア、地域別、2024年と2030年
- 北米
- 米国
- カナダ
- メキシコ
- 欧州
- 英国
- ドイツ
- フランス
- イタリア
- スペイン
- デンマーク
- スウェーデン
- ノルウェー
- アジア太平洋
- 日本
- 中国
- インド
- オーストラリア
- 韓国
- タイ
- ラテンアメリカ
- ブラジル
- アルゼンチン
- 中東・アフリカ
- 南アフリカ
- サウジアラビア
- アラブ首長国連邦
- クウェート
第10章 競合情勢
- 主要市場参入企業による最近の動向と影響分析
- 企業分類
- 企業ヒートマップ分析
- 企業プロファイル
- Abbott
- Siemens Healthineers AG
- Danaher Corporation(Beckman Coulter)
- bioMerieux SA
- Quidel Corporation
- Sysmex Corporation
- Ortho Clinical Diagnostics
- Bio-Rad Laboratories, Inc.
- F. Hoffmann-La Roche AG
- Becton, Dickinson, and Company
- Thermo Fisher Scientific, Inc.
List of Tables
- Table 1 List of abbreviation
- Table 2 Global immunoassay market, by region, 2018 - 2030 (USD Million)
- Table 3 Global immunoassay market, by product, 2018 - 2030 (USD Million)
- Table 4 Global immunoassay market, by technology, 2018 - 2030 (USD Million)
- Table 5 Global immunoassay market, by application, 2018 - 2030 (USD Million)
- Table 6 Global immunoassay market, by specimen, 2018 - 2030 (USD Million)
- Table 7 Global immunoassay market, by end-use, 2018 - 2030 (USD Million)
- Table 8 North America immunoassay market, by country, 2018 - 2030 (USD Million)
- Table 9 North America immunoassay market, by product, 2018 - 2030 (USD Million)
- Table 10 North America immunoassay market, by application, 2018 - 2030 (USD Million)
- Table 11 North America immunoassay market, by technology, 2018 - 2030 (USD Million)
- Table 12 North America immunoassay market, by specimen, 2018 - 2030 (USD Million)
- Table 13 North America immunoassay market, by end-use, 2018 - 2030 (USD Million)
- Table 14 U.S. immunoassay market, by product, 2018 - 2030 (USD Million)
- Table 15 U.S. immunoassay market, by application, 2018 - 2030 (USD Million)
- Table 16 U.S. immunoassay market, by technology, 2018 - 2030 (USD Million)
- Table 17 U.S. immunoassay market, by specimen, 2018 - 2030 (USD Million)
- Table 18 U.S. immunoassay market, by end-use, 2018 - 2030 (USD Million)
- Table 19 Canada immunoassay market, by product, 2018 - 2030 (USD Million)
- Table 20 Canada immunoassay market, by application, 2018 - 2030 (USD Million)
- Table 21 Canada immunoassay market, by technology, 2018 - 2030 (USD Million)
- Table 22 Canada immunoassay market, by specimen, 2018 - 2030 (USD Million)
- Table 23 Canada immunoassay market, by end-use, 2018 - 2030 (USD Million)
- Table 24 Mexico immunoassay market, by product, 2018 - 2030 (USD Million)
- Table 25 Mexico immunoassay market, by application, 2018 - 2030 (USD Million)
- Table 26 Mexico immunoassay market, by technology, 2018 - 2030 (USD Million)
- Table 27 Mexico immunoassay market, by specimen, 2018 - 2030 (USD Million)
- Table 28 Mexico immunoassay market, by end-use, 2018 - 2030 (USD Million)
- Table 29 Europe immunoassay market, by country, 2018 - 2030 (USD Million)
- Table 30 Europe immunoassay market, by product, 2018 - 2030 (USD Million)
- Table 31 Europe immunoassay market, by application, 2018 - 2030 (USD Million)
- Table 32 Europe immunoassay market, by technology, 2018 - 2030 (USD Million)
- Table 33 Europe immunoassay market, by specimen, 2018 - 2030 (USD Million)
- Table 34 Europe immunoassay market, by end-use, 2018 - 2030 (USD Million)
- Table 35 UK immunoassay market, by product, 2018 - 2030 (USD Million)
- Table 36 UK immunoassay market, by application, 2018 - 2030 (USD Million)
- Table 37 UK immunoassay market, by technology, 2018 - 2030 (USD Million)
- Table 38 UK immunoassay market, by specimen, 2018 - 2030 (USD Million)
- Table 39 UK immunoassay market, by end-use, 2018 - 2030 (USD Million)
- Table 40 Germany immunoassay market, by product, 2018 - 2030 (USD Million)
- Table 41 Germany immunoassay market, by application, 2018 - 2030 (USD Million)
- Table 42 Germany immunoassay market, by technology, 2018 - 2030 (USD Million)
- Table 43 Germany immunoassay market, by specimen, 2018 - 2030 (USD Million)
- Table 44 Germany immunoassay market, by end-use, 2018 - 2030 (USD Million)
- Table 45 France immunoassay market, by product, 2018 - 2030 (USD Million)
- Table 46 France immunoassay market, by application, 2018 - 2030 (USD Million)
- Table 47 France immunoassay market, by technology, 2018 - 2030 (USD Million)
- Table 48 France immunoassay market, by specimen, 2018 - 2030 (USD Million)
- Table 49 France immunoassay market, by end-use, 2018 - 2030 (USD Million)
- Table 50 Italy immunoassay market, by product, 2018 - 2030 (USD Million)
- Table 51 Italy immunoassay market, by application, 2018 - 2030 (USD Million)
- Table 52 Italy immunoassay market, by technology, 2018 - 2030 (USD Million)
- Table 53 Italy immunoassay market, by specimen, 2018 - 2030 (USD Million)
- Table 54 Italy immunoassay market, by end-use, 2018 - 2030 (USD Million)
- Table 55 Spain immunoassay market, by product, 2018 - 2030 (USD Million)
- Table 56 Spain immunoassay market, by application, 2018 - 2030 (USD Million)
- Table 57 Spain immunoassay market, by technology, 2018 - 2030 (USD Million)
- Table 58 Spain immunoassay market, by specimen, 2018 - 2030 (USD Million)
- Table 59 Spain immunoassay market, by end-use, 2018 - 2030 (USD Million)
- Table 60 Denmark immunoassay market, by product, 2018 - 2030 (USD Million)
- Table 61 Denmark immunoassay market, by application, 2018 - 2030 (USD Million)
- Table 62 Denmark immunoassay market, by technology, 2018 - 2030 (USD Million)
- Table 63 Denmark immunoassay market, by specimen, 2018 - 2030 (USD Million)
- Table 64 Denmark immunoassay market, by end-use, 2018 - 2030 (USD Million)
- Table 65 Sweden immunoassay market, by product, 2018 - 2030 (USD Million)
- Table 66 Sweden immunoassay market, by application, 2018 - 2030 (USD Million)
- Table 67 Sweden immunoassay market, by technology, 2018 - 2030 (USD Million)
- Table 68 Sweden immunoassay market, by specimen, 2018 - 2030 (USD Million)
- Table 69 Sweden immunoassay market, by end-use, 2018 - 2030 (USD Million)
- Table 70 Norway immunoassay market, by product, 2018 - 2030 (USD Million)
- Table 71 Norway immunoassay market, by application, 2018 - 2030 (USD Million)
- Table 72 Norway immunoassay market, by technology, 2018 - 2030 (USD Million)
- Table 73 Norway immunoassay market, by specimen, 2018 - 2030 (USD Million)
- Table 74 Norway immunoassay market, by end-use, 2018 - 2030 (USD Million)
- Table 75 Asia Pacific immunoassay market, by country, 2018 - 2030 (USD Million)
- Table 76 Asia Pacific immunoassay market, by product, 2018 - 2030 (USD Million)
- Table 77 Asia Pacific immunoassay market, by application, 2018 - 2030 (USD Million)
- Table 78 Asia Pacific immunoassay market, by technology, 2018 - 2030 (USD Million)
- Table 79 Asia Pacific immunoassay market, by specimen, 2018 - 2030 (USD Million)
- Table 80 Asia Pacific immunoassay market, by end-use, 2018 - 2030 (USD Million)
- Table 81 Japan immunoassay market, by product, 2018 - 2030 (USD Million)
- Table 82 Japan immunoassay market, by application, 2018 - 2030 (USD Million)
- Table 83 Japan immunoassay market, by technology, 2018 - 2030 (USD Million)
- Table 84 Japan immunoassay market, by specimen, 2018 - 2030 (USD Million)
- Table 85 Japan immunoassay market, by end-use, 2018 - 2030 (USD Million)
- Table 86 China immunoassay market, by product, 2018 - 2030 (USD Million)
- Table 87 China immunoassay market, by specimen, 2018 - 2030 (USD Million)
- Table 88 China immunoassay market, by application, 2018 - 2030 (USD Million)
- Table 89 China immunoassay market, by technology, 2018 - 2030 (USD Million)
- Table 90 China immunoassay market, by end-use, 2018 - 2030 (USD Million)
- Table 91 India immunoassay market, by product, 2018 - 2030 (USD Million)
- Table 92 India immunoassay market, by application, 2018 - 2030 (USD Million)
- Table 93 India immunoassay market, by technology, 2018 - 2030 (USD Million)
- Table 94 India immunoassay market, by specimen, 2018 - 2030 (USD Million)
- Table 95 India immunoassay market, by end-use, 2018 - 2030 (USD Million)
- Table 96 Australia immunoassay market, by product, 2018 - 2030 (USD Million)
- Table 97 Australia immunoassay market, by application, 2018 - 2030 (USD Million)
- Table 98 Australia immunoassay market, by technology, 2018 - 2030 (USD Million)
- Table 99 Australia immunoassay market, by specimen, 2018 - 2030 (USD Million)
- Table 100 Australia immunoassay market, by end-use, 2018 - 2030 (USD Million)
- Table 101 South Korea immunoassay market, by product, 2018 - 2030 (USD Million)
- Table 102 South Korea immunoassay market, by application, 2018 - 2030 (USD Million)
- Table 103 South Korea immunoassay market, by technology, 2018 - 2030 (USD Million)
- Table 104 South Korea immunoassay market, by specimen, 2018 - 2030 (USD Million)
- Table 105 South Korea immunoassay market, by end-use, 2018 - 2030 (USD Million)
- Table 106 Thailand immunoassay market, by product, 2018 - 2030 (USD Million)
- Table 107 Thailand immunoassay market, by application, 2018 - 2030 (USD Million)
- Table 108 Thailand immunoassay market, by technology, 2018 - 2030 (USD Million)
- Table 109 Thailand immunoassay market, by specimen, 2018 - 2030 (USD Million)
- Table 110 Thailand immunoassay market, by end-use, 2018 - 2030 (USD Million)
- Table 111 Latin America immunoassay market, by country, 2018 - 2030 (USD Million)
- Table 112 Latin America immunoassay market, by product, 2018 - 2030 (USD Million)
- Table 113 Latin America immunoassay market, by application, 2018 - 2030 (USD Million)
- Table 114 Latin America immunoassay market, by technology, 2018 - 2030 (USD Million)
- Table 115 Latin America immunoassay market, by specimen, 2018 - 2030 (USD Million)
- Table 116 Latin America immunoassay market, by end-use, 2018 - 2030 (USD Million)
- Table 117 Brazil immunoassay market, by product, 2018 - 2030 (USD Million)
- Table 118 Brazil immunoassay market, by application, 2018 - 2030 (USD Million)
- Table 119 Brazil immunoassay market, by technology, 2018 - 2030 (USD Million)
- Table 120 Brazil immunoassay market, by specimen, 2018 - 2030 (USD Million)
- Table 121 Brazil immunoassay market, by end-use, 2018 - 2030 (USD Million)
- Table 122 Argentina immunoassay market, by product, 2018 - 2030 (USD Million)
- Table 123 Argentina immunoassay market, by application, 2018 - 2030 (USD Million)
- Table 124 Argentina immunoassay market, by technology, 2018 - 2030 (USD Million)
- Table 125 Argentina immunoassay market, by specimen, 2018 - 2030 (USD Million)
- Table 126 Argentina immunoassay market, by end-use, 2018 - 2030 (USD Million)
- Table 127 MEA immunoassay market, by country, 2018 - 2030 (USD Million)
- Table 128 MEA immunoassay market, by product, 2018 - 2030 (USD Million)
- Table 129 MEA immunoassay market, by application, 2018 - 2030 (USD Million)
- Table 130 MEA immunoassay market, by technology, 2018 - 2030 (USD Million)
- Table 131 MEA immunoassay market, by specimen, 2018 - 2030 (USD Million)
- Table 132 MEA immunoassay market, by end-use, 2018 - 2030 (USD Million)
- Table 133 South Africa immunoassay market, by product, 2018 - 2030 (USD Million)
- Table 134 South Africa immunoassay market, by application, 2018 - 2030 (USD Million)
- Table 135 South Africa immunoassay market, by technology, 2018 - 2030 (USD Million)
- Table 136 South Africa immunoassay market, by specimen, 2018 - 2030 (USD Million)
- Table 137 South Africa immunoassay market, by end-use, 2018 - 2030 (USD Million)
- Table 138 Saudi Arabia immunoassay market, by product, 2018 - 2030 (USD Million)
- Table 139 Saudi Arabia immunoassay market, by application, 2018 - 2030 (USD Million)
- Table 140 Saudi Arabia immunoassay market, by technology, 2018 - 2030 (USD Million)
- Table 141 Saudi Arabia immunoassay market, by specimen, 2018 - 2030 (USD Million)
- Table 142 Saudi Arabia immunoassay market, by end-use, 2018 - 2030 (USD Million)
- Table 143 UAE immunoassay market, by product, 2018 - 2030 (USD Million)
- Table 144 UAE immunoassay market, by application, 2018 - 2030 (USD Million)
- Table 145 UAE immunoassay market, by technology, 2018 - 2030 (USD Million)
- Table 146 UAE immunoassay market, by specimen, 2018 - 2030 (USD Million)
- Table 147 UAE immunoassay market, by end-use, 2018 - 2030 (USD Million)
- Table 148 Kuwait immunoassay market, by product, 2018 - 2030 (USD Million)
- Table 149 Kuwait immunoassay market, by application, 2018 - 2030 (USD Million)
- Table 150 Kuwait immunoassay market, by technology, 2018 - 2030 (USD Million)
- Table 151 Kuwait immunoassay market, by specimen, 2018 - 2030 (USD Million)
- Table 152 Kuwait immunoassay market, by end-use, 2018 - 2030 (USD Million)
List of Figures
- Fig. 1 Immunoassay market segmentation
- Fig. 2 Data analysis models
- Fig. 3 Market formulation and validation
- Fig. 4 Data validating & publishing
- Fig. 5 Market research process
- Fig. 6 Information procurement
- Fig. 7 Primary research
- Fig. 8 Value-chain-based sizing & forecasting
- Fig. 9 QFD modelling for market share assessment
- Fig. 10 Market formulation & validation
- Fig. 11 Commodity flow analysis
- Fig. 12 Market outlook
- Fig. 13 Segment snapshot-1
- Fig. 14 Segment snapshot-2
- Fig. 15 Competitive landscape snapshot
- Fig. 16 Market trends & outlook
- Fig. 17 Porter's five force analysis
- Fig. 18 PESTEL analysis
- Fig. 19 Immunoassay market: Product outlook key takeaways
- Fig. 20 Immunoassay market: Product movement analysis
- Fig. 21 Assays, kits, and reagents market estimates and forecasts, 2018 - 2030 (USD Million)
- Fig. 22 ELISA Reagents & Kits market estimates and forecasts, 2018 - 2030 (USD Million)
- Fig. 23 Rapid Tests Reagents & Kits market estimates and forecasts, 2018 - 2030 (USD Million)
- Fig. 24 ELISPOT Reagents & Kits market estimates and forecasts, 2018 - 2030 (USD Million)
- Fig. 25 Western Blot Reagents & Kits market estimates and forecasts, 2018 - 2030 (USD Million)
- Fig. 26 Other Reagents & Kits market estimates and forecasts, 2018 - 2030 (USD Million)
- Fig. 27 Analyzers/Instruments and systems market estimates and forecasts, 2018 - 2030 (USD Million)
- Fig. 28 Software and services market estimates and forecasts, 2018 - 2030 (USD Million)
- Fig. 29 Open Ended Systems market estimates and forecasts, 2018 - 2030 (USD Million)
- Fig. 30 Closed Ended Systems market estimates and forecasts, 2018 - 2030 (USD Million)
- Fig. 31 Immunoassay market: Application outlook key takeaways
- Fig. 32 Immunoassay market: Application movement analysis
- Fig. 33 Therapeutic Drug Monitoring
- Fig. 34 Oncology market estimates and forecasts, 2018 - 2030 (USD Million)
- Fig. 35 Cardiology market estimates and forecasts, 2018 - 2030 (USD Million)
- Fig. 36 Endocrinology market estimates and forecasts, 2018 - 2030 (USD Million)
- Fig. 37 Infectious Disease Testing market estimates and forecasts, 2018 - 2030 (USD Million)
- Fig. 38 Autoimmune Diseases market estimates and forecasts, 2018 - 2030 (USD Million)
- Fig. 39 Others market estimates and forecasts, 2018 - 2030 (USD Million)
- Fig. 40 Immunoassay market: Technology outlook key takeaways
- Fig. 41 Immunoassay market: Technology movement analysis
- Fig. 42 Radioimmunoassay (RIA) market estimates and forecasts, 2018 - 2030 (USD Million)
- Fig. 43 Enzyme Immunoassays (EIA) market estimates and forecasts, 2018 - 2030 (USD Million)
- Fig. 44 Rapid Test market estimates and forecasts, 2018 - 2030 (USD Million)
- Fig. 45 Others market estimates and forecasts, 2018 - 2030 (USD Million)
- Fig. 46 Chemiluminescence Immunoassays (CLIA) market estimates and forecasts, 2018 - 2030 (USD Million)
- Fig. 47 Fluorescence Immunoassays (FIA) market estimates and forecasts, 2018 - 2030 (USD Million)
- Fig. 48 Immunoassay market: Specimen outlook key takeaways
- Fig. 49 Immunoassay market: Specimen movement analysis
- Fig. 50 Blood market estimates and forecasts, 2018 - 2030 (USD Million)
- Fig. 51 Saliva market estimates and forecasts, 2018 - 2030 (USD Million)
- Fig. 52 Urine market estimates and forecasts, 2018 - 2030 (USD Million)
- Fig. 53 Others market estimates and forecasts, 2018 - 2030 (USD Million)
- Fig. 54 Immunoassay market: End-use outlook key takeaways
- Fig. 55 Immunoassay market: End-use movement analysis
- Fig. 56 Hospitals market estimates and forecasts, 2018 - 2030 (USD Million)
- Fig. 57 Blood Banks market estimates and forecasts, 2018 - 2030 (USD Million)
- Fig. 58 Clinical Laboratories market estimates and forecasts, 2018 - 2030 (USD Million)
- Fig. 59 Pharmaceutical and Biotech Companies market estimates and forecasts, 2018 - 2030 (USD Million)
- Fig. 60 Academic Research Centers market estimates and forecasts, 2018 - 2030 (USD Million)
- Fig. 61 Others market estimates and forecasts, 2018 - 2030 (USD Million)
- Fig. 62 Regional marketplace outlook, 2024 & 2030 (USD Million)
- Fig. 63 Regional marketplace: Key takeaways
- Fig. 64 North America immunoassay market estimates and forecasts, 2018 - 2030 (USD Million)
- Fig. 65 Key country dynamics
- Fig. 66 U.S. immunoassay market estimates and forecasts, 2018 - 2030 (USD Million)
- Fig. 67 Key country dynamics
- Fig. 68 Canada immunoassay market estimates and forecasts, 2018 - 2030 (USD Million)
- Fig. 69 Key country dynamics
- Fig. 70 Mexico immunoassay market estimates and forecasts, 2018 - 2030 (USD Million)
- Fig. 71 Europe immunoassay market estimates and forecasts, 2018 - 2030 (USD Million)
- Fig. 72 Key country dynamics
- Fig. 73 UK immunoassay market estimates and forecasts, 2018 - 2030 (USD Million)
- Fig. 74 Key country dynamics
- Fig. 75 Germany immunoassay market estimates and forecasts, 2018 - 2030 (USD Million)
- Fig. 76 Key country dynamics
- Fig. 77 France immunoassay market estimates and forecasts, 2018 - 2030 (USD Million)
- Fig. 78 Key country dynamics
- Fig. 79 Spain immunoassay market estimates and forecasts, 2018 - 2030 (USD Million)
- Fig. 80 Key country dynamics
- Fig. 81 Italy immunoassay market estimates and forecasts, 2018 - 2030 (USD Million)
- Fig. 82 Key country dynamics
- Fig. 83 Denmark immunoassay market estimates and forecasts, 2018 - 2030 (USD Million)
- Fig. 84 Key country dynamics
- Fig. 85 Sweden immunoassay market estimates and forecasts, 2018 - 2030 (USD Million)
- Fig. 86 Key country dynamics
- Fig. 87 Norway immunoassay market estimates and forecasts, 2018 - 2030 (USD Million)
- Fig. 88 Asia Pacific immunoassay market estimates and forecasts, 2018 - 2030 (USD Million)
- Fig. 89 Key country dynamics
- Fig. 90 Japan immunoassay market estimates and forecasts, 2018 - 2030 (USD Million)
- Fig. 91 Key country dynamics
- Fig. 92 China immunoassay market estimates and forecasts, 2018 - 2030 (USD Million)
- Fig. 93 Key country dynamics
- Fig. 94 India immunoassay market estimates and forecasts, 2018 - 2030 (USD Million)
- Fig. 95 Key country dynamics
- Fig. 96 Australia immunoassay market estimates and forecasts, 2018 - 2030 (USD Million)
- Fig. 97 Key country dynamics
- Fig. 98 South Korea immunoassay market estimates and forecasts, 2018 - 2030 (USD Million)
- Fig. 99 Key country dynamics
- Fig. 100 Thailand immunoassay market estimates and forecasts, 2018 - 2030 (USD Million)
- Fig. 101 Key country dynamics
- Fig. 102 Market participant categorization
- Fig. 103 Immunoassay market position analysis, 2023
- Fig. 104 Strategic framework
Immunoassay Market Growth & Trends:
The global immunoassay market size is expected to reach USD 35.10 billion by 2030, registering a CAGR of 4.59% from 2025 to 2030, according to a new report by Grand View Research, Inc. The introduction of PoC rapid tests and automated immunoassay analyzers is boosting market growth. In addition, the rising number of chronic and infectious diseases is leading to high market growth.
According to the American Cancer Society, there were an estimated 16.9 million cancer patients/survivors in 2020. Around 1.8 million cancer cases were diagnosed in the U.S., according to the National Cancer Institute 2019 data. According to the American Cancer Society, nearly 606,880 deaths occurred due to cancer in the U.S. in 2019. Thus, the rise in the number of cancer cases being diagnosed is driving the demand for immunoassays. This is expected to boost the market growth in the coming years.
Furthermore, growing awareness regarding infectious diseases and preventive measures has led to a high demand for rapid diagnostic test products, thereby increasing sales. Based on a survey by the WHO on the World malaria report 2018, manufacturers reported sales of 276 million for lateral flow assays in 2017. It also reported that around 75.0% of malaria cases were diagnosed using lateral flow assays in sub-Saharan Africa in 2017.
Several smartphone-based devices and associated tools have emerged as next-generation point-of-care diagnostics or testing devices, thereby boosting the market growth. For instance, a smartphone application combined with the autonomous capillary microfluidic chip is used for the rapid testing of cardiac troponin I in myocardial infarction. This platform can be easily used in resource-limited settings, providing test results within 12 minutes. Thus, novel technological advancements are anticipated to further drive the market over the forecast period.
The first implementation of the Atellica immunoassay solutions with Aptio automation in the United States was announced by Siemens Healthcare GmbH in April 2018. The objective of this product was designed to promote advanced technological products in the U.S. In December 2020, Beckman Coulter, a Danaher business, introduced its first high-quality as well as throughput assay for the COVID-19 antigen detection, officially named Access SARS-CoV-2 Antigen assay. In July 2018, Cygnus Technologies and Gyros Protein Technologies collaborated to produce immunoassay to identify biotherapeutic toxins. The two companies' strategic alliance will primarily focus on offering bioanalytical solutions and increasing biotherapeutics manufacturing efficiencies.
Immunoassay Market Report Highlights:
- In 2024, kits and reagents led the market with a 66.10% share, driven by increasing demand for personalized medicine and targeted therapies for diseases. However, the software and services of the immunoassays segment is projected to grow at the fastest CAGR during the forecast period and are delivering testing services for clinical and research uses.
- The infectious disease application in the immunoassay industry led the market with a 66.10% share and is expected to grow at a CAGR of 5.43% over the forecast period. Oncology and autoimmune diseases are projected to grow at a significant growth during the forecast period.
- Enzyme immunoassays secured the dominant market share in 2024 of 63.90% focusing on personalized medicine, cancer diagnostics, cardiovascular disease testing, and infectious disease detection. However, the others segment is projected to grow at the fastest CAGR during the forecast period.
- Blood held the largest market share of 41.54% in 2024, being the largest specimen used for performing immunoassays. Urine is expected to be the fastest-growing segment over the forecast period, driven by its non-invasive nature, ease of collection, and widespread application in disease diagnostics.
- In 2024, the hospitals in the immunoassay industry held a 32.54% share. Others are projected to grow at a CAGR of 5.45% during the forecast period.
- North America immunoassay market held the largest revenue share at 47.43% in 2024, primarily supported by robust healthcare systems, a high incidence of chronic illnesses, and a growing awareness of new diagnostic technologies. Asia Pacific is set to record the fastest CAGR, propelled by healthcare reforms, infrastructure enhancements, and a large patient pool.
Table of Contents
Chapter 1. Methodology and Scope
- 1.1. Market Segmentation and Scope
- 1.2. Market Definitions
- 1.3. Research Methodology
- 1.3.1. Information Procurement
- 1.3.2. Information or Data Analysis
- 1.3.3. Market Formulation & Data Visualization
- 1.3.4. Data Validation & Publishing
- 1.4. Research Scope and Assumptions
- 1.4.1. List of Data Sources
Chapter 2. Executive Summary
- 2.1. Market Outlook
- 2.2. Segment Outlook
- 2.3. Competitive Insights
Chapter 3. Immunoassay Market Variables, Trends, & Scope
- 3.1. Market Introduction/Lineage Outlook
- 3.2. Market Size and Growth Prospects (USD Million)
- 3.3. Market Dynamics
- 3.3.1. Market Drivers Analysis
- 3.3.1.1. Rising incidence of chronic and infectious diseases
- 3.3.1.2. Increasing demand for point-of-care diagnostics
- 3.3.1.3. Growing demand for portable and automated immunoassays
- 3.3.2. Market Restraints Analysis
- 3.3.2.1. Lower detection limit
- 3.3.2.2. Limitations associated with immunoassay techniques
- 3.3.1. Market Drivers Analysis
- 3.4. Immunoassay Market Analysis Tools
- 3.4.1. Porter's Five Forces Analysis
- 3.4.1.1. Bargaining power of the suppliers
- 3.4.1.2. Bargaining power of the buyers
- 3.4.1.3. Threats of substitution
- 3.4.1.4. Threats from new entrants
- 3.4.1.5. Competitive rivalry
- 3.4.2. PESTEL Analysis
- 3.4.2.1. Political landscape
- 3.4.2.2. Economic and Social landscape
- 3.4.2.3. Technological landscape
- 3.4.2.4. Environmental landscape
- 3.4.2.5. Legal landscape
- 3.4.1. Porter's Five Forces Analysis
Chapter 4. Immunoassay Market: Product Estimates & Trend Analysis
- 4.1. Immunoassay Market: Product Movement Analysis
- 4.2. Immunoassay Market Estimates and Forecasts, by Product 2024 & 2030 (USD Million)
- 4.3. Assays, Kits, and Reagents
- 4.3.1. Market Revenue Estimates and Forecasts, 2018 - 2030 (USD Million)
- 4.3.2. ELISA Reagents & Kits
- 4.3.2.1. Market Revenue Estimates and Forecasts, 2018 - 2030 (USD Million)
- 4.3.3. Rapid Tests Reagents & Kits
- 4.3.3.1. Market Revenue Estimates and Forecasts, 2018 - 2030 (USD Million)
- 4.3.4. ELISPOT Reagents & Kits
- 4.3.4.1. Market Revenue Estimates and Forecasts, 2018 - 2030 (USD Million)
- 4.3.5. Western Blot Reagents & Kits
- 4.3.5.1. Market Revenue Estimates and Forecasts, 2018 - 2030 (USD Million)
- 4.3.6. Other Reagents & Kits
- 4.3.6.1. Market Revenue Estimates and Forecasts, 2018 - 2030 (USD Million)
- 4.4. Analyzers/Instruments
- 4.4.1. Market Revenue Estimates and Forecasts, 2018 - 2030 (USD Million)
- 4.4.2. Open Ended Systems
- 4.4.2.1. Market Revenue Estimates and Forecasts, 2018 - 2030 (USD Million)
- 4.4.3. Closed Ended Systems
- 4.4.3.1. Market Revenue Estimates and Forecasts, 2018 - 2030 (USD Million)
- 4.5. Software and Services
- 4.5.1. Market Revenue Estimates and Forecasts, 2018 - 2030 (USD Million)
Chapter 5. Immunoassay Market: Application Estimates & Trend Analysis
- 5.1. Immunoassay Market: Application Movement Analysis
- 5.2. Immunoassay Market Estimates and Forecasts, by Application 2024 & 2030 (USD Million)
- 5.3. Therapeutic Drug Monitoring
- 5.3.1. Market Revenue Estimates and Forecasts, 2018 - 2030 (USD Million)
- 5.4. Oncology
- 5.4.1. Market Revenue Estimates and Forecasts, 2018 - 2030 (USD Million)
- 5.5. Cardiology
- 5.5.1. Market Revenue Estimates and Forecasts, 2018 - 2030 (USD Million)
- 5.6. Endocrinology
- 5.6.1. Market Revenue Estimates and Forecasts, 2018 - 2030 (USD Million)
- 5.7. Infectious Disease Testing
- 5.7.1. Market Revenue Estimates and Forecasts, 2018 - 2030 (USD Million)
- 5.8. Autoimmune Diseases
- 5.8.1. Market Revenue Estimates and Forecasts, 2018 - 2030 (USD Million)
- 5.9. Others
- 5.9.1. Market Revenue Estimates and Forecasts, 2018 - 2030 (USD Million)
Chapter 6. Immunoassay Market: Technology Estimates & Trend Analysis
- 6.1. Immunoassay Market: Technology Movement Analysis
- 6.2. Immunoassay Market Estimates and Forecasts, by Technology 2024 & 2030 (USD Million)
- 6.3. Radioimmunoassay (RIA)
- 6.3.1. Market Revenue Estimates and Forecasts, 2018 - 2030 (USD Million)
- 6.4. Enzyme Immunoassays (EIA)
- 6.4.1. Market Revenue Estimates and Forecasts, 2018 - 2030 (USD Million)
- 6.4.2. Chemiluminescence Immunoassays (CLIA)
- 6.4.2.1. Market Revenue Estimates and Forecasts, 2018 - 2030 (USD Million)
- 6.4.3. Fluorescence Immunoassays (FIA)
- 6.4.3.1. Market Revenue Estimates and Forecasts, 2018 - 2030 (USD Million)
- 6.5. Rapid Test
- 6.5.1. Market Revenue Estimates and Forecasts, 2018 - 2030 (USD Million)
- 6.6. Others
- 6.6.1. Market Revenue Estimates and Forecasts, 2018 - 2030 (USD Million)
Chapter 7. Immunoassay Market: Specimen Estimates & Trend Analysis
- 7.1. Immunoassay Market: Specimen Movement Analysis
- 7.2. Immunoassay Market Estimates and Forecasts, by Specimen 2024 & 2030 (USD Million)
- 7.3. Blood
- 7.3.1. Market Revenue Estimates and Forecasts, 2018 - 2030 (USD Million)
- 7.4. Saliva
- 7.4.1. Market Revenue Estimates and Forecasts, 2018 - 2030 (USD Million)
- 7.5. Urine
- 7.5.1. Market Revenue Estimates and Forecasts, 2018 - 2030 (USD Million)
- 7.6. Others
- 7.6.1. Market Revenue Estimates and Forecasts, 2018 - 2030 (USD Million)
Chapter 8. Immunoassay Market: End Use Estimates & Trend Analysis
- 8.1. Immunoassay Market: End--use Movement Analysis
- 8.2. Immunoassay Market Estimates and Forecasts, by End-use 2024 & 2030 (USD Million)
- 8.3. Hospitals
- 8.3.1. Market Revenue Estimates and Forecasts, 2018 - 2030 (USD Million)
- 8.4. Blood Banks
- 8.4.1. Market Revenue Estimates and Forecasts, 2018 - 2030 (USD Million)
- 8.5. Clinical Laboratories
- 8.5.1. Market Revenue Estimates and Forecasts, 2018 - 2030 (USD Million)
- 8.6. Pharmaceutical and Biotech Companies
- 8.6.1. Market Revenue Estimates and Forecasts, 2018 - 2030 (USD Million)
- 8.7. Academic Research Centers
- 8.7.1. Market Revenue Estimates and Forecasts, 2018 - 2030 (USD Million)
- 8.8. Others
- 8.8.1. Market Revenue Estimates and Forecasts, 2018 - 2030 (USD Million)
Chapter 9. Immunoassay Market: Regional Estimates & Trend Analysis
- 9.1. Immunoassay Market Share, By Region, 2024 & 2030 (USD Million)
- 9.2. North America
- 9.2.1. North America Immunoassay Market Estimates and Forecasts, 2018 - 2030 (USD Million)
- 9.2.2. U.S.
- 9.2.2.1. Key Country Dynamics
- 9.2.2.2. Target Disease Prevalence
- 9.2.2.3. Competitive Scenario
- 9.2.2.4. Regulatory Framework
- 9.2.2.5. Reimbursement Scenario
- 9.2.2.6. U.S. Immunoassay Market Estimates and Forecasts, 2018 - 2030 (USD Million)
- 9.2.3. Canada
- 9.2.3.1. Key Country Dynamics
- 9.2.3.2. Target Disease Prevalence
- 9.2.3.3. Competitive Scenario
- 9.2.3.4. Regulatory Framework
- 9.2.3.5. Reimbursement Scenario
- 9.2.3.6. Canada Immunoassay Market Estimates and Forecasts, 2018 - 2030 (USD Million)
- 9.2.4. Mexico
- 9.2.4.1. Key Country Dynamics
- 9.2.4.2. Target Disease Prevalence
- 9.2.4.3. Competitive Scenario
- 9.2.4.4. Regulatory Framework
- 9.2.4.5. Reimbursement Scenario
- 9.2.4.6. Mexico Immunoassay Market Estimates and Forecasts, 2018 - 2030 (USD Million)
- 9.3. Europe
- 9.3.1. Europe Immunoassay Market Estimates and Forecasts, 2018 - 2030 (USD Million)
- 9.3.2. UK
- 9.3.2.1. Key Country Dynamics
- 9.3.2.2. Target Disease Prevalence
- 9.3.2.3. Competitive Scenario
- 9.3.2.4. Regulatory Framework
- 9.3.2.5. Reimbursement Scenario
- 9.3.2.6. UK Immunoassay Market Estimates and Forecasts, 2018 - 2030 (USD Million)
- 9.3.3. Germany
- 9.3.3.1. Key Country Dynamics
- 9.3.3.2. Target Disease Prevalence
- 9.3.3.3. Competitive Scenario
- 9.3.3.4. Regulatory Framework
- 9.3.3.5. Reimbursement Scenario
- 9.3.3.6. Germany Immunoassay Market Estimates and Forecasts, 2018 - 2030 (USD Million)
- 9.3.4. France
- 9.3.4.1. Key Country Dynamics
- 9.3.4.2. Target Disease Prevalence
- 9.3.4.3. Competitive Scenario
- 9.3.4.4. Regulatory Framework
- 9.3.4.5. Reimbursement Scenario
- 9.3.4.6. France Immunoassay Market Estimates and Forecasts, 2018 - 2030 (USD Million)
- 9.3.5. Italy
- 9.3.5.1. Key Country Dynamics
- 9.3.5.2. Target Disease Prevalence
- 9.3.5.3. Competitive Scenario
- 9.3.5.4. Regulatory Framework
- 9.3.5.5. Reimbursement Scenario
- 9.3.5.6. Italy Immunoassay Market Estimates and Forecasts, 2018 - 2030 (USD Million)
- 9.3.6. Spain
- 9.3.6.1. Key Country Dynamics
- 9.3.6.2. Target Disease Prevalence
- 9.3.6.3. Competitive Scenario
- 9.3.6.4. Regulatory Framework
- 9.3.6.5. Reimbursement Scenario
- 9.3.6.6. Spain Immunoassay Market Estimates and Forecasts, 2018 - 2030 (USD Million)
- 9.3.7. Denmark
- 9.3.7.1. Key Country Dynamics
- 9.3.7.2. Target Disease Prevalence
- 9.3.7.3. Competitive Scenario
- 9.3.7.4. Regulatory Framework
- 9.3.7.5. Reimbursement Scenario
- 9.3.7.6. Denmark Immunoassay Market Estimates and Forecasts, 2018 - 2030 (USD Million)
- 9.3.8. Sweden
- 9.3.8.1. Key Country Dynamics
- 9.3.8.2. Target Disease Prevalence
- 9.3.8.3. Competitive Scenario
- 9.3.8.4. Regulatory Framework
- 9.3.8.5. Reimbursement Scenario
- 9.3.8.6. Sweden Immunoassay Market Estimates and Forecasts, 2018 - 2030 (USD Million)
- 9.3.9. Norway
- 9.3.9.1. Key Country Dynamics
- 9.3.9.2. Target Disease Prevalence
- 9.3.9.3. Competitive Scenario
- 9.3.9.4. Regulatory Framework
- 9.3.9.5. Reimbursement Scenario
- 9.3.9.6. Norway Immunoassay Market Estimates and Forecasts, 2018 - 2030 (USD Million)
- 9.4. Asia Pacific
- 9.4.1. Asia Pacific Immunoassay Market Estimates and Forecasts, 2018 - 2030 (USD Million)
- 9.4.2. Japan
- 9.4.2.1. Key Country Dynamics
- 9.4.2.2. Target Disease Prevalence
- 9.4.2.3. Competitive Scenario
- 9.4.2.4. Regulatory Framework
- 9.4.2.5. Reimbursement Scenario
- 9.4.2.6. Japan Immunoassay Market Estimates and Forecasts, 2018 - 2030 (USD Million)
- 9.4.3. China
- 9.4.3.1. Key Country Dynamics
- 9.4.3.2. Target Disease Prevalence
- 9.4.3.3. Competitive Scenario
- 9.4.3.4. Regulatory Framework
- 9.4.3.5. Reimbursement Scenario
- 9.4.3.6. China Immunoassay Market Estimates and Forecasts, 2018 - 2030 (USD Million)
- 9.4.4. India
- 9.4.4.1. Key Country Dynamics
- 9.4.4.2. Target Disease Prevalence
- 9.4.4.3. Competitive Scenario
- 9.4.4.4. Regulatory Framework
- 9.4.4.5. Reimbursement Scenario
- 9.4.4.6. India Immunoassay Market Estimates and Forecasts, 2018 - 2030 (USD Million)
- 9.4.5. Australia
- 9.4.5.1. Key Country Dynamics
- 9.4.5.2. Target Disease Prevalence
- 9.4.5.3. Competitive Scenario
- 9.4.5.4. Regulatory Framework
- 9.4.5.5. Reimbursement Scenario
- 9.4.5.6. Australia Immunoassay Market Estimates and Forecasts, 2018 - 2030 (USD Million)
- 9.4.6. South Korea
- 9.4.6.1. Key Country Dynamics
- 9.4.6.2. Target Disease Prevalence
- 9.4.6.3. Competitive Scenario
- 9.4.6.4. Regulatory Framework
- 9.4.6.5. Reimbursement Scenario
- 9.4.6.6. South Korea Immunoassay Market Estimates and Forecasts, 2018 - 2030 (USD Million)
- 9.4.7. Thailand
- 9.4.7.1. Key Country Dynamics
- 9.4.7.2. Target Disease Prevalence
- 9.4.7.3. Competitive Scenario
- 9.4.7.4. Regulatory Framework
- 9.4.7.5. Reimbursement Scenario
- 9.4.7.6. Thailand Immunoassay Market Estimates and Forecasts, 2018 - 2030 (USD Million)
- 9.5. Latin America
- 9.5.1. Latin America Immunoassay Market Estimates and Forecasts, 2018 - 2030 (USD Million)
- 9.5.2. Brazil
- 9.5.2.1. Key Country Dynamics
- 9.5.2.2. Target Disease Prevalence
- 9.5.2.3. Competitive Scenario
- 9.5.2.4. Regulatory Framework
- 9.5.2.5. Reimbursement Scenario
- 9.5.2.6. Brazil Immunoassay Market Estimates and Forecasts, 2018 - 2030 (USD Million)
- 9.5.3. Argentina
- 9.5.3.1. Key Country Dynamics
- 9.5.3.2. Target Disease Prevalence
- 9.5.3.3. Competitive Scenario
- 9.5.3.4. Regulatory Framework
- 9.5.3.5. Reimbursement Scenario
- 9.5.3.6. Argentina Immunoassay Market Estimates and Forecasts, 2018 - 2030 (USD Million)
- 9.6. Middle East and Africa
- 9.6.1. Middle East and Africa Immunoassay Market Estimates and Forecasts, 2018 - 2030 (USD Million)
- 9.6.2. South Africa
- 9.6.2.1. Key Country Dynamics
- 9.6.2.2. Target Disease Prevalence
- 9.6.2.3. Competitive Scenario
- 9.6.2.4. Regulatory Framework
- 9.6.2.5. Reimbursement Scenario
- 9.6.2.6. South Africa Immunoassay Market Estimates and Forecasts, 2018 - 2030 (USD Million)
- 9.6.3. Saudi Arabia
- 9.6.3.1. Key Country Dynamics
- 9.6.3.2. Target Disease Prevalence
- 9.6.3.3. Competitive Scenario
- 9.6.3.4. Regulatory Framework
- 9.6.3.5. Reimbursement Scenario
- 9.6.3.6. Saudi Arabia Immunoassay Market Estimates and Forecasts, 2018 - 2030 (USD Million)
- 9.6.4. UAE
- 9.6.4.1. Key Country Dynamics
- 9.6.4.2. Target Disease Prevalence
- 9.6.4.3. Competitive Scenario
- 9.6.4.4. Regulatory Framework
- 9.6.4.5. Reimbursement Scenario
- 9.6.4.6. UAE Immunoassay Market Estimates and Forecasts, 2018 - 2030 (USD Million)
- 9.6.5. Kuwait
- 9.6.5.1. Key Country Dynamics
- 9.6.5.2. Target Disease Prevalence
- 9.6.5.3. Competitive Scenario
- 9.6.5.4. Regulatory Framework
- 9.6.5.5. Reimbursement Scenario
- 9.6.5.6. Kuwait Immunoassay Market Estimates and Forecasts, 2018 - 2030 (USD Million)
Chapter 10. Competitive Landscape
- 10.1. Recent Developments & Impact Analysis by Key Market Participants
- 10.2. Company Categorization
- 10.3. Company Heat Map Analysis
- 10.4. Company Profiles
- 10.5. Abbott
- 10.5.1. Participant's Overview
- 10.5.2. Financial Performance
- 10.5.3. Product Benchmarking
- 10.5.4. Recent Developments/ Strategic Initiatives
- 10.6. Siemens Healthineers AG
- 10.6.1. Participant's Overview
- 10.6.2. Financial Performance
- 10.6.3. Product Benchmarking
- 10.6.4. Recent Developments/ Strategic Initiatives
- 10.7. Danaher Corporation (Beckman Coulter)
- 10.7.1. Participant's Overview
- 10.7.2. Financial Performance
- 10.7.3. Product Benchmarking
- 10.7.4. Recent Developments/ Strategic Initiatives
- 10.8. bioMerieux SA
- 10.8.1. Participant's Overview
- 10.8.2. Financial Performance
- 10.8.3. Product Benchmarking
- 10.8.4. Recent Developments/ Strategic Initiatives
- 10.9. Quidel Corporation
- 10.9.1. Participant's Overview
- 10.9.2. Financial Performance
- 10.9.3. Product Benchmarking
- 10.9.4. Recent Developments/ Strategic Initiatives
- 10.10. Sysmex Corporation
- 10.10.1. Participant's Overview
- 10.10.2. Financial Performance
- 10.10.3. Product Benchmarking
- 10.10.4. Recent Developments/ Strategic Initiatives
- 10.11. Ortho Clinical Diagnostics
- 10.11.1. Participant's Overview
- 10.11.2. Financial Performance
- 10.11.3. Product Benchmarking
- 10.11.4. Recent Developments/ Strategic Initiatives
- 10.12. Bio-Rad Laboratories, Inc.
- 10.12.1. Participant's Overview
- 10.12.2. Financial Performance
- 10.12.3. Product Benchmarking
- 10.12.4. Recent Developments/ Strategic Initiatives
- 10.13. F. Hoffmann-La Roche AG
- 10.13.1. Participant's Overview
- 10.13.2. Financial Performance
- 10.13.3. Product Benchmarking
- 10.13.4. Recent Developments/ Strategic Initiatives
- 10.14. Becton, Dickinson, and Company
- 10.14.1. Participant's Overview
- 10.14.2. Financial Performance
- 10.14.3. Product Benchmarking
- 10.14.4. Recent Developments/ Strategic Initiatives
- 10.15. Thermo Fisher Scientific, Inc.
- 10.15.1. Participant's Overview
- 10.15.2. Financial Performance
- 10.15.3. Product Benchmarking
- 10.15.4. Recent Developments/ Strategic Initiatives

