|
|
市場調査レポート
商品コード
1739177
碎砂および花崗岩の世界市場Manufactured Sand and Granite |
||||||
|
|||||||
適宜更新あり
|
|||||||

| 碎砂および花崗岩の世界市場 |
|
出版日: 2025年06月03日
発行: Market Glass, Inc. (Formerly Global Industry Analysts, Inc.)
ページ情報: 英文 281 Pages
納期: 即日から翌営業日
|

全表示
- 概要
- 目次
碎砂および花崗岩の世界市場は2030年までに2,182億米ドルに到達
2024年に1,387億米ドルと推定される碎砂および花崗岩の世界市場は、2024年から2030年にかけてCAGR 7.8%で成長し、2030年には2,182億米ドルに達すると予測されます。本レポートで分析したセグメントの一つである製造砂は、CAGR9.4%を記録し、分析期間終了時には1,454億米ドルに達すると予想されます。花崗岩セグメントの成長率は、分析期間でCAGR 5.2%と推定されます。
米国市場は378億米ドルと推定、中国はCAGR12.5%で成長予測
米国の碎砂および花崗岩市場は2024年に378億米ドルと推定されます。世界第2位の経済大国である中国は、2030年までに473億米ドルの市場規模に達すると予測され、分析期間2024-2030年のCAGRは12.5%です。その他の注目すべき地域別市場としては、日本とカナダがあり、分析期間中のCAGRはそれぞれ3.8%と7.6%と予測されています。欧州では、ドイツがCAGR 5.2%で成長すると予測されています。
世界の碎砂および花崗岩市場- 主要動向と促進要因まとめ
なぜ、製造砂と砕いた花崗岩が建設における好ましい代替品として台頭しているのか?
製造砂(M-sand)と砕いた花崗岩は、建設・インフラ分野において、天然の川砂や従来の骨材に代わる持続可能で高性能な代替品として採用されるケースが増えています。天然砂の埋蔵量の枯渇、川砂採掘の環境規制、コンクリート製造における一貫した品質の必要性から、建設会社は垂直軸衝撃(VSI)クラッシャーで硬い花崗岩を粉砕して製造される製造砂に注目しています。製造された砂は、粒度分布が制御され、立方体形状で、シルト含有量が少なく、コンクリート、モルタル、しっくいの用途に最適です。
一方、砕いた花崗岩は、道路基層、鉄道バラスト、コンクリート構造物、プレキャストブロックに使用される、耐久性があり耐荷重性の高い建設用骨材として脚光を浴びています。強度、耐候性、インターロッキング特性で知られる花崗岩骨材は、最終構造物の圧縮強度とスキッド抵抗性を向上させる。碎砂および花崗岩は、骨材の不足という2つの課題と、大規模インフラ、手頃な価格の住宅、産業建設プロジェクトにおけるコンクリート性能の向上という世界のニーズに対応するため、複合ソリューションを形成しています。
生産技術と品質管理は、どのように市場の有効性を高めているのか?
破砕、スクリーニング、洗浄システムの技術的進歩は、一貫した品質を確保しながら骨材生産を拡大する上で重要な役割を果たしています。高速VSIクラッシャー、3段デッキ振動スクリーン、湿式分級システムは、粒子形状を微調整し、粘土や微粉のような有害物質を除去するために使用されています。気流式分級機とハイドロサイクロンは、砂の粒度をさらに細かくし、コンクリート混合設計に使用する際の作業性特性を向上させる。
品質管理プロトコルは高度に標準化されてきており、特にMサンドについては、IS 383(インド)、ASTM C33(米国)、またはEN 12620(欧州)の細骨材規格を満たす必要があります。生産者は、粒度分布、形状指数、吸水率、シルト含有量を試験するための現場ラボに投資しています。多くの地域では、生コンクリート(RMC)工場が、供給の継続性とコンクリート配合の適合性を確保するために、認定を受けたMサンド供給業者と長期契約を結んでいます。自動マテリアルハンドリングシステム、ERP統合生産ライン、GPS対応車両ロジスティクスの利用可能性は、これらの代替手段の拡張性と商業的実行可能性をさらに高めています。
Mサンドと花崗岩の需要を牽引している建設セグメントと地域市場は?
碎砂および花崗岩骨材の需要は、特にインド、中国、インドネシア、ブラジル、ナイジェリアなどの高成長経済圏における、世界のインフラ整備の推進によって牽引されています。政府が支援する道路、橋、地下鉄、スマートシティなどのプロジェクトでは、大量の高強度コンクリートが必要とされ、その工学的特性と持続可能な調達の信頼性により、Mサンドと花崗岩の採用が加速しています。また、住宅や商業用不動産セクターも重要な消費者であり、建設業者は環境に配慮した建築基準を遵守し、材料のばらつきを減らすために、川砂に代わるものを求めています。
南インドの一部、西欧、中東のように、川砂の採掘が禁止されているか、非常に制限されている地域では、川砂が既定の建設材料となっています。海岸沿いのインフラや重工事プロジェクトでは、圧縮強度が高く塩水に強い花崗岩が好まれています。さらに、北米や欧州ではプレキャスト工法やモジュール工法の採用が増加しており、品質公差の厳しい粒状材料に対する需要が高まっています。
碎砂および花崗岩市場の長期的成長の原動力は?
碎砂および花崗岩市場の成長の原動力は、持続可能な建設、材料の標準化、規制の変革といった相互に関連した動向です。最も大きな原動力のひとつは、河川敷での採掘による環境悪化であり、これにより都市計画当局による持続可能な骨材調達慣行の厳格な施行が行われています。コンプライアンス・コストと罰則が上昇するにつれ、建設会社は持続可能性の義務付けとライフサイクル評価の目標に沿うため、工業生産された砂と花崗岩の骨材に積極的にシフトしています。
インドのPM Gati Shakti、中国のBelt and Road Initiative、米国のInfrastructure Investment and Jobs Actなどの国家プログラムによるインフラ支出の急増は、高性能で追跡可能な材料を好む長期的な骨材需要を生み出しています。同時に、コンクリート業界は、一貫したバッチ処理、高い初期強度、および水需要の削減を推進しており、Mサンドやグレーデッド花崗岩のような人工骨材の使用が支持されています。デジタル・コンクリート配合設計ソフトウェアと性能モデリング・ツールは、最適化された配合でこれらの材料をより正確に使用することも可能にしています。
自動採石場、選鉱ユニット、移動式破砕プラントへの民間投資は、半都市部や遠隔地でもMサンドや花崗岩の利用可能性を拡大しています。セメントメーカー、EPC企業、および骨材メーカー間の戦略的パートナーシップは、優れたコスト効率と物流の柔軟性を提供する統合サプライチェーンにつながっています。建設慣行が進化し、材料の持続可能性が差別化要因となるにつれ、碎砂および花崗岩は、弾力性があり、将来に対応できるインフラへの世界の移行において、基盤となる投入資材となる態勢を整えています。
セグメント
製品タイプ(人工砂、花崗岩)、エンドユーザー(住宅、商業施設、工業施設)
調査対象企業の例(全47件)
- Ablegroup Berhad
- Adelaide Brighton Ltd
- Antolini Luigi & C. S.p.A.
- Arizona Tile
- Cambria
- CDE Global
- CEMEX S.A.B. de C.V.
- Cosentino S.A.
- CRH plc
- Dakota Granite Company
- Gem Granites
- Granite Construction Inc.
- HeidelbergCement AG
- Holcim Ltd
- Lasselsberger Group
- Levantina y Asociados de Minerales
- M S International, Inc.
- Pokarna Limited
- R.E.D. Graniti S.p.A.
- Vulcan Materials Company
関税影響係数
Global Industry Analystsは、本社の国、製造拠点、輸出入(完成品とOEM)に基づく企業の競争力の変化を予測しています。この複雑で多面的な市場力学は、人為的な売上原価の増加、収益性の低下、サプライチェーンの再構築など、ミクロおよびマクロの市場力学の中でも特に競合他社に影響を与える見込みです。
Global Industry Analystsは、世界の主要なチーフ・エコノミスト(1万4,949人)、シンクタンク(62団体)、貿易・産業団体(171団体)の専門家の意見に熱心に従いながら、エコシステムへの影響を評価し、新たな市場の現実に対処しています。あらゆる主要国の専門家やエコノミストが、関税とそれが自国に与える影響についての意見を追跡調査しています。
Global Industry Analystsは、この混乱が今後2-3ヶ月で収束し、新しい世界秩序がより明確に確立されると予想しています。Global Industry Analystsは、これらの開発をリアルタイムで追跡しています。
2025年4月:交渉フェーズ
4月のリリースでは、世界市場全体に対する関税の影響を取り上げ、地域別の市場調整について紹介します。当社の予測は、過去のデータと進化する市場影響要因に基づいています。
2025年7月:最終関税リセット
お客様には、各国間で最終リセットが発表された後、7月に無料アップデート版をお届けします。最終アップデート版には、明確に定義された関税影響分析が組み込まれています。
相互および二国間貿易と関税の影響分析:
アメリカ <>中国<>メキシコ <>カナダ <>EU <>日本<>インド <>その他176カ国
業界をリードするエコノミスト:Global Industry Analystsの知識ベースは、国家、シンクタンク、貿易・産業団体、大企業、そして世界の計量経済状況におけるこの前例のないパラダイムシフトの影響を共有する領域の専門家など、最も影響力のあるチーフエコノミストの厳選されたグループを含む1万4,949人のエコノミストを追跡しています。当社の16,491を超えるレポートのほとんどは、マイルストーンに基づくこの2段階のリリーススケジュールを取り入れています。
目次
第1章 調査手法
第2章 エグゼクティブサマリー
- 市場概要
- 主要企業
- 市場動向と促進要因
- 世界市場の見通し
第3章 市場分析
- 米国
- カナダ
- 日本
- 中国
- 欧州
- フランス
- ドイツ
- イタリア
- 英国
- スペイン
- ロシア
- その他欧州
- アジア太平洋
- オーストラリア
- インド
- 韓国
- その他アジア太平洋地域
- ラテンアメリカ
- アルゼンチン
- ブラジル
- メキシコ
- その他ラテンアメリカ
- 中東
- イラン
- イスラエル
- サウジアラビア
- アラブ首長国連邦
- その他中東
- アフリカ
第4章 競合
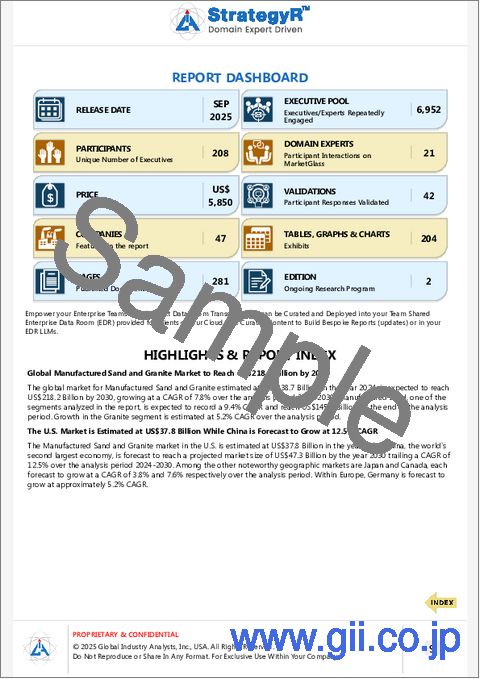
Global Manufactured Sand and Granite Market to Reach US$218.2 Billion by 2030
The global market for Manufactured Sand and Granite estimated at US$138.7 Billion in the year 2024, is expected to reach US$218.2 Billion by 2030, growing at a CAGR of 7.8% over the analysis period 2024-2030. Manufactured Sand, one of the segments analyzed in the report, is expected to record a 9.4% CAGR and reach US$145.4 Billion by the end of the analysis period. Growth in the Granite segment is estimated at 5.2% CAGR over the analysis period.
The U.S. Market is Estimated at US$37.8 Billion While China is Forecast to Grow at 12.5% CAGR
The Manufactured Sand and Granite market in the U.S. is estimated at US$37.8 Billion in the year 2024. China, the world's second largest economy, is forecast to reach a projected market size of US$47.3 Billion by the year 2030 trailing a CAGR of 12.5% over the analysis period 2024-2030. Among the other noteworthy geographic markets are Japan and Canada, each forecast to grow at a CAGR of 3.8% and 7.6% respectively over the analysis period. Within Europe, Germany is forecast to grow at approximately 5.2% CAGR.
Global Manufactured Sand And Granite Market - Key Trends & Drivers Summarized
Why Are Manufactured Sand and Crushed Granite Emerging as Preferred Alternatives in Construction?
Manufactured sand (M-sand) and crushed granite are increasingly being adopted as sustainable, high-performance alternatives to natural river sand and traditional aggregates in the construction and infrastructure sectors. With depleting natural sand reserves, environmental restrictions on river sand mining, and the need for consistent quality in concrete production, construction firms are turning to manufactured sand produced by crushing hard granite rock using vertical shaft impact (VSI) crushers. The resulting sand has controlled particle size distribution, cubical shape, and lower silt content-ideal for concrete, mortar, and plaster applications.
Crushed granite, on the other hand, is gaining prominence as a durable and high-load-bearing construction aggregate used in road base layers, railway ballast, concrete structures, and precast blocks. Known for its strength, weather resistance, and interlocking properties, granite aggregates improve the compressive strength and skid resistance of final structures. Together, manufactured sand and granite are forming a composite solution to address the dual challenges of aggregate scarcity and the need for improved concrete performance in mega infrastructure, affordable housing, and industrial construction projects globally.
How Are Production Technologies and Quality Control Enhancing Market Viability?
Technological advancements in crushing, screening, and washing systems have played a crucial role in scaling up manufactured sand and granite aggregate production while ensuring consistent quality. High-speed VSI crushers, triple-deck vibratory screens, and wet classification systems are being used to fine-tune the particle shape and eliminate deleterious materials such as clay and fines. Air classifiers and hydrocyclones further refine sand gradation and enhance workability properties when used in concrete mix designs.
Quality control protocols have become highly standardized, particularly for M-sand, which must meet IS 383 (India), ASTM C33 (U.S.), or EN 12620 (Europe) standards for fine aggregates. Producers are investing in on-site labs to test particle size distribution, shape index, water absorption, and silt content. In many regions, ready-mix concrete (RMC) plants are entering into long-term contracts with certified M-sand suppliers to ensure continuity of supply and concrete mix compatibility. The availability of automated material handling systems, ERP-integrated production lines, and GPS-enabled fleet logistics is further enhancing the scalability and commercial viability of these alternatives.
Which Construction Segments and Geographic Markets Are Driving Demand for M-Sand and Granite?
The demand for manufactured sand and granite aggregates is being driven by the global infrastructure push, especially in high-growth economies such as India, China, Indonesia, Brazil, and Nigeria. Government-backed projects in roads, bridges, metros, and smart cities require large volumes of high-strength concrete-fuelling adoption of M-sand and granite due to their engineering properties and sustainable sourcing credentials. The residential and commercial real estate sectors are also significant consumers, with builders seeking alternatives to river sand to comply with green building codes and reduce material variability.
In regions where river sand mining is either banned or highly restricted-such as parts of South India, Western Europe, and the Middle East-M-sand has become the default construction material. Coastal infrastructure and heavy engineering projects favor granite due to its high compressive strength and saltwater resistance. Furthermore, the increasing adoption of precast and modular construction methods in North America and Europe is creating additional demand for granular materials with tight quality tolerances-strengthening the case for manufactured aggregates over natural variants.
What Is Driving Long-Term Growth in the Manufactured Sand and Granite Market?
The growth in the manufactured sand and granite market is driven by interlinked trends in sustainable construction, material standardization, and regulatory transformation. One of the foremost drivers is the environmental degradation caused by riverbed mining, which has led to strict enforcement of sustainable aggregate sourcing practices by urban planning authorities. As compliance costs and penalties rise, construction companies are proactively shifting to industrially produced sand and granite aggregates to align with sustainability mandates and lifecycle assessment goals.
The surge in infrastructure spending under national programs such as India’s PM Gati Shakti, China’s Belt and Road Initiative, and the U.S. Infrastructure Investment and Jobs Act is creating long-term aggregate demand with a preference for high-performance, traceable materials. Simultaneously, the concrete industry’s push for consistent batching, high early strength, and reduced water demand is favoring the use of engineered aggregates like M-sand and graded granite. Digital concrete mix design software and performance modeling tools are also enabling more precise use of these materials in optimized formulations.
Private investments in automated quarries, mineral beneficiation units, and mobile crushing plants are expanding the availability of M-sand and granite even in semi-urban and remote regions. Strategic partnerships between cement manufacturers, EPC firms, and aggregate producers are leading to integrated supply chains that offer superior cost-efficiency and logistical flexibility. As construction practices evolve and material sustainability becomes a differentiator, manufactured sand and granite are poised to become foundational inputs in the global transition to resilient, future-ready infrastructure.
SCOPE OF STUDY:
The report analyzes the Manufactured Sand and Granite market in terms of units by the following Segments, and Geographic Regions/Countries:
Segments:
Product Type (Manufactured Sand, Granite); End-User (Residential, Commercial, Industrial)
Geographic Regions/Countries:
World; United States; Canada; Japan; China; Europe (France; Germany; Italy; United Kingdom; Spain; Russia; and Rest of Europe); Asia-Pacific (Australia; India; South Korea; and Rest of Asia-Pacific); Latin America (Argentina; Brazil; Mexico; and Rest of Latin America); Middle East (Iran; Israel; Saudi Arabia; United Arab Emirates; and Rest of Middle East); and Africa.
Select Competitors (Total 47 Featured) -
- Ablegroup Berhad
- Adelaide Brighton Ltd
- Antolini Luigi & C. S.p.A.
- Arizona Tile
- Cambria
- CDE Global
- CEMEX S.A.B. de C.V.
- Cosentino S.A.
- CRH plc
- Dakota Granite Company
- Gem Granites
- Granite Construction Inc.
- HeidelbergCement AG
- Holcim Ltd
- Lasselsberger Group
- Levantina y Asociados de Minerales
- M S International, Inc.
- Pokarna Limited
- R.E.D. Graniti S.p.A.
- Vulcan Materials Company
TARIFF IMPACT FACTOR
Our new release incorporates impact of tariffs on geographical markets as we predict a shift in competitiveness of companies based on HQ country, manufacturing base, exports and imports (finished goods and OEM). This intricate and multifaceted market reality will impact competitors by artificially increasing the COGS, reducing profitability, reconfiguring supply chains, amongst other micro and macro market dynamics.
We are diligently following expert opinions of leading Chief Economists (14,949), Think Tanks (62), Trade & Industry bodies (171) worldwide, as they assess impact and address new market realities for their ecosystems. Experts and economists from every major country are tracked for their opinions on tariffs and how they will impact their countries.
We expect this chaos to play out over the next 2-3 months and a new world order is established with more clarity. We are tracking these developments on a real time basis.
As we release this report, U.S. Trade Representatives are pushing their counterparts in 183 countries for an early closure to bilateral tariff negotiations. Most of the major trading partners also have initiated trade agreements with other key trading nations, outside of those in the works with the United States. We are tracking such secondary fallouts as supply chains shift.
To our valued clients, we say, we have your back. We will present a simplified market reassessment by incorporating these changes!
APRIL 2025: NEGOTIATION PHASE
Our April release addresses the impact of tariffs on the overall global market and presents market adjustments by geography. Our trajectories are based on historic data and evolving market impacting factors.
JULY 2025 FINAL TARIFF RESET
Complimentary Update: Our clients will also receive a complimentary update in July after a final reset is announced between nations. The final updated version incorporates clearly defined Tariff Impact Analyses.
Reciprocal and Bilateral Trade & Tariff Impact Analyses:
USA <> CHINA <> MEXICO <> CANADA <> EU <> JAPAN <> INDIA <> 176 OTHER COUNTRIES.
Leading Economists - Our knowledge base tracks 14,949 economists including a select group of most influential Chief Economists of nations, think tanks, trade and industry bodies, big enterprises, and domain experts who are sharing views on the fallout of this unprecedented paradigm shift in the global econometric landscape. Most of our 16,491+ reports have incorporated this two-stage release schedule based on milestones.
COMPLIMENTARY PREVIEW
Contact your sales agent to request an online 300+ page complimentary preview of this research project. Our preview will present full stack sources, and validated domain expert data transcripts. Deep dive into our interactive data-driven online platform.
TABLE OF CONTENTS
I. METHODOLOGY
II. EXECUTIVE SUMMARY
- 1. MARKET OVERVIEW
- Influencer Market Insights
- World Market Trajectories
- Impact of Covid-19 and a Looming Global Recession
- Manufactured Sand and Granite - Global Key Competitors Percentage Market Share in 2025 (E)
- Competitive Market Presence - Strong/Active/Niche/Trivial for Players Worldwide in 2025 (E)
- 2. FOCUS ON SELECT PLAYERS
- 3. MARKET TRENDS & DRIVERS
- Stringent Environmental Regulations on River Sand Mining Propel Shift to Manufactured Sand Alternatives
- Rapid Urbanization and Infrastructure Projects Drive Demand for High-Strength Construction Aggregates
- Growth in Smart Cities and Affordable Housing Programs Throws the Spotlight on M-Sand Adoption
- Government Support for Sustainable Construction Materials Strengthens Business Case for Crushed Granite and M-Sand
- Rising Shortage of Natural Sand in Coastal and Inland Regions Spurs Market Penetration of Manufactured Aggregates
- Advancements in Vertical Shaft Impactor (VSI) Technology Enhance Quality of Manufactured Sand
- Increased Use of Manufactured Sand in Ready-Mix Concrete Applications Expands Market Scope
- Strengthening of Public-Private Infrastructure Partnerships Fuels Long-Term Aggregate Consumption
- Higher Workability and Reduced Void Ratios Drive Adoption of Manufactured Sand in High-Performance Concrete
- Expansion of Precast Concrete and Modular Construction Accelerates Use of Uniform Particle M-Sand
- Focus on Sustainable Resource Management Promotes Reuse of Quarry Dust and Crushed Stone
- Digital Material Testing and Certification Tools Enhance Quality Assurance of Engineered Aggregates
- Fluctuations in River Sand Supply and Price Volatility Create Opportunities for Scalable M-Sand Units
- Growing Adoption in Road and Railway Infrastructure Projects Sustains Demand for Crushed Granite
- Cost-Effectiveness and Regional Availability Strengthen Preference for Localized M-Sand Plants
- Construction of Dams, Bridges, and Industrial Parks Drives Large-Scale Procurement of Manufactured Aggregates
- Recycling and Reprocessing Technologies in Stone Crushing Enhance Circular Economy Integration
- Public Procurement Mandates Favoring Eco-Friendly Aggregates Drive Institutional Sales Growth
- Quality Standardization and BIS Certification Encourage Wider Use in Commercial and Residential Segments
- OEM Partnerships With Crusher and Screening Equipment Makers Support Integrated Aggregate Solutions
- 4. GLOBAL MARKET PERSPECTIVE
- TABLE 1: World Manufactured Sand and Granite Market Analysis of Annual Sales in US$ Million for Years 2015 through 2030
- TABLE 2: World Recent Past, Current & Future Analysis for Manufactured Sand and Granite by Geographic Region - USA, Canada, Japan, China, Europe, Asia-Pacific, Latin America, Middle East and Africa Markets - Independent Analysis of Annual Sales in US$ Million for Years 2024 through 2030 and % CAGR
- TABLE 3: World Historic Review for Manufactured Sand and Granite by Geographic Region - USA, Canada, Japan, China, Europe, Asia-Pacific, Latin America, Middle East and Africa Markets - Independent Analysis of Annual Sales in US$ Million for Years 2015 through 2023 and % CAGR
- TABLE 4: World 15-Year Perspective for Manufactured Sand and Granite by Geographic Region - Percentage Breakdown of Value Sales for USA, Canada, Japan, China, Europe, Asia-Pacific, Latin America, Middle East and Africa Markets for Years 2015, 2025 & 2030
- TABLE 5: World Recent Past, Current & Future Analysis for Manufactured Sand by Geographic Region - USA, Canada, Japan, China, Europe, Asia-Pacific, Latin America, Middle East and Africa Markets - Independent Analysis of Annual Sales in US$ Million for Years 2024 through 2030 and % CAGR
- TABLE 6: World Historic Review for Manufactured Sand by Geographic Region - USA, Canada, Japan, China, Europe, Asia-Pacific, Latin America, Middle East and Africa Markets - Independent Analysis of Annual Sales in US$ Million for Years 2015 through 2023 and % CAGR
- TABLE 7: World 15-Year Perspective for Manufactured Sand by Geographic Region - Percentage Breakdown of Value Sales for USA, Canada, Japan, China, Europe, Asia-Pacific, Latin America, Middle East and Africa for Years 2015, 2025 & 2030
- TABLE 8: World Recent Past, Current & Future Analysis for Granite by Geographic Region - USA, Canada, Japan, China, Europe, Asia-Pacific, Latin America, Middle East and Africa Markets - Independent Analysis of Annual Sales in US$ Million for Years 2024 through 2030 and % CAGR
- TABLE 9: World Historic Review for Granite by Geographic Region - USA, Canada, Japan, China, Europe, Asia-Pacific, Latin America, Middle East and Africa Markets - Independent Analysis of Annual Sales in US$ Million for Years 2015 through 2023 and % CAGR
- TABLE 10: World 15-Year Perspective for Granite by Geographic Region - Percentage Breakdown of Value Sales for USA, Canada, Japan, China, Europe, Asia-Pacific, Latin America, Middle East and Africa for Years 2015, 2025 & 2030
- TABLE 11: World Recent Past, Current & Future Analysis for Residential by Geographic Region - USA, Canada, Japan, China, Europe, Asia-Pacific, Latin America, Middle East and Africa Markets - Independent Analysis of Annual Sales in US$ Million for Years 2024 through 2030 and % CAGR
- TABLE 12: World Historic Review for Residential by Geographic Region - USA, Canada, Japan, China, Europe, Asia-Pacific, Latin America, Middle East and Africa Markets - Independent Analysis of Annual Sales in US$ Million for Years 2015 through 2023 and % CAGR
- TABLE 13: World 15-Year Perspective for Residential by Geographic Region - Percentage Breakdown of Value Sales for USA, Canada, Japan, China, Europe, Asia-Pacific, Latin America, Middle East and Africa for Years 2015, 2025 & 2030
- TABLE 14: World Recent Past, Current & Future Analysis for Commercial by Geographic Region - USA, Canada, Japan, China, Europe, Asia-Pacific, Latin America, Middle East and Africa Markets - Independent Analysis of Annual Sales in US$ Million for Years 2024 through 2030 and % CAGR
- TABLE 15: World Historic Review for Commercial by Geographic Region - USA, Canada, Japan, China, Europe, Asia-Pacific, Latin America, Middle East and Africa Markets - Independent Analysis of Annual Sales in US$ Million for Years 2015 through 2023 and % CAGR
- TABLE 16: World 15-Year Perspective for Commercial by Geographic Region - Percentage Breakdown of Value Sales for USA, Canada, Japan, China, Europe, Asia-Pacific, Latin America, Middle East and Africa for Years 2015, 2025 & 2030
- TABLE 17: World Recent Past, Current & Future Analysis for Industrial by Geographic Region - USA, Canada, Japan, China, Europe, Asia-Pacific, Latin America, Middle East and Africa Markets - Independent Analysis of Annual Sales in US$ Million for Years 2024 through 2030 and % CAGR
- TABLE 18: World Historic Review for Industrial by Geographic Region - USA, Canada, Japan, China, Europe, Asia-Pacific, Latin America, Middle East and Africa Markets - Independent Analysis of Annual Sales in US$ Million for Years 2015 through 2023 and % CAGR
- TABLE 19: World 15-Year Perspective for Industrial by Geographic Region - Percentage Breakdown of Value Sales for USA, Canada, Japan, China, Europe, Asia-Pacific, Latin America, Middle East and Africa for Years 2015, 2025 & 2030
III. MARKET ANALYSIS
- UNITED STATES
- Manufactured Sand and Granite Market Presence - Strong/Active/Niche/Trivial - Key Competitors in the United States for 2025 (E)
- TABLE 20: USA Recent Past, Current & Future Analysis for Manufactured Sand and Granite by Product Type - Manufactured Sand and Granite - Independent Analysis of Annual Sales in US$ Million for the Years 2024 through 2030 and % CAGR
- TABLE 21: USA Historic Review for Manufactured Sand and Granite by Product Type - Manufactured Sand and Granite Markets - Independent Analysis of Annual Sales in US$ Million for Years 2015 through 2023 and % CAGR
- TABLE 22: USA 15-Year Perspective for Manufactured Sand and Granite by Product Type - Percentage Breakdown of Value Sales for Manufactured Sand and Granite for the Years 2015, 2025 & 2030
- TABLE 23: USA Recent Past, Current & Future Analysis for Manufactured Sand and Granite by End-user - Residential, Commercial and Industrial - Independent Analysis of Annual Sales in US$ Million for the Years 2024 through 2030 and % CAGR
- TABLE 24: USA Historic Review for Manufactured Sand and Granite by End-user - Residential, Commercial and Industrial Markets - Independent Analysis of Annual Sales in US$ Million for Years 2015 through 2023 and % CAGR
- TABLE 25: USA 15-Year Perspective for Manufactured Sand and Granite by End-user - Percentage Breakdown of Value Sales for Residential, Commercial and Industrial for the Years 2015, 2025 & 2030
- CANADA
- TABLE 26: Canada Recent Past, Current & Future Analysis for Manufactured Sand and Granite by Product Type - Manufactured Sand and Granite - Independent Analysis of Annual Sales in US$ Million for the Years 2024 through 2030 and % CAGR
- TABLE 27: Canada Historic Review for Manufactured Sand and Granite by Product Type - Manufactured Sand and Granite Markets - Independent Analysis of Annual Sales in US$ Million for Years 2015 through 2023 and % CAGR
- TABLE 28: Canada 15-Year Perspective for Manufactured Sand and Granite by Product Type - Percentage Breakdown of Value Sales for Manufactured Sand and Granite for the Years 2015, 2025 & 2030
- TABLE 29: Canada Recent Past, Current & Future Analysis for Manufactured Sand and Granite by End-user - Residential, Commercial and Industrial - Independent Analysis of Annual Sales in US$ Million for the Years 2024 through 2030 and % CAGR
- TABLE 30: Canada Historic Review for Manufactured Sand and Granite by End-user - Residential, Commercial and Industrial Markets - Independent Analysis of Annual Sales in US$ Million for Years 2015 through 2023 and % CAGR
- TABLE 31: Canada 15-Year Perspective for Manufactured Sand and Granite by End-user - Percentage Breakdown of Value Sales for Residential, Commercial and Industrial for the Years 2015, 2025 & 2030
- JAPAN
- Manufactured Sand and Granite Market Presence - Strong/Active/Niche/Trivial - Key Competitors in Japan for 2025 (E)
- TABLE 32: Japan Recent Past, Current & Future Analysis for Manufactured Sand and Granite by Product Type - Manufactured Sand and Granite - Independent Analysis of Annual Sales in US$ Million for the Years 2024 through 2030 and % CAGR
- TABLE 33: Japan Historic Review for Manufactured Sand and Granite by Product Type - Manufactured Sand and Granite Markets - Independent Analysis of Annual Sales in US$ Million for Years 2015 through 2023 and % CAGR
- TABLE 34: Japan 15-Year Perspective for Manufactured Sand and Granite by Product Type - Percentage Breakdown of Value Sales for Manufactured Sand and Granite for the Years 2015, 2025 & 2030
- TABLE 35: Japan Recent Past, Current & Future Analysis for Manufactured Sand and Granite by End-user - Residential, Commercial and Industrial - Independent Analysis of Annual Sales in US$ Million for the Years 2024 through 2030 and % CAGR
- TABLE 36: Japan Historic Review for Manufactured Sand and Granite by End-user - Residential, Commercial and Industrial Markets - Independent Analysis of Annual Sales in US$ Million for Years 2015 through 2023 and % CAGR
- TABLE 37: Japan 15-Year Perspective for Manufactured Sand and Granite by End-user - Percentage Breakdown of Value Sales for Residential, Commercial and Industrial for the Years 2015, 2025 & 2030
- CHINA
- Manufactured Sand and Granite Market Presence - Strong/Active/Niche/Trivial - Key Competitors in China for 2025 (E)
- TABLE 38: China Recent Past, Current & Future Analysis for Manufactured Sand and Granite by Product Type - Manufactured Sand and Granite - Independent Analysis of Annual Sales in US$ Million for the Years 2024 through 2030 and % CAGR
- TABLE 39: China Historic Review for Manufactured Sand and Granite by Product Type - Manufactured Sand and Granite Markets - Independent Analysis of Annual Sales in US$ Million for Years 2015 through 2023 and % CAGR
- TABLE 40: China 15-Year Perspective for Manufactured Sand and Granite by Product Type - Percentage Breakdown of Value Sales for Manufactured Sand and Granite for the Years 2015, 2025 & 2030
- TABLE 41: China Recent Past, Current & Future Analysis for Manufactured Sand and Granite by End-user - Residential, Commercial and Industrial - Independent Analysis of Annual Sales in US$ Million for the Years 2024 through 2030 and % CAGR
- TABLE 42: China Historic Review for Manufactured Sand and Granite by End-user - Residential, Commercial and Industrial Markets - Independent Analysis of Annual Sales in US$ Million for Years 2015 through 2023 and % CAGR
- TABLE 43: China 15-Year Perspective for Manufactured Sand and Granite by End-user - Percentage Breakdown of Value Sales for Residential, Commercial and Industrial for the Years 2015, 2025 & 2030
- EUROPE
- Manufactured Sand and Granite Market Presence - Strong/Active/Niche/Trivial - Key Competitors in Europe for 2025 (E)
- TABLE 44: Europe Recent Past, Current & Future Analysis for Manufactured Sand and Granite by Geographic Region - France, Germany, Italy, UK, Spain, Russia and Rest of Europe Markets - Independent Analysis of Annual Sales in US$ Million for Years 2024 through 2030 and % CAGR
- TABLE 45: Europe Historic Review for Manufactured Sand and Granite by Geographic Region - France, Germany, Italy, UK, Spain, Russia and Rest of Europe Markets - Independent Analysis of Annual Sales in US$ Million for Years 2015 through 2023 and % CAGR
- TABLE 46: Europe 15-Year Perspective for Manufactured Sand and Granite by Geographic Region - Percentage Breakdown of Value Sales for France, Germany, Italy, UK, Spain, Russia and Rest of Europe Markets for Years 2015, 2025 & 2030
- TABLE 47: Europe Recent Past, Current & Future Analysis for Manufactured Sand and Granite by Product Type - Manufactured Sand and Granite - Independent Analysis of Annual Sales in US$ Million for the Years 2024 through 2030 and % CAGR
- TABLE 48: Europe Historic Review for Manufactured Sand and Granite by Product Type - Manufactured Sand and Granite Markets - Independent Analysis of Annual Sales in US$ Million for Years 2015 through 2023 and % CAGR
- TABLE 49: Europe 15-Year Perspective for Manufactured Sand and Granite by Product Type - Percentage Breakdown of Value Sales for Manufactured Sand and Granite for the Years 2015, 2025 & 2030
- TABLE 50: Europe Recent Past, Current & Future Analysis for Manufactured Sand and Granite by End-user - Residential, Commercial and Industrial - Independent Analysis of Annual Sales in US$ Million for the Years 2024 through 2030 and % CAGR
- TABLE 51: Europe Historic Review for Manufactured Sand and Granite by End-user - Residential, Commercial and Industrial Markets - Independent Analysis of Annual Sales in US$ Million for Years 2015 through 2023 and % CAGR
- TABLE 52: Europe 15-Year Perspective for Manufactured Sand and Granite by End-user - Percentage Breakdown of Value Sales for Residential, Commercial and Industrial for the Years 2015, 2025 & 2030
- FRANCE
- Manufactured Sand and Granite Market Presence - Strong/Active/Niche/Trivial - Key Competitors in France for 2025 (E)
- TABLE 53: France Recent Past, Current & Future Analysis for Manufactured Sand and Granite by Product Type - Manufactured Sand and Granite - Independent Analysis of Annual Sales in US$ Million for the Years 2024 through 2030 and % CAGR
- TABLE 54: France Historic Review for Manufactured Sand and Granite by Product Type - Manufactured Sand and Granite Markets - Independent Analysis of Annual Sales in US$ Million for Years 2015 through 2023 and % CAGR
- TABLE 55: France 15-Year Perspective for Manufactured Sand and Granite by Product Type - Percentage Breakdown of Value Sales for Manufactured Sand and Granite for the Years 2015, 2025 & 2030
- TABLE 56: France Recent Past, Current & Future Analysis for Manufactured Sand and Granite by End-user - Residential, Commercial and Industrial - Independent Analysis of Annual Sales in US$ Million for the Years 2024 through 2030 and % CAGR
- TABLE 57: France Historic Review for Manufactured Sand and Granite by End-user - Residential, Commercial and Industrial Markets - Independent Analysis of Annual Sales in US$ Million for Years 2015 through 2023 and % CAGR
- TABLE 58: France 15-Year Perspective for Manufactured Sand and Granite by End-user - Percentage Breakdown of Value Sales for Residential, Commercial and Industrial for the Years 2015, 2025 & 2030
- GERMANY
- Manufactured Sand and Granite Market Presence - Strong/Active/Niche/Trivial - Key Competitors in Germany for 2025 (E)
- TABLE 59: Germany Recent Past, Current & Future Analysis for Manufactured Sand and Granite by Product Type - Manufactured Sand and Granite - Independent Analysis of Annual Sales in US$ Million for the Years 2024 through 2030 and % CAGR
- TABLE 60: Germany Historic Review for Manufactured Sand and Granite by Product Type - Manufactured Sand and Granite Markets - Independent Analysis of Annual Sales in US$ Million for Years 2015 through 2023 and % CAGR
- TABLE 61: Germany 15-Year Perspective for Manufactured Sand and Granite by Product Type - Percentage Breakdown of Value Sales for Manufactured Sand and Granite for the Years 2015, 2025 & 2030
- TABLE 62: Germany Recent Past, Current & Future Analysis for Manufactured Sand and Granite by End-user - Residential, Commercial and Industrial - Independent Analysis of Annual Sales in US$ Million for the Years 2024 through 2030 and % CAGR
- TABLE 63: Germany Historic Review for Manufactured Sand and Granite by End-user - Residential, Commercial and Industrial Markets - Independent Analysis of Annual Sales in US$ Million for Years 2015 through 2023 and % CAGR
- TABLE 64: Germany 15-Year Perspective for Manufactured Sand and Granite by End-user - Percentage Breakdown of Value Sales for Residential, Commercial and Industrial for the Years 2015, 2025 & 2030
- ITALY
- TABLE 65: Italy Recent Past, Current & Future Analysis for Manufactured Sand and Granite by Product Type - Manufactured Sand and Granite - Independent Analysis of Annual Sales in US$ Million for the Years 2024 through 2030 and % CAGR
- TABLE 66: Italy Historic Review for Manufactured Sand and Granite by Product Type - Manufactured Sand and Granite Markets - Independent Analysis of Annual Sales in US$ Million for Years 2015 through 2023 and % CAGR
- TABLE 67: Italy 15-Year Perspective for Manufactured Sand and Granite by Product Type - Percentage Breakdown of Value Sales for Manufactured Sand and Granite for the Years 2015, 2025 & 2030
- TABLE 68: Italy Recent Past, Current & Future Analysis for Manufactured Sand and Granite by End-user - Residential, Commercial and Industrial - Independent Analysis of Annual Sales in US$ Million for the Years 2024 through 2030 and % CAGR
- TABLE 69: Italy Historic Review for Manufactured Sand and Granite by End-user - Residential, Commercial and Industrial Markets - Independent Analysis of Annual Sales in US$ Million for Years 2015 through 2023 and % CAGR
- TABLE 70: Italy 15-Year Perspective for Manufactured Sand and Granite by End-user - Percentage Breakdown of Value Sales for Residential, Commercial and Industrial for the Years 2015, 2025 & 2030
- UNITED KINGDOM
- Manufactured Sand and Granite Market Presence - Strong/Active/Niche/Trivial - Key Competitors in the United Kingdom for 2025 (E)
- TABLE 71: UK Recent Past, Current & Future Analysis for Manufactured Sand and Granite by Product Type - Manufactured Sand and Granite - Independent Analysis of Annual Sales in US$ Million for the Years 2024 through 2030 and % CAGR
- TABLE 72: UK Historic Review for Manufactured Sand and Granite by Product Type - Manufactured Sand and Granite Markets - Independent Analysis of Annual Sales in US$ Million for Years 2015 through 2023 and % CAGR
- TABLE 73: UK 15-Year Perspective for Manufactured Sand and Granite by Product Type - Percentage Breakdown of Value Sales for Manufactured Sand and Granite for the Years 2015, 2025 & 2030
- TABLE 74: UK Recent Past, Current & Future Analysis for Manufactured Sand and Granite by End-user - Residential, Commercial and Industrial - Independent Analysis of Annual Sales in US$ Million for the Years 2024 through 2030 and % CAGR
- TABLE 75: UK Historic Review for Manufactured Sand and Granite by End-user - Residential, Commercial and Industrial Markets - Independent Analysis of Annual Sales in US$ Million for Years 2015 through 2023 and % CAGR
- TABLE 76: UK 15-Year Perspective for Manufactured Sand and Granite by End-user - Percentage Breakdown of Value Sales for Residential, Commercial and Industrial for the Years 2015, 2025 & 2030
- SPAIN
- TABLE 77: Spain Recent Past, Current & Future Analysis for Manufactured Sand and Granite by Product Type - Manufactured Sand and Granite - Independent Analysis of Annual Sales in US$ Million for the Years 2024 through 2030 and % CAGR
- TABLE 78: Spain Historic Review for Manufactured Sand and Granite by Product Type - Manufactured Sand and Granite Markets - Independent Analysis of Annual Sales in US$ Million for Years 2015 through 2023 and % CAGR
- TABLE 79: Spain 15-Year Perspective for Manufactured Sand and Granite by Product Type - Percentage Breakdown of Value Sales for Manufactured Sand and Granite for the Years 2015, 2025 & 2030
- TABLE 80: Spain Recent Past, Current & Future Analysis for Manufactured Sand and Granite by End-user - Residential, Commercial and Industrial - Independent Analysis of Annual Sales in US$ Million for the Years 2024 through 2030 and % CAGR
- TABLE 81: Spain Historic Review for Manufactured Sand and Granite by End-user - Residential, Commercial and Industrial Markets - Independent Analysis of Annual Sales in US$ Million for Years 2015 through 2023 and % CAGR
- TABLE 82: Spain 15-Year Perspective for Manufactured Sand and Granite by End-user - Percentage Breakdown of Value Sales for Residential, Commercial and Industrial for the Years 2015, 2025 & 2030
- RUSSIA
- TABLE 83: Russia Recent Past, Current & Future Analysis for Manufactured Sand and Granite by Product Type - Manufactured Sand and Granite - Independent Analysis of Annual Sales in US$ Million for the Years 2024 through 2030 and % CAGR
- TABLE 84: Russia Historic Review for Manufactured Sand and Granite by Product Type - Manufactured Sand and Granite Markets - Independent Analysis of Annual Sales in US$ Million for Years 2015 through 2023 and % CAGR
- TABLE 85: Russia 15-Year Perspective for Manufactured Sand and Granite by Product Type - Percentage Breakdown of Value Sales for Manufactured Sand and Granite for the Years 2015, 2025 & 2030
- TABLE 86: Russia Recent Past, Current & Future Analysis for Manufactured Sand and Granite by End-user - Residential, Commercial and Industrial - Independent Analysis of Annual Sales in US$ Million for the Years 2024 through 2030 and % CAGR
- TABLE 87: Russia Historic Review for Manufactured Sand and Granite by End-user - Residential, Commercial and Industrial Markets - Independent Analysis of Annual Sales in US$ Million for Years 2015 through 2023 and % CAGR
- TABLE 88: Russia 15-Year Perspective for Manufactured Sand and Granite by End-user - Percentage Breakdown of Value Sales for Residential, Commercial and Industrial for the Years 2015, 2025 & 2030
- REST OF EUROPE
- TABLE 89: Rest of Europe Recent Past, Current & Future Analysis for Manufactured Sand and Granite by Product Type - Manufactured Sand and Granite - Independent Analysis of Annual Sales in US$ Million for the Years 2024 through 2030 and % CAGR
- TABLE 90: Rest of Europe Historic Review for Manufactured Sand and Granite by Product Type - Manufactured Sand and Granite Markets - Independent Analysis of Annual Sales in US$ Million for Years 2015 through 2023 and % CAGR
- TABLE 91: Rest of Europe 15-Year Perspective for Manufactured Sand and Granite by Product Type - Percentage Breakdown of Value Sales for Manufactured Sand and Granite for the Years 2015, 2025 & 2030
- TABLE 92: Rest of Europe Recent Past, Current & Future Analysis for Manufactured Sand and Granite by End-user - Residential, Commercial and Industrial - Independent Analysis of Annual Sales in US$ Million for the Years 2024 through 2030 and % CAGR
- TABLE 93: Rest of Europe Historic Review for Manufactured Sand and Granite by End-user - Residential, Commercial and Industrial Markets - Independent Analysis of Annual Sales in US$ Million for Years 2015 through 2023 and % CAGR
- TABLE 94: Rest of Europe 15-Year Perspective for Manufactured Sand and Granite by End-user - Percentage Breakdown of Value Sales for Residential, Commercial and Industrial for the Years 2015, 2025 & 2030
- ASIA-PACIFIC
- Manufactured Sand and Granite Market Presence - Strong/Active/Niche/Trivial - Key Competitors in Asia-Pacific for 2025 (E)
- TABLE 95: Asia-Pacific Recent Past, Current & Future Analysis for Manufactured Sand and Granite by Geographic Region - Australia, India, South Korea and Rest of Asia-Pacific Markets - Independent Analysis of Annual Sales in US$ Million for Years 2024 through 2030 and % CAGR
- TABLE 96: Asia-Pacific Historic Review for Manufactured Sand and Granite by Geographic Region - Australia, India, South Korea and Rest of Asia-Pacific Markets - Independent Analysis of Annual Sales in US$ Million for Years 2015 through 2023 and % CAGR
- TABLE 97: Asia-Pacific 15-Year Perspective for Manufactured Sand and Granite by Geographic Region - Percentage Breakdown of Value Sales for Australia, India, South Korea and Rest of Asia-Pacific Markets for Years 2015, 2025 & 2030
- TABLE 98: Asia-Pacific Recent Past, Current & Future Analysis for Manufactured Sand and Granite by Product Type - Manufactured Sand and Granite - Independent Analysis of Annual Sales in US$ Million for the Years 2024 through 2030 and % CAGR
- TABLE 99: Asia-Pacific Historic Review for Manufactured Sand and Granite by Product Type - Manufactured Sand and Granite Markets - Independent Analysis of Annual Sales in US$ Million for Years 2015 through 2023 and % CAGR
- TABLE 100: Asia-Pacific 15-Year Perspective for Manufactured Sand and Granite by Product Type - Percentage Breakdown of Value Sales for Manufactured Sand and Granite for the Years 2015, 2025 & 2030
- TABLE 101: Asia-Pacific Recent Past, Current & Future Analysis for Manufactured Sand and Granite by End-user - Residential, Commercial and Industrial - Independent Analysis of Annual Sales in US$ Million for the Years 2024 through 2030 and % CAGR
- TABLE 102: Asia-Pacific Historic Review for Manufactured Sand and Granite by End-user - Residential, Commercial and Industrial Markets - Independent Analysis of Annual Sales in US$ Million for Years 2015 through 2023 and % CAGR
- TABLE 103: Asia-Pacific 15-Year Perspective for Manufactured Sand and Granite by End-user - Percentage Breakdown of Value Sales for Residential, Commercial and Industrial for the Years 2015, 2025 & 2030
- AUSTRALIA
- Manufactured Sand and Granite Market Presence - Strong/Active/Niche/Trivial - Key Competitors in Australia for 2025 (E)
- TABLE 104: Australia Recent Past, Current & Future Analysis for Manufactured Sand and Granite by Product Type - Manufactured Sand and Granite - Independent Analysis of Annual Sales in US$ Million for the Years 2024 through 2030 and % CAGR
- TABLE 105: Australia Historic Review for Manufactured Sand and Granite by Product Type - Manufactured Sand and Granite Markets - Independent Analysis of Annual Sales in US$ Million for Years 2015 through 2023 and % CAGR
- TABLE 106: Australia 15-Year Perspective for Manufactured Sand and Granite by Product Type - Percentage Breakdown of Value Sales for Manufactured Sand and Granite for the Years 2015, 2025 & 2030
- TABLE 107: Australia Recent Past, Current & Future Analysis for Manufactured Sand and Granite by End-user - Residential, Commercial and Industrial - Independent Analysis of Annual Sales in US$ Million for the Years 2024 through 2030 and % CAGR
- TABLE 108: Australia Historic Review for Manufactured Sand and Granite by End-user - Residential, Commercial and Industrial Markets - Independent Analysis of Annual Sales in US$ Million for Years 2015 through 2023 and % CAGR
- TABLE 109: Australia 15-Year Perspective for Manufactured Sand and Granite by End-user - Percentage Breakdown of Value Sales for Residential, Commercial and Industrial for the Years 2015, 2025 & 2030
- INDIA
- Manufactured Sand and Granite Market Presence - Strong/Active/Niche/Trivial - Key Competitors in India for 2025 (E)
- TABLE 110: India Recent Past, Current & Future Analysis for Manufactured Sand and Granite by Product Type - Manufactured Sand and Granite - Independent Analysis of Annual Sales in US$ Million for the Years 2024 through 2030 and % CAGR
- TABLE 111: India Historic Review for Manufactured Sand and Granite by Product Type - Manufactured Sand and Granite Markets - Independent Analysis of Annual Sales in US$ Million for Years 2015 through 2023 and % CAGR
- TABLE 112: India 15-Year Perspective for Manufactured Sand and Granite by Product Type - Percentage Breakdown of Value Sales for Manufactured Sand and Granite for the Years 2015, 2025 & 2030
- TABLE 113: India Recent Past, Current & Future Analysis for Manufactured Sand and Granite by End-user - Residential, Commercial and Industrial - Independent Analysis of Annual Sales in US$ Million for the Years 2024 through 2030 and % CAGR
- TABLE 114: India Historic Review for Manufactured Sand and Granite by End-user - Residential, Commercial and Industrial Markets - Independent Analysis of Annual Sales in US$ Million for Years 2015 through 2023 and % CAGR
- TABLE 115: India 15-Year Perspective for Manufactured Sand and Granite by End-user - Percentage Breakdown of Value Sales for Residential, Commercial and Industrial for the Years 2015, 2025 & 2030
- SOUTH KOREA
- TABLE 116: South Korea Recent Past, Current & Future Analysis for Manufactured Sand and Granite by Product Type - Manufactured Sand and Granite - Independent Analysis of Annual Sales in US$ Million for the Years 2024 through 2030 and % CAGR
- TABLE 117: South Korea Historic Review for Manufactured Sand and Granite by Product Type - Manufactured Sand and Granite Markets - Independent Analysis of Annual Sales in US$ Million for Years 2015 through 2023 and % CAGR
- TABLE 118: South Korea 15-Year Perspective for Manufactured Sand and Granite by Product Type - Percentage Breakdown of Value Sales for Manufactured Sand and Granite for the Years 2015, 2025 & 2030
- TABLE 119: South Korea Recent Past, Current & Future Analysis for Manufactured Sand and Granite by End-user - Residential, Commercial and Industrial - Independent Analysis of Annual Sales in US$ Million for the Years 2024 through 2030 and % CAGR
- TABLE 120: South Korea Historic Review for Manufactured Sand and Granite by End-user - Residential, Commercial and Industrial Markets - Independent Analysis of Annual Sales in US$ Million for Years 2015 through 2023 and % CAGR
- TABLE 121: South Korea 15-Year Perspective for Manufactured Sand and Granite by End-user - Percentage Breakdown of Value Sales for Residential, Commercial and Industrial for the Years 2015, 2025 & 2030
- REST OF ASIA-PACIFIC
- TABLE 122: Rest of Asia-Pacific Recent Past, Current & Future Analysis for Manufactured Sand and Granite by Product Type - Manufactured Sand and Granite - Independent Analysis of Annual Sales in US$ Million for the Years 2024 through 2030 and % CAGR
- TABLE 123: Rest of Asia-Pacific Historic Review for Manufactured Sand and Granite by Product Type - Manufactured Sand and Granite Markets - Independent Analysis of Annual Sales in US$ Million for Years 2015 through 2023 and % CAGR
- TABLE 124: Rest of Asia-Pacific 15-Year Perspective for Manufactured Sand and Granite by Product Type - Percentage Breakdown of Value Sales for Manufactured Sand and Granite for the Years 2015, 2025 & 2030
- TABLE 125: Rest of Asia-Pacific Recent Past, Current & Future Analysis for Manufactured Sand and Granite by End-user - Residential, Commercial and Industrial - Independent Analysis of Annual Sales in US$ Million for the Years 2024 through 2030 and % CAGR
- TABLE 126: Rest of Asia-Pacific Historic Review for Manufactured Sand and Granite by End-user - Residential, Commercial and Industrial Markets - Independent Analysis of Annual Sales in US$ Million for Years 2015 through 2023 and % CAGR
- TABLE 127: Rest of Asia-Pacific 15-Year Perspective for Manufactured Sand and Granite by End-user - Percentage Breakdown of Value Sales for Residential, Commercial and Industrial for the Years 2015, 2025 & 2030
- LATIN AMERICA
- Manufactured Sand and Granite Market Presence - Strong/Active/Niche/Trivial - Key Competitors in Latin America for 2025 (E)
- TABLE 128: Latin America Recent Past, Current & Future Analysis for Manufactured Sand and Granite by Geographic Region - Argentina, Brazil, Mexico and Rest of Latin America Markets - Independent Analysis of Annual Sales in US$ Million for Years 2024 through 2030 and % CAGR
- TABLE 129: Latin America Historic Review for Manufactured Sand and Granite by Geographic Region - Argentina, Brazil, Mexico and Rest of Latin America Markets - Independent Analysis of Annual Sales in US$ Million for Years 2015 through 2023 and % CAGR
- TABLE 130: Latin America 15-Year Perspective for Manufactured Sand and Granite by Geographic Region - Percentage Breakdown of Value Sales for Argentina, Brazil, Mexico and Rest of Latin America Markets for Years 2015, 2025 & 2030
- TABLE 131: Latin America Recent Past, Current & Future Analysis for Manufactured Sand and Granite by Product Type - Manufactured Sand and Granite - Independent Analysis of Annual Sales in US$ Million for the Years 2024 through 2030 and % CAGR
- TABLE 132: Latin America Historic Review for Manufactured Sand and Granite by Product Type - Manufactured Sand and Granite Markets - Independent Analysis of Annual Sales in US$ Million for Years 2015 through 2023 and % CAGR
- TABLE 133: Latin America 15-Year Perspective for Manufactured Sand and Granite by Product Type - Percentage Breakdown of Value Sales for Manufactured Sand and Granite for the Years 2015, 2025 & 2030
- TABLE 134: Latin America Recent Past, Current & Future Analysis for Manufactured Sand and Granite by End-user - Residential, Commercial and Industrial - Independent Analysis of Annual Sales in US$ Million for the Years 2024 through 2030 and % CAGR
- TABLE 135: Latin America Historic Review for Manufactured Sand and Granite by End-user - Residential, Commercial and Industrial Markets - Independent Analysis of Annual Sales in US$ Million for Years 2015 through 2023 and % CAGR
- TABLE 136: Latin America 15-Year Perspective for Manufactured Sand and Granite by End-user - Percentage Breakdown of Value Sales for Residential, Commercial and Industrial for the Years 2015, 2025 & 2030
- ARGENTINA
- TABLE 137: Argentina Recent Past, Current & Future Analysis for Manufactured Sand and Granite by Product Type - Manufactured Sand and Granite - Independent Analysis of Annual Sales in US$ Million for the Years 2024 through 2030 and % CAGR
- TABLE 138: Argentina Historic Review for Manufactured Sand and Granite by Product Type - Manufactured Sand and Granite Markets - Independent Analysis of Annual Sales in US$ Million for Years 2015 through 2023 and % CAGR
- TABLE 139: Argentina 15-Year Perspective for Manufactured Sand and Granite by Product Type - Percentage Breakdown of Value Sales for Manufactured Sand and Granite for the Years 2015, 2025 & 2030
- TABLE 140: Argentina Recent Past, Current & Future Analysis for Manufactured Sand and Granite by End-user - Residential, Commercial and Industrial - Independent Analysis of Annual Sales in US$ Million for the Years 2024 through 2030 and % CAGR
- TABLE 141: Argentina Historic Review for Manufactured Sand and Granite by End-user - Residential, Commercial and Industrial Markets - Independent Analysis of Annual Sales in US$ Million for Years 2015 through 2023 and % CAGR
- TABLE 142: Argentina 15-Year Perspective for Manufactured Sand and Granite by End-user - Percentage Breakdown of Value Sales for Residential, Commercial and Industrial for the Years 2015, 2025 & 2030
- BRAZIL
- TABLE 143: Brazil Recent Past, Current & Future Analysis for Manufactured Sand and Granite by Product Type - Manufactured Sand and Granite - Independent Analysis of Annual Sales in US$ Million for the Years 2024 through 2030 and % CAGR
- TABLE 144: Brazil Historic Review for Manufactured Sand and Granite by Product Type - Manufactured Sand and Granite Markets - Independent Analysis of Annual Sales in US$ Million for Years 2015 through 2023 and % CAGR
- TABLE 145: Brazil 15-Year Perspective for Manufactured Sand and Granite by Product Type - Percentage Breakdown of Value Sales for Manufactured Sand and Granite for the Years 2015, 2025 & 2030
- TABLE 146: Brazil Recent Past, Current & Future Analysis for Manufactured Sand and Granite by End-user - Residential, Commercial and Industrial - Independent Analysis of Annual Sales in US$ Million for the Years 2024 through 2030 and % CAGR
- TABLE 147: Brazil Historic Review for Manufactured Sand and Granite by End-user - Residential, Commercial and Industrial Markets - Independent Analysis of Annual Sales in US$ Million for Years 2015 through 2023 and % CAGR
- TABLE 148: Brazil 15-Year Perspective for Manufactured Sand and Granite by End-user - Percentage Breakdown of Value Sales for Residential, Commercial and Industrial for the Years 2015, 2025 & 2030
- MEXICO
- TABLE 149: Mexico Recent Past, Current & Future Analysis for Manufactured Sand and Granite by Product Type - Manufactured Sand and Granite - Independent Analysis of Annual Sales in US$ Million for the Years 2024 through 2030 and % CAGR
- TABLE 150: Mexico Historic Review for Manufactured Sand and Granite by Product Type - Manufactured Sand and Granite Markets - Independent Analysis of Annual Sales in US$ Million for Years 2015 through 2023 and % CAGR
- TABLE 151: Mexico 15-Year Perspective for Manufactured Sand and Granite by Product Type - Percentage Breakdown of Value Sales for Manufactured Sand and Granite for the Years 2015, 2025 & 2030
- TABLE 152: Mexico Recent Past, Current & Future Analysis for Manufactured Sand and Granite by End-user - Residential, Commercial and Industrial - Independent Analysis of Annual Sales in US$ Million for the Years 2024 through 2030 and % CAGR
- TABLE 153: Mexico Historic Review for Manufactured Sand and Granite by End-user - Residential, Commercial and Industrial Markets - Independent Analysis of Annual Sales in US$ Million for Years 2015 through 2023 and % CAGR
- TABLE 154: Mexico 15-Year Perspective for Manufactured Sand and Granite by End-user - Percentage Breakdown of Value Sales for Residential, Commercial and Industrial for the Years 2015, 2025 & 2030
- REST OF LATIN AMERICA
- TABLE 155: Rest of Latin America Recent Past, Current & Future Analysis for Manufactured Sand and Granite by Product Type - Manufactured Sand and Granite - Independent Analysis of Annual Sales in US$ Million for the Years 2024 through 2030 and % CAGR
- TABLE 156: Rest of Latin America Historic Review for Manufactured Sand and Granite by Product Type - Manufactured Sand and Granite Markets - Independent Analysis of Annual Sales in US$ Million for Years 2015 through 2023 and % CAGR
- TABLE 157: Rest of Latin America 15-Year Perspective for Manufactured Sand and Granite by Product Type - Percentage Breakdown of Value Sales for Manufactured Sand and Granite for the Years 2015, 2025 & 2030
- TABLE 158: Rest of Latin America Recent Past, Current & Future Analysis for Manufactured Sand and Granite by End-user - Residential, Commercial and Industrial - Independent Analysis of Annual Sales in US$ Million for the Years 2024 through 2030 and % CAGR
- TABLE 159: Rest of Latin America Historic Review for Manufactured Sand and Granite by End-user - Residential, Commercial and Industrial Markets - Independent Analysis of Annual Sales in US$ Million for Years 2015 through 2023 and % CAGR
- TABLE 160: Rest of Latin America 15-Year Perspective for Manufactured Sand and Granite by End-user - Percentage Breakdown of Value Sales for Residential, Commercial and Industrial for the Years 2015, 2025 & 2030
- MIDDLE EAST
- Manufactured Sand and Granite Market Presence - Strong/Active/Niche/Trivial - Key Competitors in Middle East for 2025 (E)
- TABLE 161: Middle East Recent Past, Current & Future Analysis for Manufactured Sand and Granite by Geographic Region - Iran, Israel, Saudi Arabia, UAE and Rest of Middle East Markets - Independent Analysis of Annual Sales in US$ Million for Years 2024 through 2030 and % CAGR
- TABLE 162: Middle East Historic Review for Manufactured Sand and Granite by Geographic Region - Iran, Israel, Saudi Arabia, UAE and Rest of Middle East Markets - Independent Analysis of Annual Sales in US$ Million for Years 2015 through 2023 and % CAGR
- TABLE 163: Middle East 15-Year Perspective for Manufactured Sand and Granite by Geographic Region - Percentage Breakdown of Value Sales for Iran, Israel, Saudi Arabia, UAE and Rest of Middle East Markets for Years 2015, 2025 & 2030
- TABLE 164: Middle East Recent Past, Current & Future Analysis for Manufactured Sand and Granite by Product Type - Manufactured Sand and Granite - Independent Analysis of Annual Sales in US$ Million for the Years 2024 through 2030 and % CAGR
- TABLE 165: Middle East Historic Review for Manufactured Sand and Granite by Product Type - Manufactured Sand and Granite Markets - Independent Analysis of Annual Sales in US$ Million for Years 2015 through 2023 and % CAGR
- TABLE 166: Middle East 15-Year Perspective for Manufactured Sand and Granite by Product Type - Percentage Breakdown of Value Sales for Manufactured Sand and Granite for the Years 2015, 2025 & 2030
- TABLE 167: Middle East Recent Past, Current & Future Analysis for Manufactured Sand and Granite by End-user - Residential, Commercial and Industrial - Independent Analysis of Annual Sales in US$ Million for the Years 2024 through 2030 and % CAGR
- TABLE 168: Middle East Historic Review for Manufactured Sand and Granite by End-user - Residential, Commercial and Industrial Markets - Independent Analysis of Annual Sales in US$ Million for Years 2015 through 2023 and % CAGR
- TABLE 169: Middle East 15-Year Perspective for Manufactured Sand and Granite by End-user - Percentage Breakdown of Value Sales for Residential, Commercial and Industrial for the Years 2015, 2025 & 2030
- IRAN
- TABLE 170: Iran Recent Past, Current & Future Analysis for Manufactured Sand and Granite by Product Type - Manufactured Sand and Granite - Independent Analysis of Annual Sales in US$ Million for the Years 2024 through 2030 and % CAGR
- TABLE 171: Iran Historic Review for Manufactured Sand and Granite by Product Type - Manufactured Sand and Granite Markets - Independent Analysis of Annual Sales in US$ Million for Years 2015 through 2023 and % CAGR
- TABLE 172: Iran 15-Year Perspective for Manufactured Sand and Granite by Product Type - Percentage Breakdown of Value Sales for Manufactured Sand and Granite for the Years 2015, 2025 & 2030
- TABLE 173: Iran Recent Past, Current & Future Analysis for Manufactured Sand and Granite by End-user - Residential, Commercial and Industrial - Independent Analysis of Annual Sales in US$ Million for the Years 2024 through 2030 and % CAGR
- TABLE 174: Iran Historic Review for Manufactured Sand and Granite by End-user - Residential, Commercial and Industrial Markets - Independent Analysis of Annual Sales in US$ Million for Years 2015 through 2023 and % CAGR
- TABLE 175: Iran 15-Year Perspective for Manufactured Sand and Granite by End-user - Percentage Breakdown of Value Sales for Residential, Commercial and Industrial for the Years 2015, 2025 & 2030
- ISRAEL
- TABLE 176: Israel Recent Past, Current & Future Analysis for Manufactured Sand and Granite by Product Type - Manufactured Sand and Granite - Independent Analysis of Annual Sales in US$ Million for the Years 2024 through 2030 and % CAGR
- TABLE 177: Israel Historic Review for Manufactured Sand and Granite by Product Type - Manufactured Sand and Granite Markets - Independent Analysis of Annual Sales in US$ Million for Years 2015 through 2023 and % CAGR
- TABLE 178: Israel 15-Year Perspective for Manufactured Sand and Granite by Product Type - Percentage Breakdown of Value Sales for Manufactured Sand and Granite for the Years 2015, 2025 & 2030
- TABLE 179: Israel Recent Past, Current & Future Analysis for Manufactured Sand and Granite by End-user - Residential, Commercial and Industrial - Independent Analysis of Annual Sales in US$ Million for the Years 2024 through 2030 and % CAGR
- TABLE 180: Israel Historic Review for Manufactured Sand and Granite by End-user - Residential, Commercial and Industrial Markets - Independent Analysis of Annual Sales in US$ Million for Years 2015 through 2023 and % CAGR
- TABLE 181: Israel 15-Year Perspective for Manufactured Sand and Granite by End-user - Percentage Breakdown of Value Sales for Residential, Commercial and Industrial for the Years 2015, 2025 & 2030
- SAUDI ARABIA
- TABLE 182: Saudi Arabia Recent Past, Current & Future Analysis for Manufactured Sand and Granite by Product Type - Manufactured Sand and Granite - Independent Analysis of Annual Sales in US$ Million for the Years 2024 through 2030 and % CAGR
- TABLE 183: Saudi Arabia Historic Review for Manufactured Sand and Granite by Product Type - Manufactured Sand and Granite Markets - Independent Analysis of Annual Sales in US$ Million for Years 2015 through 2023 and % CAGR
- TABLE 184: Saudi Arabia 15-Year Perspective for Manufactured Sand and Granite by Product Type - Percentage Breakdown of Value Sales for Manufactured Sand and Granite for the Years 2015, 2025 & 2030
- TABLE 185: Saudi Arabia Recent Past, Current & Future Analysis for Manufactured Sand and Granite by End-user - Residential, Commercial and Industrial - Independent Analysis of Annual Sales in US$ Million for the Years 2024 through 2030 and % CAGR
- TABLE 186: Saudi Arabia Historic Review for Manufactured Sand and Granite by End-user - Residential, Commercial and Industrial Markets - Independent Analysis of Annual Sales in US$ Million for Years 2015 through 2023 and % CAGR
- TABLE 187: Saudi Arabia 15-Year Perspective for Manufactured Sand and Granite by End-user - Percentage Breakdown of Value Sales for Residential, Commercial and Industrial for the Years 2015, 2025 & 2030
- UNITED ARAB EMIRATES
- TABLE 188: UAE Recent Past, Current & Future Analysis for Manufactured Sand and Granite by Product Type - Manufactured Sand and Granite - Independent Analysis of Annual Sales in US$ Million for the Years 2024 through 2030 and % CAGR
- TABLE 189: UAE Historic Review for Manufactured Sand and Granite by Product Type - Manufactured Sand and Granite Markets - Independent Analysis of Annual Sales in US$ Million for Years 2015 through 2023 and % CAGR
- TABLE 190: UAE 15-Year Perspective for Manufactured Sand and Granite by Product Type - Percentage Breakdown of Value Sales for Manufactured Sand and Granite for the Years 2015, 2025 & 2030
- TABLE 191: UAE Recent Past, Current & Future Analysis for Manufactured Sand and Granite by End-user - Residential, Commercial and Industrial - Independent Analysis of Annual Sales in US$ Million for the Years 2024 through 2030 and % CAGR
- TABLE 192: UAE Historic Review for Manufactured Sand and Granite by End-user - Residential, Commercial and Industrial Markets - Independent Analysis of Annual Sales in US$ Million for Years 2015 through 2023 and % CAGR
- TABLE 193: UAE 15-Year Perspective for Manufactured Sand and Granite by End-user - Percentage Breakdown of Value Sales for Residential, Commercial and Industrial for the Years 2015, 2025 & 2030
- REST OF MIDDLE EAST
- TABLE 194: Rest of Middle East Recent Past, Current & Future Analysis for Manufactured Sand and Granite by Product Type - Manufactured Sand and Granite - Independent Analysis of Annual Sales in US$ Million for the Years 2024 through 2030 and % CAGR
- TABLE 195: Rest of Middle East Historic Review for Manufactured Sand and Granite by Product Type - Manufactured Sand and Granite Markets - Independent Analysis of Annual Sales in US$ Million for Years 2015 through 2023 and % CAGR
- TABLE 196: Rest of Middle East 15-Year Perspective for Manufactured Sand and Granite by Product Type - Percentage Breakdown of Value Sales for Manufactured Sand and Granite for the Years 2015, 2025 & 2030
- TABLE 197: Rest of Middle East Recent Past, Current & Future Analysis for Manufactured Sand and Granite by End-user - Residential, Commercial and Industrial - Independent Analysis of Annual Sales in US$ Million for the Years 2024 through 2030 and % CAGR
- TABLE 198: Rest of Middle East Historic Review for Manufactured Sand and Granite by End-user - Residential, Commercial and Industrial Markets - Independent Analysis of Annual Sales in US$ Million for Years 2015 through 2023 and % CAGR
- TABLE 199: Rest of Middle East 15-Year Perspective for Manufactured Sand and Granite by End-user - Percentage Breakdown of Value Sales for Residential, Commercial and Industrial for the Years 2015, 2025 & 2030
- AFRICA
- Manufactured Sand and Granite Market Presence - Strong/Active/Niche/Trivial - Key Competitors in Africa for 2025 (E)
- TABLE 200: Africa Recent Past, Current & Future Analysis for Manufactured Sand and Granite by Product Type - Manufactured Sand and Granite - Independent Analysis of Annual Sales in US$ Million for the Years 2024 through 2030 and % CAGR
- TABLE 201: Africa Historic Review for Manufactured Sand and Granite by Product Type - Manufactured Sand and Granite Markets - Independent Analysis of Annual Sales in US$ Million for Years 2015 through 2023 and % CAGR
- TABLE 202: Africa 15-Year Perspective for Manufactured Sand and Granite by Product Type - Percentage Breakdown of Value Sales for Manufactured Sand and Granite for the Years 2015, 2025 & 2030
- TABLE 203: Africa Recent Past, Current & Future Analysis for Manufactured Sand and Granite by End-user - Residential, Commercial and Industrial - Independent Analysis of Annual Sales in US$ Million for the Years 2024 through 2030 and % CAGR
- TABLE 204: Africa Historic Review for Manufactured Sand and Granite by End-user - Residential, Commercial and Industrial Markets - Independent Analysis of Annual Sales in US$ Million for Years 2015 through 2023 and % CAGR
- TABLE 205: Africa 15-Year Perspective for Manufactured Sand and Granite by End-user - Percentage Breakdown of Value Sales for Residential, Commercial and Industrial for the Years 2015, 2025 & 2030

