|
|
市場調査レポート
商品コード
1260667
欧州産業用ヒートポンプの市場規模:製品別、容量別、温度別、用途別、予測2023年~2032年Europe Industrial Heat Pump Market Size By Product, By Capacity, By Temperature, By Application, & Forecast 2023 - 2032 |
||||||
|
|
|||||||
|
● お客様のご希望に応じて、既存データの加工や未掲載情報(例:国別セグメント)の追加などの対応が可能です。 詳細はお問い合わせください。 |
|||||||


| 欧州産業用ヒートポンプの市場規模:製品別、容量別、温度別、用途別、予測2023年~2032年 |
|
出版日: 2023年03月20日
発行: Global Market Insights Inc.
ページ情報: 英文 460 Pages
納期: 2~3営業日
|
- 全表示
- 概要
- 図表
- 目次
欧州の産業用ヒートポンプ市場は、暖房エネルギーの消費を最小限に抑え、従来の暖房システムに代わるエネルギー効率の高いヒートポンプの導入が増加していることから、2023年から2032年にかけて高い勢いを示すと予想されています。
ヒートポンプは、暖房や冷房の用途に広く使われている有名な技術の一つです。ヒートポンプは、熱源から低級な熱を取り除き、それを高温で供給することで熱を伝える機械装置です。住宅や産業分野で幅広く利用されているため、今後の市場拡大が期待されています。
全体として、欧州の産業用ヒートポンプ産業は、製品、容量、温度、用途、国の観点から区分されます。
製品別では、2032年までに空気熱源ヒートポンプの分野が大きく注目されるでしょう。低カーボンフットプリント、低メンテナンス、高い季節性能係数などが、産業用空気源ヒートポンプの展開を促進する主要因となっています。また、省エネルギーや安全で環境に優しい運転などの特典が、セグメントの成長につながります。
容量別では、50 kW以下のセグメントが推定期間中に有利な成長を示すでしょう。暖房および産業部門からのGHG排出量削減に関する懸念の高まりは、クリーンでエネルギー効率の高い技術への需要を急増させ、地域全体の製品採用を積極的に促進します。
温度を考慮すると、150ツーC-200ツーC分野は、推定期間中に市場全体から有益な利益を得ることができると思われます。飲食品、鉄鋼、化学、製紙など、さまざまな産業で高温の産業プロセスが絶えず拡大しており、今後数年間は150ツーC以上の温度レンジのヒートポンプの需要を牽引すると予想されます。
用途別では、製紙分野が2032年までプラスの軌道を描くと予測されています。乾燥、沸騰、漂白など、エネルギー集約型の工程がこの分野の成長に寄与すると考えられます。また、乾燥などの作業から熱を発生させるために給湯器を再利用するなどの製品の利点は、エネルギー消費と温室効果ガス排出の削減につながり、業界全体の製品展開にプラスの影響を与えるでしょう。
国別では、デンマークの産業用ヒートポンプ市場が2022年に1,800万米ドル以上の収益シェアに貢献しました。排出量を管理するための厳しい規制や規範、二酸化炭素排出を緩和するための環境規範の普及が、同国での製品展開を増加させるでしょう。
目次
第1章 調査手法とスコープ
第2章 欧州産業用ヒートポンプ産業の洞察
- 業界のエコシステム分析
- ベンダーマトリクス
- 規制状況について
- 国際標準化機構
- EU指令2010/75/EU、2010年
- エネルギー効率指令(2012/27/EU、2018/2002/EUで改正)
- ヒートポンプとEUの目標値
- 主要な法律
- エネルギー効率化計画2011
- Horizon 2020とHorizon Europe
- LIFE:クリーンエネルギーの変遷
- インベストEU
- EU再生可能エネルギー融資メカニズム
- EUグリーンディール
- ドイツ
- ドイツ省エネ条例(EnEV)
- ヒートポンプの価格補助
- 大型ヒートポンプに対する既存のサポートスキーム
- エネルギーコンセプト-エネルギー戦略
- 英国
- 再生可能エネルギー熱インセンティブ制度規則
- 英国の国家エネルギー効率化行動計画
- CRCエネルギー効率化スキーム
- ヒートポンプレディプログラム
- フィンランド
- 大型ヒートポンプに対する既存のサポートスキーム
- 研究開発を促進するための税制優遇措置について
- ヒートポンプ、電気ボイラー、データセンターで使用される電力に対する物品税が減少します
- デンマーク
- 電気ヒートポンプのインセンティブラウンド
- アイルランド
- アイルランド・ヒートポンプ協会
- ドイツ
- 業界への影響要因
- 促進要因
- 再生可能エネルギー分野へのポジティブな見通し
- 空間暖房の需要急増
- 業界の潜在的リスク&課題
- 高い初期費用
- 促進要因
- COVID-19業界の展望に与える影響について
- 全体像
- 成長性分析
- ポーターの分析
- PESTEL分析
第3章 競合ベンチマーキング
- イノベーションとサステナビリティの展望
- GEA Group Aktiengesellschaft
- PILLER Blowers & Compressors GmbH
- Carrier
- Other innovations
- 競合情勢、2022年
- 戦略ダッシュボード
- 戦略ダッシュボード
- Atlas Copco AB
- Siemens Energy
- Daikin
- Danfoss
- MAN Energy Solutions
- GEA Group Aktiengesellschaft
- Piller Blowers & Compressors GmbH
- AGO GmbH Energie+Anlagen
- Carrier Corporation
- Oilon Group Oy
- Other strategies
第4章 欧州産業用ヒートポンプ市場:製品別
- 主な製品動向
- 空気源
- グラウンドソース
- 水源地
- クローズドサイクル機械式ヒートポンプ
- オープンサイクル機械式蒸気圧縮ヒートポンプ
- オープンサイクル熱圧着ヒートポンプ
- クローズドサイクル吸収式ヒートポンプ
第5章 欧州産業用ヒートポンプ市場:容量別
- 主な容量動向
- ≤50 kW
- 50 kW~250 kW
- 250 kW-500 kW
- 500 kW-1 MW
- 1 MW-2 MW
- 2 MW-5 MW
- >5MW
第6章 欧州産業用ヒートポンプ市場:温度別
- 主な温度動向
- 80ツーC-100ツーC
- 100ツーC-150ツーC
- 150ツーC-200ツーC
- >200ツーC
第7章 欧州産業用ヒートポンプ市場:用途別
- 主なアプリケーション動向
- インダストリアル
- 紙媒体
- 飲食品
- ケミカル
- 鉄鋼
- 機械
- 非金属鉱物
- その他
- 地域暖房
第8章 欧州産業用ヒートポンプ市場:各国別
- 主な国の動向
- 英国
- ノルウェー
- デンマーク
- フィンランド
- スウェーデン
- ドイツ
- ポーランド
- スペイン
- オーストリア
第9章 企業プロファイル
- Piller Blowers & Compressors GmbH
- MAN Energy Solutions
- GEA Group Aktiengesellschaft
- Atlas Copco AB
- Oilon Group Oy
- Siemens Energy
- HELIOTHERM Warmepumpentechnik Ges.m.b.H.
- Carrier
- Trane Technologies International Limited
- AGO GmbH Energie+Anlagen
- Thermax Limited
- Daikin Applied Europe S.p.A.
- Hybrid Energy AS
- OCHSNER
- Danfoss
- Mitsubishi Electric Corporation
Data Tables
- TABLE 1 Industry impact forces
- TABLE 2 Europe market from air source, 2019 - 2022 (Volume & Revenue)
- TABLE 3 Europe market from air source, 2023 - 2028 (Volume & Revenue)
- TABLE 4 Europe market from air source, 2029 - 2032 (Volume & Revenue)
- TABLE 5 Europe market from air source, by country, 2019 - 2022 (Units)
- TABLE 6 Europe market from air source, by country, 2023 - 2028 (Units)
- TABLE 7 Europe market from air source, by country, 2029 - 2032 (Units)
- TABLE 8 Europe market from air source, by country, 2019 - 2022 (USD Million)
- TABLE 9 Europe market from air source, by country, 2023 - 2028 (USD Million)
- TABLE 10 Europe market from air source, by country, 2029 - 2032 (USD Million)
- TABLE 11 Europe market from ground source, 2019 - 2022 (Volume & Revenue)
- TABLE 12 Europe market from ground source, 2023 - 2028 (Volume & Revenue)
- TABLE 13 Europe market from ground source, 2029 - 2032 (Volume & Revenue)
- TABLE 14 Europe market from ground source, by country, 2019 - 2022 (Units)
- TABLE 15 Europe market from ground source, by country, 2023 - 2028 (Units)
- TABLE 16 Europe market from ground source, by country, 2029 - 2032 (Units)
- TABLE 17 Europe market from ground source, by country, 2019 - 2022 (USD Million)
- TABLE 18 Europe market from ground source, by country, 2023 - 2028 (USD Million)
- TABLE 19 Europe market from ground source, by country, 2029 - 2032 (USD Million)
- TABLE 20 Europe market from water source, 2019 - 2022 (Volume & Revenue)
- TABLE 21 Europe market from water source, 2023 - 2028 (Volume & Revenue)
- TABLE 22 Europe market from water source, 2029 - 2032 (Volume & Revenue)
- TABLE 23 Europe market from water source, by country, 2019 - 2022 (Units)
- TABLE 24 Europe market from water source, by country, 2023 - 2028 (Units)
- TABLE 25 Europe market from water source, by country, 2029 - 2032 (Units)
- TABLE 26 Europe market from water source, by country, 2019 - 2022 (USD Million)
- TABLE 27 Europe market from water source, by country, 2023 - 2028 (USD Million)
- TABLE 28 Europe market from water source, by country, 2029 - 2032 (USD Million)
- TABLE 29 Europe market from closed cycle mechanical heat pump, 2019 - 2022 (Volume & Revenue)
- TABLE 30 Europe market from closed cycle mechanical heat pump, 2023 - 2028 (Volume & Revenue)
- TABLE 31 Europe market from closed cycle mechanical heat pump, 2029 - 2032 (Volume & Revenue)
- TABLE 32 Europe market from closed cycle mechanical heat pump, by country, 2019 - 2022 (Units)
- TABLE 33 Europe market from closed cycle mechanical heat pump, by country, 2023 - 2028 (Units)
- TABLE 34 Europe market from closed cycle mechanical heat pump, by country, 2029 - 2032 (Units)
- TABLE 35 Europe market from closed cycle mechanical heat pump, by country, 2019 - 2022 (USD Million)
- TABLE 36 Europe market from closed cycle mechanical heat pump, by country, 2023 - 2028 (USD Million)
- TABLE 37 Europe market from closed cycle mechanical heat pump, by country, 2029 - 2032 (USD Million)
- TABLE 38 Europe market from open cycle mechanical vapor compression heat pump, 2019 - 2022 (Volume & Revenue)
- TABLE 39 Europe market from open cycle mechanical vapor compression heat pump, 2023 - 2028 (Volume & Revenue)
- TABLE 40 Europe market from open cycle mechanical vapor compression heat pump, 2029 - 2032 (Volume & Revenue)
- TABLE 41 Europe market from open cycle mechanical vapor compression heat pump, by country, 2019 - 2022 (Units)
- TABLE 42 Europe market from open cycle mechanical vapor compression heat pump, by country, 2023 - 2028 (Units)
- TABLE 43 Europe market from open cycle mechanical vapor compression heat pump, by country, 2029 - 2032 (Units)
- TABLE 44 Europe market from open cycle mechanical vapor compression heat pump, by country, 2019 - 2022 (USD Million)
- TABLE 45 Europe market from open cycle mechanical vapor compression heat pump, by country, 2023 - 2028 (USD Million)
- TABLE 46 Europe market from open cycle mechanical vapor compression heat pump, by country, 2029 - 2032 (USD Million)
- TABLE 47 Europe market from open cycle thermocompression heat pump, 2019 - 2022 (Volume & Revenue)
- TABLE 48 Europe market from open cycle thermocompression heat pump, 2023 - 2028 (Volume & Revenue)
- TABLE 49 Europe market from open cycle thermocompression heat pump, 2029 - 2032 (Volume & Revenue)
- TABLE 50 Europe market from open cycle thermocompression heat pump, by country, 2019 - 2022 (Units)
- TABLE 51 Europe market from open cycle thermocompression heat pump, by country, 2023 - 2028 (Units)
- TABLE 52 Europe market from open cycle thermocompression heat pump, by country, 2029 - 2032 (Units)
- TABLE 53 Europe market from open cycle thermocompression heat pump, by country, 2019 - 2022 (USD Million)
- TABLE 54 Europe market from open cycle thermocompression heat pump, by country, 2023 - 2028 (USD Million)
- TABLE 55 Europe market from open cycle thermocompression heat pump, by country, 2029 - 2032 (USD Million)
- TABLE 56 Europe market from closed cycle absorption heat pump, 2019 - 2022 (Volume & Revenue)
- TABLE 57 Europe market from closed cycle absorption heat pump, 2023 - 2028 (Volume & Revenue)
- TABLE 58 Europe market from closed cycle absorption heat pump, 2029 - 2032 (Volume & Revenue)
- TABLE 59 Europe market from closed cycle absorption heat pump, by country, 2019 - 2022 (Units)
- TABLE 60 Europe market from closed cycle absorption heat pump, by country, 2023 - 2028 (Units)
- TABLE 61 Europe market from closed cycle absorption heat pump, by country, 2029 - 2032 (Units)
- TABLE 62 Europe market from closed cycle absorption heat pump, by country, 2019 - 2022 (USD Million)
- TABLE 63 Europe market from closed cycle absorption heat pump, by country, 2023 - 2028 (USD Million)
- TABLE 64 Europe market from closed cycle absorption heat pump, by country, 2029 - 2032 (USD Million)
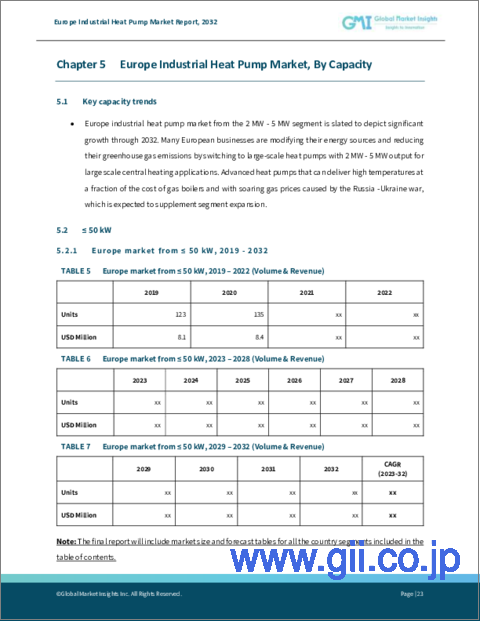
- TABLE 65 Europe market from ≤ 50 kW, 2019 - 2022 (Volume & Revenue)
- TABLE 66 Europe market from ≤ 50 kW, 2023 - 2028 (Volume & Revenue)
- TABLE 67 Europe market from ≤ 50 kW, 2029 - 2032 (Volume & Revenue)
- TABLE 68 Europe market from ≤ 50 kW, by country, 2019 - 2022 (Units)
- TABLE 69 Europe market from ≤ 50 kW, by country, 2023 - 2028 (Units)
- TABLE 70 Europe market from ≤ 50 kW, by country, 2029 - 2032 (Units)
- TABLE 71 Europe market from ≤ 50 kW, by country, 2019 - 2022 (USD Million)
- TABLE 72 Europe market from ≤ 50 kW, by country, 2023 - 2028 (USD Million)
- TABLE 73 Europe market from ≤ 50 kW, by country, 2029 - 2032 (USD Million)
- TABLE 74 Europe market from 50 kW - 250 kW, 2019 - 2022 (Volume & Revenue)
- TABLE 75 Europe market from 50 kW - 250 kW, 2023 - 2028 (Volume & Revenue)
- TABLE 76 Europe market from 50 kW - 250 kW, 2029 - 2032 (Volume & Revenue)
- TABLE 77 Europe market from 50 kW - 250 kW, by country, 2019 - 2022 (Units)
- TABLE 78 Europe market from 50 kW - 250 kW, by country, 2023 - 2028 (Units)
- TABLE 79 Europe market from 50 kW - 250 kW, by country, 2029 - 2032 (Units)
- TABLE 80 Europe market from 50 kW - 250 kW, by country, 2019 - 2022 (USD Million)
- TABLE 81 Europe market from 50 kW - 250 kW, by country, 2023 - 2028 (USD Million)
- TABLE 82 Europe market from 50 kW - 250 kW, by country, 2029 - 2032 (USD Million)
- TABLE 83 Europe market from 250 kW - 500 kW, 2019 - 2022 (Volume & Revenue)
- TABLE 84 Europe market from 250 kW - 500 kW, 2023 - 2028 (Volume & Revenue)
- TABLE 85 Europe market from 250 kW - 500 kW, 2029 - 2032 (Volume & Revenue)
- TABLE 86 Europe market from 250 kW - 500 kW, by country, 2019 - 2022 (Units)
- TABLE 87 Europe market from 250 kW - 500 kW, by country, 2023 - 2028 (Units)
- TABLE 88 Europe market from 250 kW - 500 kW, by country, 2029 - 2032 (Units)
- TABLE 89 Europe market from 250 kW - 500 kW, by country, 2019 - 2022 (USD Million)
- TABLE 90 Europe market from 250 kW - 500 kW, by country, 2023 - 2028 (USD Million)
- TABLE 91 Europe market from 250 kW - 500 kW, by country, 2029 - 2032 (USD Million)
- TABLE 92 Europe market from 500 kW - 1 MW, 2019 - 2022 (Volume & Revenue)
- TABLE 93 Europe market from 500 kW - 1 MW, 2023 - 2028 (Volume & Revenue)
- TABLE 94 Europe market from 500 kW - 1 MW, 2029 - 2032 (Volume & Revenue)
- TABLE 95 Europe market from 500 kW - 1 MW, by country, 2019 - 2022 (Units)
- TABLE 96 Europe market from 500 kW - 1 MW, by country, 2023 - 2028 (Units)
- TABLE 97 Europe market from 500 kW - 1 MW, by country, 2029 - 2032 (Units)
- TABLE 98 Europe market from 500 kW - 1 MW, by country, 2019 - 2022 (USD Million)
- TABLE 99 Europe market from 500 kW - 1 MW, by country, 2023 - 2028 (USD Million)
- TABLE 100 Europe market from 500 kW - 1 MW, by country, 2029 - 2032 (USD Million)
- TABLE 101 Europe market from 1 MW - 2 MW, 2019 - 2022 (Volume & Revenue)
- TABLE 102 Europe market from 1 MW - 2 MW, 2023 - 2028 (Volume & Revenue)
- TABLE 103 Europe market from 1 MW - 2 MW, 2029 - 2032 (Volume & Revenue)
- TABLE 104 Europe market from 1 MW - 2 MW, by country, 2019 - 2022 (Units)
- TABLE 105 Europe market from 1 MW - 2 MW, by country, 2023 - 2028 (Units)
- TABLE 106 Europe market from 1 MW - 2 MW, by country, 2029 - 2032 (Units)
- TABLE 107 Europe market from 1 MW - 2 MW, by country, 2019 - 2022 (USD Million)
- TABLE 108 Europe market from 1 MW - 2 MW, by country, 2023 - 2028 (USD Million)
- TABLE 109 Europe market from 1 MW - 2 MW, by country, 2029 - 2032 (USD Million)
- TABLE 110 Europe market from 2 MW - 5 MW, 2019 - 2022 (Volume & Revenue)
- TABLE 111 Europe market from 2 MW - 5 MW, 2023 - 2028 (Volume & Revenue)
- TABLE 112 Europe market from 2 MW - 5 MW, 2029 - 2032 (Volume & Revenue)
- TABLE 113 Europe market from 2 MW - 5 MW, by country, 2019 - 2022 (Units)
- TABLE 114 Europe market from 2 MW - 5 MW, by country, 2023 - 2028 (Units)
- TABLE 115 Europe market from 2 MW - 5 MW, by country, 2029 - 2032 (Units)
- TABLE 116 Europe market from 2 MW - 5 MW, by country, 2019 - 2022 (USD Million)
- TABLE 117 Europe market from 2 MW - 5 MW, by country, 2023 - 2028 (USD Million)
- TABLE 118 Europe market from 2 MW - 5 MW, by country, 2029 - 2032 (USD Million)
- TABLE 119 Europe market from > 5MW, 2019 - 2022 (Volume & Revenue)
- TABLE 120 Europe market from > 5MW, 2023 - 2028 (Volume & Revenue)
- TABLE 121 Europe market from > 5MW, 2029 - 2032 (Volume & Revenue)
- TABLE 122 Europe market from > 5MW, by country, 2019 - 2022 (Units)
- TABLE 123 Europe market from > 5MW, by country, 2023 - 2028 (Units)
- TABLE 124 Europe market from > 5MW, by country, 2029 - 2032 (Units)
- TABLE 125 Europe market from > 5MW, by country, 2019 - 2022 (USD Million)
- TABLE 126 Europe market from > 5MW, by country, 2023 - 2028 (USD Million)
- TABLE 127 Europe market from > 5MW, by country, 2029 - 2032 (USD Million)
- TABLE 128 Europe market from 80°C - 100°C, 2019 - 2022 (Volume & Revenue)
- TABLE 129 Europe market from 80°C - 100°C, 2023 - 2028 (Volume & Revenue)
- TABLE 130 Europe market from 80°C - 100°C, 2029 - 2032 (Volume & Revenue)
- TABLE 131 Europe market from 80°C - 100°C, by country, 2019 - 2022 (Units)
- TABLE 132 Europe market from 80°C - 100°C, by country, 2023 - 2028 (Units)
- TABLE 133 Europe market from 80°C - 100°C, by country, 2029 - 2032 (Units)
- TABLE 134 Europe market from 80°C - 100°C, by country, 2019 - 2022 (USD Million)
- TABLE 135 Europe market from 80°C - 100°C, by country, 2023 - 2028 (USD Million)
- TABLE 136 Europe market from 80°C - 100°C, by country, 2029 - 2032 (USD Million)
- TABLE 137 Europe market from 100°C - 150°C, 2019 - 2022 (Volume & Revenue)
- TABLE 138 Europe market from 100°C - 150°C, 2023 - 2028 (Volume & Revenue)
- TABLE 139 Europe market from 100°C - 150°C, 2029 - 2032 (Volume & Revenue)
- TABLE 140 Europe market from 100°C - 150°C, by country, 2019 - 2022 (Units)
- TABLE 141 Europe market from 100°C - 150°C, by country, 2023 - 2028 (Units)
- TABLE 142 Europe market from 100°C - 150°C, by country, 2029 - 2032 (Units)
- TABLE 143 Europe market from 100°C - 150°C, by country, 2019 - 2022 (USD Million)
- TABLE 144 Europe market from 100°C - 150°C, by country, 2023 - 2028 (USD Million)
- TABLE 145 Europe market from 100°C - 150°C, by country, 2029 - 2032 (USD Million)
- TABLE 146 Europe market from 150°C - 200°C, 2019 - 2022 (Volume & Revenue)
- TABLE 147 Europe market from 150°C - 200°C, 2023 - 2028 (Volume & Revenue)
- TABLE 148 Europe market from 150°C - 200°C, 2029 - 2032 (Volume & Revenue)
- TABLE 149 Europe market from 150°C - 200°C, by country, 2019 - 2022 (Units)
- TABLE 150 Europe market from 150°C - 200°C, by country, 2023 - 2028 (Units)
- TABLE 151 Europe market from 150°C - 200°C, by country, 2029 - 2032 (Units)
- TABLE 152 Europe market from 150°C - 200°C, by country, 2019 - 2022 (USD Million)
- TABLE 153 Europe market from 150°C - 200°C, by country, 2023 - 2028 (USD Million)
- TABLE 154 Europe market from 150°C - 200°C, by country, 2029 - 2032 (USD Million)
- TABLE 155 Europe market from > 200°C, 2019 - 2022 (Volume & Revenue)
- TABLE 156 Europe market from > 200°C, 2023 - 2028 (Volume & Revenue)
- TABLE 157 Europe market from > 200°C, 2029 - 2032 (Volume & Revenue)
- TABLE 158 Europe market from > 200°C, by country, 2019 - 2022 (Units)
- TABLE 159 Europe market from > 200°C, by country, 2023 - 2028 (Units)
- TABLE 160 Europe market from > 200°C, by country, 2029 - 2032 (Units)
- TABLE 161 Europe market from > 200°C, by country, 2019 - 2022 (USD Million)
- TABLE 162 Europe market from > 200°C, by country, 2023 - 2028 (USD Million)
- TABLE 163 Europe market from > 200°C, by country, 2029 - 2032 (USD Million)
- TABLE 164 Europe market from industrial, 2019 - 2022 (Volume & Revenue)
- TABLE 165 Europe market from industrial, 2023 - 2028 (Volume & Revenue)
- TABLE 166 Europe market from industrial, 2029 - 2032 (Volume & Revenue)
- TABLE 167 Europe market from industrial, by country, 2019 - 2022 (Units)
- TABLE 168 Europe market from industrial, by country, 2023 - 2028 (Units)
- TABLE 169 Europe market from industrial, by country, 2029 - 2032 (Units)
- TABLE 170 Europe market from industrial, by country, 2019 - 2022 (USD Million)
- TABLE 171 Europe market from industrial, by country, 2023 - 2028 (USD Million)
- TABLE 172 Europe market from industrial, by country, 2029 - 2032 (USD Million)
- TABLE 173 Europe market from paper, 2019 - 2022 (Volume & Revenue)
- TABLE 174 Europe market from paper, 2023 - 2028 (Volume & Revenue)
- TABLE 175 Europe market from paper, 2029 - 2032 (Volume & Revenue)
- TABLE 176 Europe market from paper, by country, 2019 - 2022 (Units)
- TABLE 177 Europe market from paper, by country, 2023 - 2028 (Units)
- TABLE 178 Europe market from paper, by country, 2029 - 2032 (Units)
- TABLE 179 Europe market from paper, by country, 2019 - 2022 (USD Million)
- TABLE 180 Europe market from paper, by country, 2023 - 2028 (USD Million)
- TABLE 181 Europe market from paper, by country, 2029 - 2032 (USD Million)
- TABLE 182 Europe market from food & beverages, 2019 - 2022 (Volume & Revenue)
- TABLE 183 Europe market from food & beverages, 2023 - 2028 (Volume & Revenue)
- TABLE 184 Europe market from food & beverages, 2029 - 2032 (Volume & Revenue)
- TABLE 185 Europe market from food & beverages, by country, 2019 - 2022 (Units)
- TABLE 186 Europe market from food & beverages, by country, 2023 - 2028 (Units)
- TABLE 187 Europe market from food & beverages, by country, 2029 - 2032 (Units)
- TABLE 188 Europe market from food & beverages, by country, 2019 - 2022 (USD Million)
- TABLE 189 Europe market from food & beverages, by country, 2023 - 2028 (USD Million)
- TABLE 190 Europe market from food & beverages, by country, 2029 - 2032 (USD Million)
- TABLE 191 Europe market from chemical, 2019 - 2022 (Volume & Revenue)
- TABLE 192 Europe market from chemical, 2023 - 2028 (Volume & Revenue)
- TABLE 193 Europe market from chemical, 2029 - 2032 (Volume & Revenue)
- TABLE 194 Europe market from chemical, by country, 2019 - 2022 (Units)
- TABLE 195 Europe market from chemical, by country, 2023 - 2028 (Units)
- TABLE 196 Europe market from chemical, by country, 2029 - 2032 (Units)
- TABLE 197 Europe market from chemical, by country, 2019 - 2022 (USD Million)
- TABLE 198 Europe market from chemical, by country, 2023 - 2028 (USD Million)
- TABLE 199 Europe market from chemical, by country, 2029 - 2032 (USD Million)
- TABLE 200 Europe market from iron & steel, 2019 - 2022 (Volume & Revenue)
- TABLE 201 Europe market from iron & steel, 2023 - 2028 (Volume & Revenue)
- TABLE 202 Europe market from iron & steel, 2029 - 2032 (Volume & Revenue)
- TABLE 203 Europe market from iron & steel, by country, 2019 - 2022 (Units)
- TABLE 204 Europe market from iron & steel, by country, 2023 - 2028 (Units)
- TABLE 205 Europe market from iron & steel, by country, 2029 - 2032 (Units)
- TABLE 206 Europe market from iron & steel, by country, 2019 - 2022 (USD Million)
- TABLE 207 Europe market from iron & steel, by country, 2023 - 2028 (USD Million)
- TABLE 208 Europe market from iron & steel, by country, 2029 - 2032 (USD Million)
- TABLE 209 Europe market from machinery, 2019 - 2022 (Volume & Revenue)
- TABLE 210 Europe market from machinery, 2023 - 2028 (Volume & Revenue)
- TABLE 211 Europe market from machinery, 2029 - 2032 (Volume & Revenue)
- TABLE 212 Europe market from machinery, by country, 2019 - 2022 (Units)
- TABLE 213 Europe market from machinery, by country, 2023 - 2028 (Units)
- TABLE 214 Europe market from machinery, by country, 2029 - 2032 (Units)
- TABLE 215 Europe market from machinery, by country, 2019 - 2022 (USD Million)
- TABLE 216 Europe market from machinery, by country, 2023 - 2028 (USD Million)
- TABLE 217 Europe market from machinery, by country, 2029 - 2032 (USD Million)
- TABLE 218 Europe market from non-metallic minerals, 2019 - 2022 (Volume & Revenue)
- TABLE 219 Europe market from non-metallic minerals, 2023 - 2028 (Volume & Revenue)
- TABLE 220 Europe market from non-metallic minerals, 2029 - 2032 (Volume & Revenue)
- TABLE 221 Europe market from non-metallic minerals, by country, 2019 - 2022 (Units)
- TABLE 222 Europe market from non-metallic minerals, by country, 2023 - 2028 (Units)
- TABLE 223 Europe market from non-metallic minerals, by country, 2029 - 2032 (Units)
- TABLE 224 Europe market from non-metallic minerals, by country, 2019 - 2022 (USD Million)
- TABLE 225 Europe market from non-metallic minerals, by country, 2023 - 2028 (USD Million)
- TABLE 226 Europe market from non-metallic minerals, by country, 2029 - 2032 (USD Million)
- TABLE 227 Europe market from others, 2019 - 2022 (Volume & Revenue)
- TABLE 228 Europe market from others, 2023 - 2028 (Volume & Revenue)
- TABLE 229 Europe market from others, 2029 - 2032 (Volume & Revenue)
- TABLE 230 Europe market from others, by country, 2019 - 2022 (Units)
- TABLE 231 Europe market from others, by country, 2023 - 2028 (Units)
- TABLE 232 Europe market from others, by country, 2029 - 2032 (Units)
- TABLE 233 Europe market from others, by country, 2019 - 2022 (USD Million)
- TABLE 234 Europe market from others, by country, 2023 - 2028 (USD Million)
- TABLE 235 Europe market from others, by country, 2029 - 2032 (USD Million)
- TABLE 236 Europe market from district heating, 2019 - 2022 (Volume & Revenue)
- TABLE 237 Europe market from district heating, 2023 - 2028 (Volume & Revenue)
- TABLE 238 Europe market from district heating, 2029 - 2032 (Volume & Revenue)
- TABLE 239 Europe market from district heating, by country, 2019 - 2022 (Units)
- TABLE 240 Europe market from district heating, by country, 2023 - 2028 (Units)
- TABLE 241 Europe market from district heating, by country, 2029 - 2032 (Units)
- TABLE 242 Europe market from district heating, by country, 2019 - 2022 (USD Million)
- TABLE 243 Europe market from district heating, by country, 2023 - 2028 (USD Million)
- TABLE 244 Europe market from district heating, by country, 2029 - 2032 (USD Million)
- TABLE 245 UK market, 2019 - 2022 (Volume & Revenue)
- TABLE 246 UK market, 2023 - 2028 (Volume & Revenue)
- TABLE 247 UK market, 2029 - 2032 (Volume & Revenue)
- TABLE 248 UK market by product, 2019 - 2022 (Units)
- TABLE 249 UK market by product, 2023 - 2028 (Units)
- TABLE 250 UK market by product, 2029 - 2032 (Units)
- TABLE 251 UK market by product, 2019 - 2022 (USD Million)
- TABLE 252 UK market by product, 2023 - 2028 (USD Million)
- TABLE 253 UK market by product, 2029 - 2032 (USD Million)
- TABLE 254 UK market by capacity, 2019 - 2022 (Units)
- TABLE 255 UK market by capacity, 2023 - 2028 (Units)
- TABLE 256 UK market by capacity, 2029 - 2032 (Units)
- TABLE 257 UK market by capacity, 2019 - 2022 (USD Million)
- TABLE 258 UK market by capacity, 2023 - 2028 (USD Million)
- TABLE 259 UK market by capacity, 2029 - 2032 (USD Million)
- TABLE 260 UK market by temperature, 2019 - 2022 (Units)
- TABLE 261 UK market by temperature, 2023 - 2028 (Units)
- TABLE 262 UK market by temperature, 2029 - 2032 (Units)
- TABLE 263 UK market by temperature, 2019 - 2022 (USD Million)
- TABLE 264 UK market by temperature, 2023 - 2028 (USD Million)
- TABLE 265 UK market by temperature, 2029 - 2032 (USD Million)
- TABLE 266 UK market by application, 2019 - 2022 (Units)
- TABLE 267 UK market by application, 2023 - 2028 (Units)
- TABLE 268 UK market by application, 2029 - 2032 (Units)
- TABLE 269 UK market by application, 2019 - 2022 (USD Million)
- TABLE 270 UK market by application, 2023 - 2028 (USD Million)
- TABLE 271 UK market by application, 2029 - 2032 (USD Million)
- TABLE 272 UK market by industrial, 2019 - 2022 (Units)
- TABLE 273 UK market by industrial, 2023 - 2028 (Units)
- TABLE 274 UK market by industrial, 2029 - 2032 (Units)
- TABLE 275 UK market by industrial, 2019 - 2022 (USD Million)
- TABLE 276 UK market by industrial, 2023 - 2028 (USD Million)
- TABLE 277 UK market by industrial, 2029 - 2032 (USD Million)
- TABLE 278 Norway market, 2019 - 2022 (Volume & Revenue)
- TABLE 279 Norway market, 2023 - 2028 (Volume & Revenue)
- TABLE 280 Norway market, 2029 - 2032 (Volume & Revenue)
- TABLE 281 Norway market by product, 2019 - 2022 (Units)
- TABLE 282 Norway market by product, 2023 - 2028 (Units)
- TABLE 283 Norway market by product, 2029 - 2032 (Units)
- TABLE 284 Norway market by product, 2019 - 2022 (USD Million)
- TABLE 285 Norway market by product, 2023 - 2028 (USD Million)
- TABLE 286 Norway market by product, 2029 - 2032 (USD Million)
- TABLE 287 Norway market by capacity, 2019 - 2022 (Units)
- TABLE 288 Norway market by capacity, 2023 - 2028 (Units)
- TABLE 289 Norway market by capacity, 2029 - 2032 (Units)
- TABLE 290 Norway market by capacity, 2019 - 2022 (USD Million)
- TABLE 291 Norway market by capacity, 2023 - 2028 (USD Million)
- TABLE 292 Norway market by capacity, 2029 - 2032 (USD Million)
- TABLE 293 Norway market by temperature, 2019 - 2022 (Units)
- TABLE 294 Norway market by temperature, 2023 - 2028 (Units)
- TABLE 295 Norway market by temperature, 2029 - 2032 (Units)
- TABLE 296 Norway market by temperature, 2019 - 2022 (USD Million)
- TABLE 297 Norway market by temperature, 2023 - 2028 (USD Million)
- TABLE 298 Norway market by temperature, 2029 - 2032 (USD Million)
- TABLE 299 Norway market by application, 2019 - 2022 (Units)
- TABLE 300 Norway market by application, 2023 - 2028 (Units)
- TABLE 301 Norway market by application, 2029 - 2032 (Units)
- TABLE 302 Norway market by application, 2019 - 2022 (USD Million)
- TABLE 303 Norway market by application, 2023 - 2028 (USD Million)
- TABLE 304 Norway market by application, 2029 - 2032 (USD Million)
- TABLE 305 Norway market by industrial, 2019 - 2022 (Units)
- TABLE 306 Norway market by industrial, 2023 - 2028 (Units)
- TABLE 307 Norway market by industrial, 2029 - 2032 (Units)
- TABLE 308 Norway market by industrial, 2019 - 2022 (USD Million)
- TABLE 309 Norway market by industrial, 2023 - 2028 (USD Million)
- TABLE 310 Norway market by industrial, 2029 - 2032 (USD Million)
- TABLE 311 Denmark market, 2019 - 2022 (Volume & Revenue)
- TABLE 312 Denmark market, 2023 - 2028 (Volume & Revenue)
- TABLE 313 Denmark market, 2029 - 2032 (Volume & Revenue)
- TABLE 314 Denmark market by product, 2019 - 2022 (Units)
- TABLE 315 Denmark market by product, 2023 - 2028 (Units)
- TABLE 316 Denmark market by product, 2029 - 2032 (Units)
- TABLE 317 Denmark market by product, 2019 - 2022 (USD Million)
- TABLE 318 Denmark market by product, 2023 - 2028 (USD Million)
- TABLE 319 Denmark market by product, 2029 - 2032 (USD Million)
- TABLE 320 Denmark market by capacity, 2019 - 2022 (Units)
- TABLE 321 Denmark market by capacity, 2023 - 2028 (Units)
- TABLE 322 Denmark market by capacity, 2029 - 2032 (Units)
- TABLE 323 Denmark market by capacity, 2019 - 2022 (USD Million)
- TABLE 324 Denmark market by capacity, 2023 - 2028 (USD Million)
- TABLE 325 Denmark market by capacity, 2029 - 2032 (USD Million)
- TABLE 326 Denmark market by temperature, 2019 - 2022 (Units)
- TABLE 327 Denmark market by temperature, 2023 - 2028 (Units)
- TABLE 328 Denmark market by temperature, 2029 - 2032 (Units)
- TABLE 329 Denmark market by temperature, 2019 - 2022 (USD Million)
- TABLE 330 Denmark market by temperature, 2023 - 2028 (USD Million)
- TABLE 331 Denmark market by temperature, 2029 - 2032 (USD Million)
- TABLE 332 Denmark market by application, 2019 - 2022 (Units)
- TABLE 333 Denmark market by application, 2023 - 2028 (Units)
- TABLE 334 Denmark market by application, 2029 - 2032 (Units)
- TABLE 335 Denmark market by application, 2019 - 2022 (USD Million)
- TABLE 336 Denmark market by application, 2023 - 2028 (USD Million)
- TABLE 337 Denmark market by application, 2029 - 2032 (USD Million)
- TABLE 338 Denmark market by industrial, 2019 - 2022 (Units)
- TABLE 339 Denmark market by industrial, 2023 - 2028 (Units)
- TABLE 340 Denmark market by industrial, 2029 - 2032 (Units)
- TABLE 341 Denmark market by industrial, 2019 - 2022 (USD Million)
- TABLE 342 Denmark market by industrial, 2023 - 2028 (USD Million)
- TABLE 343 Denmark market by industrial, 2029 - 2032 (USD Million)
- TABLE 344 Finland market, 2019 - 2022 (Volume & Revenue)
- TABLE 345 Finland market, 2023 - 2028 (Volume & Revenue)
- TABLE 346 Finland market, 2029 - 2032 (Volume & Revenue)
- TABLE 347 Finland market by product, 2019 - 2022 (Units)
- TABLE 348 Finland market by product, 2023 - 2028 (Units)
- TABLE 349 Finland market by product, 2029 - 2032 (Units)
- TABLE 350 Finland market by product, 2019 - 2022 (USD Million)
- TABLE 351 Finland market by product, 2023 - 2028 (USD Million)
- TABLE 352 Finland market by product, 2029 - 2032 (USD Million)
- TABLE 353 Finland market by capacity, 2019 - 2022 (Units)
- TABLE 354 Finland market by capacity, 2023 - 2028 (Units)
- TABLE 355 Finland market by capacity, 2029 - 2032 (Units)
- TABLE 356 Finland market by capacity, 2019 - 2022 (USD Million)
- TABLE 357 Finland market by capacity, 2023 - 2028 (USD Million)
- TABLE 358 Finland market by capacity, 2029 - 2032 (USD Million)
- TABLE 359 Finland market by temperature, 2019 - 2022 (Units)
- TABLE 360 Finland market by temperature, 2023 - 2028 (Units)
- TABLE 361 Finland market by temperature, 2029 - 2032 (Units)
- TABLE 362 Finland market by temperature, 2019 - 2022 (USD Million)
- TABLE 363 Finland market by temperature, 2023 - 2028 (USD Million)
- TABLE 364 Finland market by temperature, 2029 - 2032 (USD Million)
- TABLE 365 Finland market by application, 2019 - 2022 (Units)
- TABLE 366 Finland market by application, 2023 - 2028 (Units)
- TABLE 367 Finland market by application, 2029 - 2032 (Units)
- TABLE 368 Finland market by application, 2019 - 2022 (USD Million)
- TABLE 369 Finland market by application, 2023 - 2028 (USD Million)
- TABLE 370 Finland market by application, 2029 - 2032 (USD Million)
- TABLE 371 Finland market by industrial, 2019 - 2022 (Units)
- TABLE 372 Finland market by industrial, 2023 - 2028 (Units)
- TABLE 373 Finland market by industrial, 2029 - 2032 (Units)
- TABLE 374 Finland market by industrial, 2019 - 2022 (USD Million)
- TABLE 375 Finland market by industrial, 2023 - 2028 (USD Million)
- TABLE 376 Finland market by industrial, 2029 - 2032 (USD Million)
- TABLE 377 Sweden market, 2019 - 2022 (Volume & Revenue)
- TABLE 378 Sweden market, 2023 - 2028 (Volume & Revenue)
- TABLE 379 Sweden market, 2029 - 2032 (Volume & Revenue)
- TABLE 380 Sweden market by product, 2019 - 2022 (Units)
- TABLE 381 Sweden market by product, 2023 - 2028 (Units)
- TABLE 382 Sweden market by product, 2029 - 2032 (Units)
- TABLE 383 Sweden market by product, 2019 - 2022 (USD Million)
- TABLE 384 Sweden market by product, 2023 - 2028 (USD Million)
- TABLE 385 Sweden market by product, 2029 - 2032 (USD Million)
- TABLE 386 Sweden market by capacity, 2019 - 2022 (Units)
- TABLE 387 Sweden market by capacity, 2023 - 2028 (Units)
- TABLE 388 Sweden market by capacity, 2029 - 2032 (Units)
- TABLE 389 Sweden market by capacity, 2019 - 2022 (USD Million)
- TABLE 390 Sweden market by capacity, 2023 - 2028 (USD Million)
- TABLE 391 Sweden market by capacity, 2029 - 2032 (USD Million)
- TABLE 392 Sweden market by temperature, 2019 - 2022 (Units)
- TABLE 393 Sweden market by temperature, 2023 - 2028 (Units)
- TABLE 394 Sweden market by temperature, 2029 - 2032 (Units)
- TABLE 395 Sweden market by temperature, 2019 - 2022 (USD Million)
- TABLE 396 Sweden market by temperature, 2023 - 2028 (USD Million)
- TABLE 397 Sweden market by temperature, 2029 - 2032 (USD Million)
- TABLE 398 Sweden market by application, 2019 - 2022 (Units)
- TABLE 399 Sweden market by application, 2023 - 2028 (Units)
- TABLE 400 Sweden market by application, 2029 - 2032 (Units)
- TABLE 401 Sweden market by application, 2019 - 2022 (USD Million)
- TABLE 402 Sweden market by application, 2023 - 2028 (USD Million)
- TABLE 403 Sweden market by application, 2029 - 2032 (USD Million)
- TABLE 404 Sweden market by industrial, 2019 - 2022 (Units)
- TABLE 405 Sweden market by industrial, 2023 - 2028 (Units)
- TABLE 406 Sweden market by industrial, 2029 - 2032 (Units)
- TABLE 407 Sweden market by industrial, 2019 - 2022 (USD Million)
- TABLE 408 Sweden market by industrial, 2023 - 2028 (USD Million)
- TABLE 409 Sweden market by industrial, 2029 - 2032 (USD Million)
- TABLE 410 Germany market, 2019 - 2022 (Volume & Revenue)
- TABLE 411 Germany market, 2023 - 2028 (Volume & Revenue)
- TABLE 412 Germany market, 2029 - 2032 (Volume & Revenue)
- TABLE 413 Germany market by product, 2019 - 2022 (Units)
- TABLE 414 Germany market by product, 2023 - 2028 (Units)
- TABLE 415 Germany market by product, 2029 - 2032 (Units)
- TABLE 416 Germany market by product, 2019 - 2022 (USD Million)
- TABLE 417 Germany market by product, 2023 - 2028 (USD Million)
- TABLE 418 Germany market by product, 2029 - 2032 (USD Million)
- TABLE 419 Germany market by capacity, 2019 - 2022 (Units)
- TABLE 420 Germany market by capacity, 2023 - 2028 (Units)
- TABLE 421 Germany market by capacity, 2029 - 2032 (Units)
- TABLE 422 Germany market by capacity, 2019 - 2022 (USD Million)
- TABLE 423 Germany market by capacity, 2023 - 2028 (USD Million)
- TABLE 424 Germany market by capacity, 2029 - 2032 (USD Million)
- TABLE 425 Germany market by temperature, 2019 - 2022 (Units)
- TABLE 426 Germany market by temperature, 2023 - 2028 (Units)
- TABLE 427 Germany market by temperature, 2029 - 2032 (Units)
- TABLE 428 Germany market by temperature, 2019 - 2022 (USD Million)
- TABLE 429 Germany market by temperature, 2023 - 2028 (USD Million)
- TABLE 430 Germany market by temperature, 2029 - 2032 (USD Million)
- TABLE 431 Germany market by application, 2019 - 2022 (Units)
- TABLE 432 Germany market by application, 2023 - 2028 (Units)
- TABLE 433 Germany market by application, 2029 - 2032 (Units)
- TABLE 434 Germany market by application, 2019 - 2022 (USD Million)
- TABLE 435 Germany market by application, 2023 - 2028 (USD Million)
- TABLE 436 Germany market by application, 2029 - 2032 (USD Million)
- TABLE 437 Germany market by industrial, 2019 - 2022 (Units)
- TABLE 438 Germany market by industrial, 2023 - 2028 (Units)
- TABLE 439 Germany market by industrial, 2029 - 2032 (Units)
- TABLE 440 Germany market by industrial, 2019 - 2022 (USD Million)
- TABLE 441 Germany market by industrial, 2023 - 2028 (USD Million)
- TABLE 442 Germany market by industrial, 2029 - 2032 (USD Million)
- TABLE 443 Poland market, 2019 - 2022 (Volume & Revenue)
- TABLE 444 Poland market, 2023 - 2028 (Volume & Revenue)
- TABLE 445 Poland market, 2029 - 2032 (Volume & Revenue)
- TABLE 446 Poland market by product, 2019 - 2022 (Units)
- TABLE 447 Poland market by product, 2023 - 2028 (Units)
- TABLE 448 Poland market by product, 2029 - 2032 (Units)
- TABLE 449 Poland market by product, 2019 - 2022 (USD Million)
- TABLE 450 Poland market by product, 2023 - 2028 (USD Million)
- TABLE 451 Poland market by product, 2029 - 2032 (USD Million)
- TABLE 452 Poland market by capacity, 2019 - 2022 (Units)
- TABLE 453 Poland market by capacity, 2023 - 2028 (Units)
- TABLE 454 Poland market by capacity, 2029 - 2032 (Units)
- TABLE 455 Poland market by capacity, 2019 - 2022 (USD Million)
- TABLE 456 Poland market by capacity, 2023 - 2028 (USD Million)
- TABLE 457 Poland market by capacity, 2029 - 2032 (USD Million)
- TABLE 458 Poland market by temperature, 2019 - 2022 (Units)
- TABLE 459 Poland market by temperature, 2023 - 2028 (Units)
- TABLE 460 Poland market by temperature, 2029 - 2032 (Units)
- TABLE 461 Poland market by temperature, 2019 - 2022 (USD Million)
- TABLE 462 Poland market by temperature, 2023 - 2028 (USD Million)
- TABLE 463 Poland market by temperature, 2029 - 2032 (USD Million)
- TABLE 464 Poland market by application, 2019 - 2022 (Units)
- TABLE 465 Poland market by application, 2023 - 2028 (Units)
- TABLE 466 Poland market by application, 2029 - 2032 (Units)
- TABLE 467 Poland market by application, 2019 - 2022 (USD Million)
- TABLE 468 Poland market by application, 2023 - 2028 (USD Million)
- TABLE 469 Poland market by application, 2029 - 2032 (USD Million)
- TABLE 470 Poland market by industrial, 2019 - 2022 (Units)
- TABLE 471 Poland market by industrial, 2023 - 2028 (Units)
- TABLE 472 Poland market by industrial, 2029 - 2032 (Units)
- TABLE 473 Poland market by industrial, 2019 - 2022 (USD Million)
- TABLE 474 Poland market by industrial, 2023 - 2028 (USD Million)
- TABLE 475 Poland market by industrial, 2029 - 2032 (USD Million)
- TABLE 476 Spain market, 2019 - 2022 (Volume & Revenue)
- TABLE 477 Spain market, 2023 - 2028 (Volume & Revenue)
- TABLE 478 Spain market, 2029 - 2032 (Volume & Revenue)
- TABLE 479 Spain market by product, 2019 - 2022 (Units)
- TABLE 480 Spain market by product, 2023 - 2028 (Units)
- TABLE 481 Spain market by product, 2029 - 2032 (Units)
- TABLE 482 Spain market by product, 2019 - 2022 (USD Million)
- TABLE 483 Spain market by product, 2023 - 2028 (USD Million)
- TABLE 484 Spain market by product, 2029 - 2032 (USD Million)
- TABLE 485 Spain market by capacity, 2019 - 2022 (Units)
- TABLE 486 Spain market by capacity, 2023 - 2028 (Units)
- TABLE 487 Spain market by capacity, 2029 - 2032 (Units)
- TABLE 488 Spain market by capacity, 2019 - 2022 (USD Million)
- TABLE 489 Spain market by capacity, 2023 - 2028 (USD Million)
- TABLE 490 Spain market by capacity, 2029 - 2032 (USD Million)
- TABLE 491 Spain market by temperature, 2019 - 2022 (Units)
- TABLE 492 Spain market by temperature, 2023 - 2028 (Units)
- TABLE 493 Spain market by temperature, 2029 - 2032 (Units)
- TABLE 494 Spain market by temperature, 2019 - 2022 (USD Million)
- TABLE 495 Spain market by temperature, 2023 - 2028 (USD Million)
- TABLE 496 Spain market by temperature, 2029 - 2032 (USD Million)
- TABLE 497 Spain market by application, 2019 - 2022 (Units)
- TABLE 498 Spain market by application, 2023 - 2028 (Units)
- TABLE 499 Spain market by application, 2029 - 2032 (Units)
- TABLE 500 Spain market by application, 2019 - 2022 (USD Million)
- TABLE 501 Spain market by application, 2023 - 2028 (USD Million)
- TABLE 502 Spain market by application, 2029 - 2032 (USD Million)
- TABLE 503 Spain market by industrial, 2019 - 2022 (Units)
- TABLE 504 Spain market by industrial, 2023 - 2028 (Units)
- TABLE 505 Spain market by industrial, 2029 - 2032 (Units)
- TABLE 506 Spain market by industrial, 2019 - 2022 (USD Million)
- TABLE 507 Spain market by industrial, 2023 - 2028 (USD Million)
- TABLE 508 Spain market by industrial, 2029 - 2032 (USD Million)
- TABLE 509 Austria market, 2019 - 2022 (Volume & Revenue)
- TABLE 510 Austria market, 2023 - 2028 (Volume & Revenue)
- TABLE 511 Austria market, 2029 - 2032 (Volume & Revenue)
- TABLE 512 Austria market by product, 2019 - 2022 (Units)
- TABLE 513 Austria market by product, 2023 - 2028 (Units)
- TABLE 514 Austria market by product, 2029 - 2032 (Units)
- TABLE 515 Austria market by product, 2019 - 2022 (USD Million)
- TABLE 516 Austria market by product, 2023 - 2028 (USD Million)
- TABLE 517 Austria market by product, 2029 - 2032 (USD Million)
- TABLE 518 Austria market by capacity, 2019 - 2022 (Units)
- TABLE 519 Austria market by capacity, 2023 - 2028 (Units)
- TABLE 520 Austria market by capacity, 2029 - 2032 (Units)
- TABLE 521 Austria market by capacity, 2019 - 2022 (USD Million)
- TABLE 522 Austria market by capacity, 2023 - 2028 (USD Million)
- TABLE 523 Austria market by capacity, 2029 - 2032 (USD Million)
- TABLE 524 Austria market by temperature, 2019 - 2022 (Units)
- TABLE 525 Austria market by temperature, 2023 - 2028 (Units)
- TABLE 526 Austria market by temperature, 2029 - 2032 (Units)
- TABLE 527 Austria market by temperature, 2019 - 2022 (USD Million)
- TABLE 528 Austria market by temperature, 2023 - 2028 (USD Million)
- TABLE 529 Austria market by temperature, 2029 - 2032 (USD Million)
- TABLE 530 Austria market by application, 2019 - 2022 (Units)
- TABLE 531 Austria market by application, 2023 - 2028 (Units)
- TABLE 532 Austria market by application, 2029 - 2032 (Units)
- TABLE 533 Austria market by application, 2019 - 2022 (USD Million)
- TABLE 534 Austria market by application, 2023 - 2028 (USD Million)
- TABLE 535 Austria market by application, 2029 - 2032 (USD Million)
- TABLE 536 Austria market by industrial, 2019 - 2022 (Units)
- TABLE 537 Austria market by industrial, 2023 - 2028 (Units)
- TABLE 538 Austria market by industrial, 2029 - 2032 (Units)
- TABLE 539 Austria market by industrial, 2019 - 2022 (USD Million)
- TABLE 540 Austria market by industrial, 2023 - 2028 (USD Million)
- TABLE 541 Austria market by industrial, 2029 - 2032 (USD Million)
Charts & Figures
- FIG. 1 GMI report coverage: critical research elements
- FIG. 2 Industry segmentation
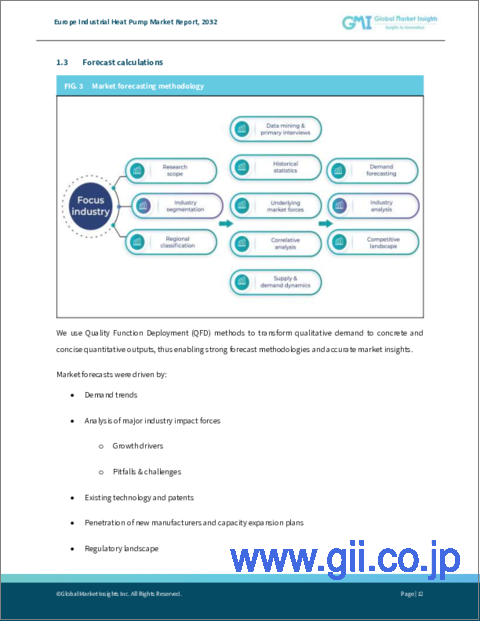
- FIG. 3 Market forecasting methodology
- FIG. 4 Profile break-up of primary respondents
- FIG. 5 Industry ecosystem analysis
- FIG. 6 Country-wise Heating Degree Days (HDD), 2022
- FIG. 7 Overall view on COVID- 19 effect, 2019 - 2032 (USD Million)
- FIG. 8 Growth potential analysis
- FIG. 9 Porter's Analysis
- FIG. 10 PESTEL Analysis
- FIG. 11 SWOT Analysis, Piller Blowers & Compressors GmbH
- FIG. 12 SWOT Analysis, MAN Energy Solutions
- FIG. 13 SWOT Analysis, GEA Group Aktiengesellschaft
- FIG. 14 SWOT Analysis, Atlas Copco AB
- FIG. 15 SWOT Analysis, Oilon Group Oy
- FIG. 16 SWOT Analysis, Siemens Energy
- FIG. 17 SWOT Analysis, HELIOTHERM Warmepumpentechnik Ges.m.b.H.
- FIG. 18 SWOT Analysis, Carrier
- FIG. 19 SWOT Analysis, Trane Technologies International Limited
- FIG. 20 SWOT Analysis, AGO GmbH Energie + Anlagen
- FIG. 21 SWOT Analysis, Thermax Limited
- FIG. 22 SWOT Analysis, Daikin Applied Europe S.p.A.
- FIG. 23 SWOT Analysis, Hybrid Energy AS
- FIG. 24 SWOT Analysis, OCHSNER
- FIG. 25 SWOT Analysis, Danfoss
- FIG. 26 SWOT Analysis, Mitsubishi Electric Corporation
Europe Industrial Heat Pump Market will experience appreciable momentum during 2023-2032 owing to the increasing deployment of heat pumps for minimizing the consumption of heating energy and delivering an energy-efficient alternative to traditional space heating systems.
Heat pumps are one of the well-known technologies widely used for heating and cooling applications. These mechanical devices transmit heat by removing low-grade heat from a source and upgrading it to deliver it at a high temperature. Their wide application in residential and industrial sectors will assist the market growth in the future.
Overall, the Europe industrial heat pump industry is segmented in terms of product, capacity, temperature, application, and country.
Based on the product, the air source heat pump segment will gain significant prominence by 2032. Low carbon footprint, low maintenance, and high seasonal coefficient of performance, among others, are some of the key factors driving the deployment of industrial air source heat pumps. In addition, benefits such as energy-savings and safe and environmentally friendly operations will lead to segment growth.
By capacity, the ≤ 50 kW segment will show lucrative growth during the estimated timeframe. Increasing concerns regarding reducing GHG emissions from the heating and industrial sector will surge the demand for clean and energy-efficient technologies, thus positively augmenting product adoption across the region.
Considering the temperature, the 150°C - 200°C segment will garner profitable returns across the overall market during the estimated timeframe. Constant expansion of high-temperature industrial processes in various industries such as food & beverage, iron and steel, chemical, and paper, among others, is anticipated to drive the demand for over 150 °C temperature-ranging heat pumps in the coming years.
By application, the paper segment is poised to see a positive trajectory through 2032. High energy-intensive processes, including drying, boiling, and bleaching, will contribute to segment growth. Besides, product advantages such as repurposing the water heater to generate heat from operations such as drying, would lead to reduced energy consumption and greenhouse gas emission, positively influencing product deployment across the industry.
In terms of country, the Denmark industrial heat pump market contributed to over USD 18 million revenue share in 2022. Strict regulations and norms to control emissions and prevailing environmental norms to alleviate carbon emissions will increase product deployment across the country.
Table of Contents
Chapter 1 Methodology & Scope
- 1.1 Market scope & definitions
- 1.2 Market estimates and forecast parameters
- 1.3 Forecast calculations
- 1.4 Data sources
- 1.4.1 Primary
- 1.4.2 Secondary
- 1.4.2.1 Paid sources
- 1.4.2.2 Public sources
Chapter 2 Europe Industrial Heat Pump Industry Insights
- 2.1 Industry ecosystem analysis
- 2.1.1 Vendor Matrix
- 2.2 Regulatory landscape
- 2.2.1 International Organization for Standardization
- 2.2.2 EU Directive 2010/75/EU, 2010
- 2.2.3 Energy efficiency directive (2012/27/EU, amended by 2018/2002/EU)
- 2.2.3.1 Heat Pumps and EU targets
- 2.2.3.2 Key Laws
- 2.2.3.3 Energy Efficiency Plan 2011
- 2.2.3.4 Horizon 2020 and Horizon Europe
- 2.2.3.5 LIFE: Clean Energy Transition
- 2.2.3.6 InvestEU
- 2.2.3.7 EU renewable energy financing mechanism
- 2.2.4 EU Green Deal
- 2.2.4.1 Germany
- 2.2.4.1.1 German Energy Saving Ordinance (EnEV)
- 2.2.4.1.2 Price subsidy for heat pumps
- 2.2.4.1.3 Existing support schemes for large heat pumps
- 2.2.4.1.4 Energy Concept - The Energy Strategy
- 2.2.4.2 UK
- 2.2.4.2.1 The Renewable Heat Incentive Scheme Regulations
- 2.2.4.2.2 The UK's National Energy Efficiency Action Plan
- 2.2.4.2.3 CRC Energy Efficiency Schemes
- 2.2.4.2.4 Heat Pump Ready Program
- 2.2.4.3 Finland
- 2.2.4.3.1 Existing support schemes for large heat pumps
- 2.2.4.3.2 Tax incentives to boost research & development efforts
- 2.2.4.3.3 Excise duty on electricity used by heat pumps, electric boilers and data centers will decrease.
- 2.2.4.4 Denmark
- 2.2.4.4.1 Incentive round for electric heat pump
- 2.2.4.5 Ireland
- 2.2.4.5.1 The Heat Pump Association of Ireland
- 2.2.4.1 Germany
- 2.3 Industry impact forces
- 2.3.1 Growth drivers
- 2.3.1.1 Positive outlook toward renewable sector
- 2.3.1.2 Surging demand for space heating
- 2.3.2 Industry pitfalls & challenges
- 2.3.2.1 High upfront cost
- 2.3.1 Growth drivers
- 2.4 COVID- 19 impact on the industry outlook
- 2.4.1 Overall view
- 2.5 Growth potential analysis
- 2.6 Porter's Analysis
- 2.6.1 Bargaining power of supplier
- 2.6.2 Bargaining power of buyer
- 2.6.3 Threat of new entrant
- 2.6.4 Threat of substitutes
- 2.7 PESTEL Analysis
Chapter 3 Competitive Benchmarking
- 3.1 Innovation & sustainability landscape
- 3.1.1 GEA Group Aktiengesellschaft
- 3.1.2 PILLER Blowers & Compressors GmbH
- 3.1.3 Carrier
- 3.1.4 Other innovations
- 3.2 Competitive landscape, 2022
- 3.2.1 Strategy dashboard
- 3.2.2 Strategy dashboard
- 3.2.2.1 Atlas Copco AB
- 3.2.2.1.1 Agreement
- 3.2.2.2 Siemens Energy
- 3.2.2.2.1 Supply
- 3.2.2.2.2 Agreement/Contract
- 3.2.2.3 Daikin
- 3.2.2.3.1 Facility expansion
- 3.2.2.3.2 Strategic management plan
- 3.2.2.4 Danfoss
- 3.2.2.4.1 New business segment
- 3.2.2.4.2 Product launch
- 3.2.2.4.3 Acquisition
- 3.2.2.5 MAN Energy Solutions
- 3.2.2.5.1 Partnership/Collaboration
- 3.2.2.5.2 Supply
- 3.2.2.6 GEA Group Aktiengesellschaft
- 3.2.2.6.1 Product launch
- 3.2.2.7 Piller Blowers & Compressors GmbH
- 3.2.2.7.1 Collaboration
- 3.2.2.8 AGO GmbH Energie + Anlagen
- 3.2.2.8.1 Installation/Supply
- 3.2.2.9 Carrier Corporation
- 3.2.2.9.1 Product launch
- 3.2.2.9.2 Technology development
- 3.2.2.10 Oilon Group Oy
- 3.2.2.10.1 Plant expansion
- 3.2.2.11 Other strategies
- 3.2.2.1 Atlas Copco AB
Chapter 4 Europe Industrial Heat Pump Market, By Product
- 4.1 Key product trends
- 4.2 Air source
- 4.2.1 Europe market from air source, 2019 - 2032
- 4.2.2 Europe market from air source, by country, 2019 - 2032
- 4.3 Ground source
- 4.3.1 Europe market from ground source, 2019 - 2032
- 4.3.2 Europe market from ground source, by country, 2019 - 2032
- 4.4 Water source
- 4.4.1 Europe market from water source, 2019 - 2032
- 4.4.2 Europe market from water source, by country, 2019 - 2032
- 4.5 Closed cycle mechanical heat pump
- 4.5.1 Europe market from closed cycle mechanical heat pump, 2019 - 2032
- 4.5.2 Europe market from closed cycle mechanical heat pump, by country, 2019 - 2032
- 4.6 Open cycle mechanical vapor compression heat pump
- 4.6.1 Europe market from open cycle mechanical vapor compression heat pump, 2019 - 2032
- 4.6.2 Europe market from open cycle mechanical vapor compression heat pump, by country, 2019 - 2032
- 4.7 Open cycle thermocompression heat pump
- 4.7.1 Europe market from open cycle thermocompression heat pump, 2019 - 2032
- 4.7.2 Europe market from open cycle thermocompression heat pump, by country, 2019 - 2032
- 4.8 Closed cycle absorption heat pump
- 4.8.1 Europe market from closed cycle absorption heat pump, 2019 - 2032
- 4.8.2 Europe market from closed cycle absorption heat pump, by country, 2019 - 2032
Chapter 5 Europe Industrial Heat Pump Market, By Capacity
- 5.1 Key capacity trends
- 5.2 ≤ 50 kW
- 5.2.1 Europe market from ≤ 50 kW, 2019 - 2032
- 5.2.2 Europe market from ≤ 50 kW, by country, 2019 - 2032
- 5.3 50 kW - 250 kW
- 5.3.1 Europe market from 50 kW - 250 kW, 2019 - 2032
- 5.3.2 Europe market from 50 kW - 250 kW, by country, 2019 - 2032
- 5.4 250 kW - 500 kW
- 5.4.1 Europe market from 250 kW - 500 kW, 2019 - 2032
- 5.4.2 Europe market from 250 kW - 500 kW, by country, 2019 - 2032
- 5.5 500 kW - 1 MW
- 5.5.1 Europe market from 500 kW - 1 MW, 2019 - 2032
- 5.5.2 Europe market from 500 kW - 1 MW, by country, 2019 - 2032
- 5.6 1 MW - 2 MW
- 5.6.1 Europe market from 1 MW - 2 MW, 2019 - 2032
- 5.6.2 Europe market from 1 MW - 2 MW, by country, 2019 - 2032
- 5.7 2 MW - 5 MW
- 5.7.1 Europe market from 2 MW - 5 MW, 2019 - 2032
- 5.7.2 Europe market from 2 MW - 5 MW, by country, 2019 - 2032
- 5.8 > 5MW
- 5.8.1 Europe market from > 5MW, 2019 - 2032
- 5.8.2 Europe market from > 5MW, by country, 2019 - 2032
Chapter 6 Europe Industrial Heat Pump Market, By Temperature
- 6.1 Key temperature trends
- 6.2 80°C - 100°C
- 6.2.1 Europe market from 80°C - 100°C, 2019 - 2032
- 6.2.2 Europe market from 80°C - 100°C, by country, 2019 - 2032
- 6.3 100°C - 150°C
- 6.3.1 Europe market from 100°C - 150°C, 2019 - 2032
- 6.3.2 Europe market from 100°C - 150°C, by country, 2019 - 2032
- 6.4 150°C - 200°C
- 6.4.1 Europe market from 150°C - 200°C, 2019 - 2032
- 6.4.2 Europe market from 150°C - 200°C, by country, 2019 - 2032
- 6.5 > 200°C
- 6.5.1 Europe market from > 200°C, 2019 - 2032
- 6.5.2 Europe market from > 200°C, by country, 2019 - 2032
Chapter 7 Europe Industrial Heat Pump Market, By Application
- 7.1 Key application trends
- 7.2 Industrial
- 7.2.1 Europe market from industrial, 2019 - 2032
- 7.2.2 Europe market from industrial, by country, 2019 - 2032
- 7.2.3 Paper
- 7.2.3.1 Europe market from paper, 2019 - 2032
- 7.2.3.2 Europe market from paper, by country, 2019 - 2032
- 7.2.4 Food & beverages
- 7.2.4.1 Europe market from food & beverages, 2019 - 2032
- 7.2.4.2 Europe market from food & beverages, by country, 2019 - 2032
- 7.2.5 Chemical
- 7.2.5.1 Europe market from chemical, 2019 - 2032
- 7.2.5.2 Europe market from chemical, by country, 2019 - 2032
- 7.2.6 Iron & steel
- 7.2.6.1 Europe market from iron & steel, 2019 - 2032
- 7.2.6.2 Europe market from iron & steel, by country, 2019 - 2032
- 7.2.7 Machinery
- 7.2.7.1 Europe market from machinery, 2019 - 2032
- 7.2.7.2 Europe market from machinery, by country, 2019 - 2032
- 7.2.8 Non-metallic minerals
- 7.2.8.1 Europe market from non-metallic minerals, 2019 - 2032
- 7.2.8.2 Europe market from non-metallic minerals, by country, 2019 - 2032
- 7.2.9 Others
- 7.2.9.1 Europe market from others, 2019 - 2032
- 7.2.9.2 Europe market from others, by country, 2019 - 2032
- 7.3 District heating
- 7.3.1 Europe market from district heating, 2019 - 2032
- 7.3.2 Europe market from district heating, by country, 2019 - 2032
Chapter 8 Europe Industrial Heat Pump Market, By Country
- 8.1 Key country trends
- 8.2 UK
- 8.2.1 UK market, 2019 - 2032
- 8.2.2 UK market by product, 2019 - 2032
- 8.2.3 UK market by capacity, 2019 - 2032
- 8.2.4 UK market by temperature, 2019 - 2032
- 8.2.5 UK market by application, 2019 - 2032
- 8.2.5.1 UK market by industrial, 2019 - 2032
- 8.3 Norway
- 8.3.1 Norway market, 2019 - 2032
- 8.3.2 Norway market by product, 2019 - 2032
- 8.3.3 Norway market by capacity, 2019 - 2032
- 8.3.4 Norway market by temperature, 2019 - 2032
- 8.3.5 Norway market by application, 2019 - 2032
- 8.3.5.1 Norway market by industrial, 2019 - 2032
- 8.4 Denmark
- 8.4.1 Denmark market, 2019 - 2032
- 8.4.2 Denmark market by product, 2019 - 2032
- 8.4.3 Denmark market by capacity, 2019 - 2032
- 8.4.4 Denmark market by temperature, 2019 - 2032
- 8.4.5 Denmark market by application, 2019 - 2032
- 8.4.5.1 Denmark market by industrial, 2019 - 2032
- 8.5 Finland
- 8.5.1 Finland market, 2019 - 2032
- 8.5.2 Finland market by product, 2019 - 2032
- 8.5.3 Finland market by capacity, 2019 - 2032
- 8.5.4 Finland market by temperature, 2019 - 2032
- 8.5.5 Finland market by application, 2019 - 2032
- 8.5.5.1 Finland market by industrial, 2019 - 2032
- 8.6 Sweden
- 8.6.1 Sweden market, 2019 - 2032
- 8.6.2 Sweden market by product, 2019 - 2032
- 8.6.3 Sweden market by capacity, 2019 - 2032
- 8.6.4 Sweden market by temperature, 2019 - 2032
- 8.6.5 Sweden market by application, 2019 - 2032
- 8.6.5.1 Sweden market by industrial, 2019 - 2032
- 8.7 Germany
- 8.7.1 Germany market, 2019 - 2032
- 8.7.2 Germany market by product, 2019 - 2032
- 8.7.3 Germany market by capacity, 2019 - 2032
- 8.7.4 Germany market by temperature, 2019 - 2032
- 8.7.5 Germany market by application, 2019 - 2032
- 8.7.5.1 Germany market by industrial, 2019 - 2032
- 8.8 Poland
- 8.8.1 Poland market, 2019 - 2032
- 8.8.2 Poland market by product, 2019 - 2032
- 8.8.3 Poland market by capacity, 2019 - 2032
- 8.8.4 Poland market by temperature, 2019 - 2032
- 8.8.5 Poland market by application, 2019 - 2032
- 8.8.5.1 Poland market by industrial, 2019 - 2032
- 8.9 Spain
- 8.9.1 Spain market, 2019 - 2032
- 8.9.2 Spain market by product, 2019 - 2032
- 8.9.3 Spain market by capacity, 2019 - 2032
- 8.9.4 Spain market by temperature, 2019 - 2032
- 8.9.5 Spain market by application, 2019 - 2032
- 8.9.5.1 Spain market by industrial, 2019 - 2032
- 8.10 Austria
- 8.10.1 Austria market, 2019 - 2032
- 8.10.2 Austria market by product, 2019 - 2032
- 8.10.3 Austria market by capacity, 2019 - 2032
- 8.10.4 Austria market by temperature, 2019 - 2032
- 8.10.5 Austria market by application, 2019 - 2032
- 8.10.5.1 Austria market by industrial, 2019 - 2032
Chapter 9 Company Profiles
- 9.1 Piller Blowers & Compressors GmbH
- 9.1.1 Business overview
- 9.1.2 Financial data
- 9.1.3 Product landscape
- 9.1.4 Strategic outlook
- 9.1.5 SWOT analysis
- 9.2 MAN Energy Solutions
- 9.2.1 Business overview
- 9.2.2 Financial data
- 9.2.3 Product landscape
- 9.2.4 Strategic outlook
- 9.2.5 SWOT analysis
- 9.3 GEA Group Aktiengesellschaft
- 9.3.1 Business overview
- 9.3.2 Financial data
- 9.3.3 Product landscape
- 9.3.4 Strategic outlook
- 9.3.5 SWOT analysis
- 9.4 Atlas Copco AB
- 9.4.1 Business overview
- 9.4.2 Financial data
- 9.4.3 Product landscape
- 9.4.4 Strategic outlook
- 9.4.5 SWOT analysis
- 9.5 Oilon Group Oy
- 9.5.1 Business overview
- 9.5.2 Financial data
- 9.5.3 Product landscape
- 9.5.4 Strategic outlook
- 9.5.5 SWOT analysis
- 9.6 Siemens Energy
- 9.6.1 Business overview
- 9.6.2 Financial data
- 9.6.3 Product landscape
- 9.6.4 Strategic Outlook
- 9.6.5 SWOT analysis
- 9.7 HELIOTHERM Warmepumpentechnik Ges.m.b.H.
- 9.7.1 Business overview
- 9.7.2 Financial data
- 9.7.3 Product landscape
- 9.7.4 SWOT analysis
- 9.8 Carrier
- 9.8.1 Business overview
- 9.8.2 Financial data
- 9.8.3 Product landscape
- 9.8.4 Strategic outlook
- 9.8.5 SWOT analysis
- 9.9 Trane Technologies International Limited
- 9.9.1 Business overview
- 9.9.2 Financial data
- 9.9.3 Product landscape
- 9.9.4 Strategic outlook
- 9.9.5 SWOT analysis
- 9.10 AGO GmbH Energie + Anlagen
- 9.10.1 Business overview
- 9.10.2 Financial data
- 9.10.3 Product landscape
- 9.10.4 SWOT analysis
- 9.11 Thermax Limited
- 9.11.1 Business overview
- 9.11.2 Financial data
- 9.11.3 Product landscape
- 9.11.4 Strategic outlook
- 9.11.5 SWOT analysis
- 9.12 Daikin Applied Europe S.p.A.
- 9.12.1 Business overview
- 9.12.2 Financial data
- 9.12.3 Product landscape
- 9.12.4 Strategic outlook
- 9.12.5 SWOT analysis
- 9.13 Hybrid Energy AS
- 9.13.1 Business overview
- 9.13.2 Financial data
- 9.13.3 Product landscape
- 9.13.4 SWOT analysis
- 9.14 OCHSNER
- 9.14.1 Business overview
- 9.14.2 Financial data
- 9.14.3 Product landscape
- 9.14.4 SWOT analysis
- 9.15 Danfoss
- 9.15.1 Business overview
- 9.15.2 Financial data
- 9.15.3 Product landscape
- 9.15.4 Strategic outlook
- 9.15.5 SWOT analysis
- 9.16 Mitsubishi Electric Corporation
- 9.16.1 Business overview
- 9.16.2 Financial data
- 9.16.3 Product landscape
- 9.16.4 SWOT analysis