市場調査レポート
商品コード
1252583

電気バスの世界市場規模:タイプ別、バッテリー容量別、座席数別、用途別&予測:2023年~2032年

Electric Bus Market Size By Type, By Battery Capacity, By Seating Capacity, By Application & Forecast, 2023 - 2032

出版日: | 発行: Global Market Insights Inc. | ページ情報: 英文 300 Pages | 納期: 2~3営業日

● お客様のご希望に応じて、既存データの加工や未掲載情報(例:国別セグメント)の追加などの対応が可能です。  詳細はお問い合わせください。

価格
価格表記: USDを日本円(税抜)に換算
本日の銀行送金レート: 1USD=156.53円
電気バスの世界市場規模:タイプ別、バッテリー容量別、座席数別、用途別&予測:2023年~2032年
出版日: 2023年03月31日
発行: Global Market Insights Inc.
ページ情報: 英文 300 Pages
納期: 2~3営業日
  • 全表示
  • 概要
  • 図表
  • 目次
概要

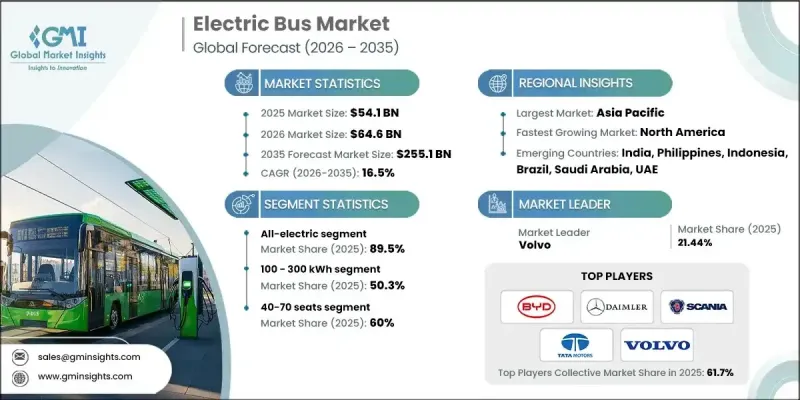
電気バスは、電気自動車市場の中で最も急速に成長している部品の一つであるため、2032年までのCAGRは10%を超えると予想されています。

急速な都市化に伴い、電気バスの販売台数は飛躍的に増加することが予想されます。また、継続的な技術革新により、バッテリーの性能も向上していくと推測されます。国や地方自治体の政策が着実に低排出ガス化に向かう中、Eバス業界は情勢の変化からさらに恩恵を受けると予想されます。さらに、コストが下がるにつれて、予算が厳しい地方自治体は、電気バスへの依存度を高めていくと思われます。

全体として、電気バス産業は、タイプ、バッテリー容量、座席数、アプリケーション、地域の観点からセグメント化されています。

タイプ別では、FCEVはEVに比べて運用コストが低く、技術的なメンテナンスも容易であることから、大きな需要が見込まれています。また、バッテリー性能の向上と燃料電池容量の増加により、TCOを削減する水素電池の技術革新が、このセグメントの成長を後押しするものと思われます。さらに、FCEVバスは、燃焼エンジンとして機能する水素燃料電池で走行します。水素燃料の研究開発の増加は、FCEVバスの市場需要をさらに促進すると予想されます。

バッテリー別では、100kWh以下のバッテリーが大きく成長すると予想されます。100kWh以下の電気バスは、町や都市内のような近距離の通勤に最も適した選択肢となっています。また、100kWh以下のバッテリーはより低価格であるため、今後数年間は業界の成長を促進すると予想されます。

座席数では、40席以下のバスが観光輸送用途で強い勢いを見せると予想されます。この種の電気バスは、主に短距離の移動用に設計されています。ホテルや宿泊施設では、従業員に環境に優しい交通手段を提供するために40席以下のバスの利用が増加しており、予測期間中、このセグメントの成長を促進すると予想されます。

用途別では、都市間輸送分野が2023-2032年に顕著な伸びを示すと予想されます。電気自動車への政府投資の増加、新興ホテル、各都市の公共交通機関が、都市間アプリケーションにおける電気バスの需要を促進すると考えられます。

地域別では、北米の電気バス産業が予測期間中に大きな成長を記録するでしょう。同地域では、交通渋滞やGHG排出量を削減するために電気バスを使用する傾向が強まっており、市場の拡大に影響を与えるでしょう。

目次

第1章 調査手法とスコープ

第2章 エグゼクティブサマリー

第3章 電気バス市場の業界洞察

  • COVID-19の影響について
  • ロシア・ウクライナ戦争の影響
  • 業界のエコシステム
    • 部品サプライヤー
    • テクノロジープロバイダー
    • メーカー
    • 販売店
    • エンドユーザー
    • 利益率分析
    • ベンダーマトリクス
  • テクノロジーとイノベーションの展望
    • テレマティクス
    • IPM(インテリアパーマネントマグネット)モーター
    • 電気バス用パンタグラフ
  • 特許分析
  • 主な取り組みとニュース
    • 新製品発表会
    • パートナーシップ/コラボレーション
    • 事業拡大
  • 規制状況について
  • 業界への影響要因
    • 促進要因
      • 公共交通機関の大幅な電化
      • 電気バスの低メンテナンスコスト
      • 北米で充電インフラ整備に向けた政府投資の増加
      • 欧州における電池技術の研究開発の活発化
      • アジア太平洋地域における環境に配慮した交通・モビリティへの需要の高まり
      • MEAとラテンアメリカにおけるフリートオペレーターの代替燃料への関心の高まり
    • 業界の潜在的リスク&課題
      • 電気バスにまつわる高いコスト
  • 成長性分析
  • ポーター分析
  • PESTEL分析

第4章 競合情勢、2022年

  • イントロダクション
  • 各社の市場シェア、2022年
  • 主要市場プレイヤーの競争分析、2022年
    • BYD co. ltd.
    • Yutong Bus Co. Ltd.
    • MAN Bus
    • Solaris Bus & Couch
    • AB Volvo
    • Scania AB
    • VDL Bus & Coach
  • 競合のポジショニングマトリックス
  • 戦略的展望マトリクス

第5章 電気バス市場:タイプ別(売上高、出荷台数)

  • 主な動向(タイプ別
  • オール電化
  • PHEV
  • FCEV

第6章 電気バス市場:電池容量別(売上高、出荷台数)

  • 主要動向(電池容量別
  • 100kWh以下
  • 100~300kWh
  • 300kWh以上

第7章 電気バス市場:座席数別(売上高、出荷台数)

  • 主な動向(座席数別
  • 40席以下
  • 40~70席
  • 70席以上

第8章 電気バス市場:用途別(売上高、出荷台数)

  • 主な動向(アプリケーション別
  • インターシティ
  • イントラシティ

第9章 電気バス市場:地域別(売上高、出荷台数)

  • 主な動向(地域別
  • 北米
    • 米国
    • カナダ
  • 欧州
    • 英国
    • ドイツ
    • フランス
    • イタリア
    • ロシア
    • オランダ
  • アジア太平洋地域
    • 中国
    • インド
    • 日本
    • 韓国
  • ラテンアメリカ
    • ブラジル
    • メキシコ
    • アルゼンチン
    • チリ
  • MEA
    • UAE
    • サウジアラビア
    • 南アフリカ

第10章 企業プロファイル

  • Anhui Ankai Automobile Co., Ltd.
  • Beiqi Foton Motor Co., Ltd.
  • BYD Co. Ltd.
  • Daimler AG
  • Ebusco
  • Irizar Group
  • IVECO S.p.A.
  • King Long United Automotive Industry Co., Ltd.
  • MAN BUS
  • NFI Group, Inc.
  • Proterra
  • Scania AB
  • Solaris Bus & Couch
  • TATA motors
  • VDL Bus & Coach
  • Volvo
  • Xiamen Golden Dragon Bus Co. Ltd
  • Zhengzhou Yutong Bus Co., Ltd.
  • Zhongtong Bus Co. Ltd.
図表
  • TABLE 221 Russia Electric bus market, by seating capacity, 2023-2032 (USD Million)
  • TABLE 222 Russia Electric bus market, by seating capacity, 2018-2022 (Units)
  • TABLE 223 Russia Electric bus market, by seating capacity, 2023-2032 (Units)
  • TABLE 224 Russia Electric bus market, by application, 2018-2022 (USD Million)
  • TABLE 225 Russia Electric bus market, by application, 2023-2032 (USD Million)
  • TABLE 226 Russia Electric bus market, by application, 2018-2022 (Units)
  • TABLE 227 Russia Electric bus market, by application, 2023-2032 (Units)
  • TABLE 228 Netherlands Electric bus market, by type, 2018-2022 (USD Million)
  • TABLE 229 Netherlands Electric bus market, by type, 2023-2032 (USD Million)
  • TABLE 230 Netherlands Electric bus market, by type, 2018-2022 (Units)
  • TABLE 231 Netherlands Electric bus market, by type, 2023-2032 (Units)
  • TABLE 232 Netherlands Electric bus market, by battery capacity, 2018-2022 (USD Million)
  • TABLE 233 Netherlands Electric bus market, by battery capacity, 2023-2032 (USD Million)
  • TABLE 234 Netherlands Electric bus market, by battery capacity, 2018-2022 (Units)
  • TABLE 235 Netherlands Electric bus market, by battery capacity, 2023-2032 (Units)
  • TABLE 236 Netherlands Electric bus market, by seating capacity, 2018-2022 (USD Million)
  • TABLE 237 Netherlands Electric bus market, by seating capacity, 2023-2032 (USD Million)
  • TABLE 238 Netherlands Electric bus market, by seating capacity, 2018-2022 (Units)
  • TABLE 239 Netherlands Electric bus market, by seating capacity, 2023-2032 (Units)
  • TABLE 240 Netherlands Electric bus market, by application, 2018-2022 (USD Million)
  • TABLE 241 Netherlands Electric bus market, by application, 2023-2032 (USD Million)
  • TABLE 242 Netherlands Electric bus market, by application, 2018-2022 (Units)
  • TABLE 243 Netherlands Electric bus market, by application, 2023-2032 (Units)
  • TABLE 244 Asia Pacific Electric bus market, by type, 2018-2022 (USD Million)
  • TABLE 245 Asia Pacific Electric bus market, by type, 2023-2032 (USD Million)
  • TABLE 246 Asia Pacific Electric bus market, by type, 2018-2022 (Units)
  • TABLE 247 Asia Pacific Electric bus market, by type, 2023-2032 (Units)
  • TABLE 248 Asia Pacific Electric bus market, by battery capacity, 2018-2022 (USD Million)
  • TABLE 249 Asia Pacific Electric bus market, by battery capacity, 2023-2032 (USD Million)
  • TABLE 250 Asia Pacific Electric bus market, by battery capacity, 2018-2022 (Units)
  • TABLE 251 Asia Pacific Electric bus market, by battery capacity, 2023-2032 (Units)
  • TABLE 252 Asia Pacific Electric bus market, by seating capacity, 2018-2022 (USD Million)
  • TABLE 253 Asia Pacific Electric bus market, by seating capacity, 2023-2032 (USD Million)
  • TABLE 254 Asia Pacific Electric bus market, by seating capacity, 2018-2022 (Units)
  • TABLE 255 Asia Pacific Electric bus market, by seating capacity, 2023-2032 (Units)
  • TABLE 256 Asia Pacific Electric bus market, by application, 2018-2022 (USD Million)
  • TABLE 257 Asia Pacific Electric bus market, by application, 2023-2032 (USD Million)
  • TABLE 258 Asia Pacific Electric bus market, by application, 2018-2022 (Units)
  • TABLE 259 Asia Pacific Electric bus market, by application, 2023-2032 (Units)
  • TABLE 260 China Electric bus market, by type, 2018-2022 (USD Million)
  • TABLE 261 China Electric bus market, by type, 2023-2032 (USD Million)
  • TABLE 262 China Electric bus market, by type, 2018-2022 (Units)
  • TABLE 263 China Electric bus market, by type, 2023-2032 (Units)
  • TABLE 264 China Electric bus market, by battery capacity, 2018-2022 (USD Million)
  • TABLE 265 China Electric bus market, by battery capacity, 2023-2032 (USD Million)
  • TABLE 266 China Electric bus market, by battery capacity, 2018-2022 (Units)
  • TABLE 267 China Electric bus market, by battery capacity, 2023-2032 (Units)
  • TABLE 268 China Electric bus market, by seating capacity, 2018-2022 (USD Million)
  • TABLE 269 China Electric bus market, by seating capacity, 2023-2032 (USD Million)
  • TABLE 270 China Electric bus market, by seating capacity, 2018-2022 (Units)
  • TABLE 271 China Electric bus market, by seating capacity, 2023-2032 (Units)
  • TABLE 272 China Electric bus market, by application, 2018-2022 (USD Million)
  • TABLE 273 China Electric bus market, by application, 2023-2032 (USD Million)
  • TABLE 274 China Electric bus market, by application, 2018-2022 (Units)
  • TABLE 275 China Electric bus market, by application, 2023-2032 (Units)
  • TABLE 276 India Electric bus market, by region, 2018-2022 (USD Million)
  • TABLE 277 India Electric bus market, by region, 2023-2032 (USD Million)
  • TABLE 278 India Electric bus market, by region, 2018-2022 (Units)
  • TABLE 279 India Electric bus market, by region, 2023-2032 (Units)
  • TABLE 280 India Electric bus market, by type, 2018-2022 (USD Million)
  • TABLE 281 India Electric bus market, by type, 2023-2032 (USD Million)
  • TABLE 282 India Electric bus market, by type, 2018-2022 (Units)
  • TABLE 283 India Electric bus market, by type, 2023-2032 (Units)
  • TABLE 284 India Electric bus market, by battery capacity, 2018-2022 (USD Million)
  • TABLE 285 India Electric bus market, by battery capacity, 2023-2032 (USD Million)
  • TABLE 286 India Electric bus market, by battery capacity, 2018-2022 (Units)
  • TABLE 287 India Electric bus market, by battery capacity, 2023-2032 (Units)
  • TABLE 288 India Electric bus market, by seating capacity, 2018-2022 (USD Million)
  • TABLE 289 India Electric bus market, by seating capacity, 2023-2032 (USD Million)
  • TABLE 290 India Electric bus market, by seating capacity, 2018-2022 (Units)
  • TABLE 291 India Electric bus market, by seating capacity, 2023-2032 (Units)
  • TABLE 292 India Electric bus market, by application, 2018-2022 (USD Million)
  • TABLE 293 India Electric bus market, by application, 2023-2032 (USD Million)
  • TABLE 294 India Electric bus market, by application, 2018-2022 (Units)
  • TABLE 295 India Electric bus market, by application, 2023-2032 (Units)
  • TABLE 296 Japan Electric bus market, by type, 2018-2022 (USD Million)
  • TABLE 297 Japan Electric bus market, by type, 2023-2032 (USD Million)
  • TABLE 298 Japan Electric bus market, by type, 2018-2022 (Units)
  • TABLE 299 Japan Electric bus market, by type, 2023-2032 (Units)
  • TABLE 300 Japan Electric bus market, by battery capacity, 2018-2022 (USD Million)
  • TABLE 301 Japan Electric bus market, by battery capacity, 2023-2032 (USD Million)
  • TABLE 302 Japan Electric bus market, by battery capacity, 2018-2022 (Units)
  • TABLE 303 Japan Electric bus market, by battery capacity, 2023-2032 (Units)
  • TABLE 304 Japan Electric bus market, by seating capacity, 2018-2022 (USD Million)
  • TABLE 305 Japan Electric bus market, by seating capacity, 2023-2032 (USD Million)
  • TABLE 306 Japan Electric bus market, by seating capacity, 2018-2022 (Units)
  • TABLE 307 Japan Electric bus market, by seating capacity, 2023-2032 (Units)
  • TABLE 308 Japan Electric bus market, by application, 2018-2022 (USD Million)
  • TABLE 309 Japan Electric bus market, by application, 2023-2032 (USD Million)
  • TABLE 310 Japan Electric bus market, by application, 2018-2022 (Units)
  • TABLE 311 Japan Electric bus market, by application, 2023-2032 (Units)
  • TABLE 312 South Korea Electric bus market, by type, 2018-2022 (USD Million)
  • TABLE 313 South Korea Electric bus market, by type, 2023-2032 (USD Million)
  • TABLE 314 South Korea Electric bus market, by type, 2018-2022 (Units)
  • TABLE 315 South Korea Electric bus market, by type, 2023-2032 (Units)
  • TABLE 316 South Korea Electric bus market, by battery capacity, 2018-2022 (USD Million)
  • TABLE 317 South Korea Electric bus market, by battery capacity, 2023-2032 (USD Million)
  • TABLE 318 South Korea Electric bus market, by battery capacity, 2018-2022 (Units)
  • TABLE 319 South Korea Electric bus market, by battery capacity, 2023-2032 (Units)
  • TABLE 320 South Korea Electric bus market, by seating capacity, 2018-2022 (USD Million)
  • TABLE 321 South Korea Electric bus market, by seating capacity, 2023-2032 (USD Million)
  • TABLE 322 South Korea Electric bus market, by seating capacity, 2018-2022 (Units)
  • TABLE 323 South Korea Electric bus market, by seating capacity, 2023-2032 (Units)
  • TABLE 324 South Korea Electric bus market, by application, 2018-2022 (USD Million)
  • TABLE 325 South Korea Electric bus market, by application, 2023-2032 (USD Million)
  • TABLE 326 South Korea Electric bus market, by application, 2018-2022 (Units)
  • TABLE 327 South Korea Electric bus market, by application, 2023-2032 (Units)
  • TABLE 328 Latin America Electric bus market, by type, 2018-2022 (USD Million)
  • TABLE 329 Latin America Electric bus market, by type, 2023-2032 (USD Million)
  • TABLE 330 Latin America Electric bus market, by type, 2018-2022 (Units)
  • TABLE 331 Latin America Electric bus market, by type, 2023-2032 (Units)
  • TABLE 332 Latin America Electric bus market, by battery capacity, 2018-2022 (USD Million)
  • TABLE 333 Latin America Electric bus market, by battery capacity, 2023-2032 (USD Million)
  • TABLE 334 Latin America Electric bus market, by battery capacity, 2018-2022 (Units)
  • TABLE 335 Latin America Electric bus market, by battery capacity, 2023-2032 (Units)
  • TABLE 336 Latin America Electric bus market, by seating capacity, 2018-2022 (USD Million)
  • TABLE 337 Latin America Electric bus market, by seating capacity, 2023-2032 (USD Million)
  • TABLE 338 Latin America Electric bus market, by seating capacity, 2018-2022 (Units)
  • TABLE 339 Latin America Electric bus market, by seating capacity, 2023-2032 (Units)
  • TABLE 340 Latin America Electric bus market, by application, 2018-2022 (USD Million)
  • TABLE 341 Latin America Electric bus market, by application, 2023-2032 (USD Million)
  • TABLE 342 Latin America Electric bus market, by application, 2018-2022 (Units)
  • TABLE 343 Latin America Electric bus market, by application, 2023-2032 (Units)
  • TABLE 344 Brazil Electric bus market, by type, 2018-2022 (USD Million)
  • TABLE 345 Brazil Electric bus market, by type, 2023-2032 (USD Million)
  • TABLE 346 Brazil Electric bus market, by type, 2018-2022 (Units)
  • TABLE 347 Brazil Electric bus market, by type, 2023-2032 (Units)
  • TABLE 348 Brazil Electric bus market, by battery capacity, 2018-2022 (USD Million)
  • TABLE 349 Brazil Electric bus market, by battery capacity, 2023-2032 (USD Million)
  • TABLE 350 Brazil Electric bus market, by battery capacity, 2018-2022 (Units)
  • TABLE 351 Brazil Electric bus market, by battery capacity, 2023-2032 (Units)
  • TABLE 352 Brazil Electric bus market, by seating capacity, 2018-2022 (USD Million)
  • TABLE 353 Brazil Electric bus market, by seating capacity, 2023-2032 (USD Million)
  • TABLE 354 Brazil Electric bus market, by seating capacity, 2018-2022 (Units)
  • TABLE 355 Brazil Electric bus market, by seating capacity, 2023-2032 (Units)
  • TABLE 356 Brazil Electric bus market, by application, 2018-2022 (USD Million)
  • TABLE 357 Brazil Electric bus market, by application, 2023-2032 (USD Million)
  • TABLE 358 Brazil Electric bus market, by application, 2018-2022 (Units)
  • TABLE 359 Brazil Electric bus market, by application, 2023-2032 (Units)
  • TABLE 360 Mexico Electric bus market, by type, 2018-2022 (USD Million)
  • TABLE 361 Mexico Electric bus market, by type, 2023-2032 (USD Million)
  • TABLE 362 Mexico Electric bus market, by type, 2018-2022 (Units)
  • TABLE 363 Mexico Electric bus market, by type, 2023-2032 (Units)
  • TABLE 364 Mexico Electric bus market, by battery capacity, 2018-2022 (USD Million)
  • TABLE 365 Mexico Electric bus market, by battery capacity, 2023-2032 (USD Million)
  • TABLE 366 Mexico Electric bus market, by battery capacity, 2018-2022 (Units)
  • TABLE 367 Mexico Electric bus market, by battery capacity, 2023-2032 (Units)
  • TABLE 368 Mexico Electric bus market, by seating capacity, 2018-2022 (USD Million)
  • TABLE 369 Mexico Electric bus market, by seating capacity, 2023-2032 (USD Million)
  • TABLE 370 Mexico Electric bus market, by seating capacity, 2018-2022 (Units)
  • TABLE 371 Mexico Electric bus market, by seating capacity, 2023-2032 (Units)
  • TABLE 372 Mexico Electric bus market, by application, 2018-2022 (USD Million)
  • TABLE 373 Mexico Electric bus market, by application, 2023-2032 (USD Million)
  • TABLE 374 Mexico Electric bus market, by application, 2018-2022 (Units)
  • TABLE 375 Mexico Electric bus market, by application, 2023-2032 (Units)
  • TABLE 376 Argentina Electric bus market, by type, 2018-2022 (USD Million)
  • TABLE 377 Argentina Electric bus market, by type, 2023-2032 (USD Million)
  • TABLE 378 Argentina Electric bus market, by type, 2018-2022 (Units)
  • TABLE 379 Argentina Electric bus market, by type, 2023-2032 (Units)
  • TABLE 380 Argentina Electric bus market, by battery capacity, 2018-2022 (USD Million)
  • TABLE 381 Argentina Electric bus market, by battery capacity, 2023-2032 (USD Million)
  • TABLE 382 Argentina Electric bus market, by battery capacity, 2018-2022 (Units)
  • TABLE 383 Argentina Electric bus market, by battery capacity, 2023-2032 (Units)
  • TABLE 384 Argentina Electric bus market, by seating capacity, 2018-2022 (USD Million)
  • TABLE 385 Argentina Electric bus market, by seating capacity, 2023-2032 (USD Million)
  • TABLE 386 Argentina Electric bus market, by seating capacity, 2018-2022 (Units)
  • TABLE 387 Argentina Electric bus market, by seating capacity, 2023-2032 (Units)
  • TABLE 388 Argentina Electric bus market, by application, 2018-2022 (USD Million)
  • TABLE 389 Argentina Electric bus market, by application, 2023-2032 (USD Million)
  • TABLE 390 Argentina Electric bus market, by application, 2018-2022 (Units)
  • TABLE 391 Argentina Electric bus market, by application, 2023-2032 (Units)
  • TABLE 392 Chile Electric bus market, by type, 2018-2022 (USD Million)
  • TABLE 393 Chile Electric bus market, by type, 2023-2032 (USD Million)
  • TABLE 394 Chile Electric bus market, by type, 2018-2022 (Units)
  • TABLE 395 Chile Electric bus market, by type, 2023-2032 (Units)
  • TABLE 396 Chile Electric bus market, by battery capacity, 2018-2022 (USD Million)
  • TABLE 397 Chile Electric bus market, by battery capacity, 2023-2032 (USD Million)
  • TABLE 398 Chile Electric bus market, by battery capacity, 2018-2022 (Units)
  • TABLE 399 Chile Electric bus market, by battery capacity, 2023-2032 (Units)
  • TABLE 400 Chile Electric bus market, by seating capacity, 2018-2022 (USD Million)
  • TABLE 401 Chile Electric bus market, by seating capacity, 2023-2032 (USD Million)
  • TABLE 402 Chile Electric bus market, by seating capacity, 2018-2022 (Units)
  • TABLE 403 Chile Electric bus market, by seating capacity, 2023-2032 (Units)
  • TABLE 404 Chile Electric bus market, by application, 2018-2022 (USD Million)
  • TABLE 405 Chile Electric bus market, by application, 2023-2032 (USD Million)
  • TABLE 406 Chile Electric bus market, by application, 2018-2022 (Units)
  • TABLE 407 Chile Electric bus market, by application, 2023-2032 (Units)
  • TABLE 408 MEA Electric bus market, by type, 2018-2022 (USD Million)
  • TABLE 409 MEA Electric bus market, by type, 2023-2032 (USD Million)
  • TABLE 410 MEA Electric bus market, by type, 2018-2022 (Units)
  • TABLE 411 MEA Electric bus market, by type, 2023-2032 (Units)
  • TABLE 412 MEA Electric bus market, by battery capacity, 2018-2022 (USD Million)
  • TABLE 413 MEA Electric bus market, by battery capacity, 2023-2032 (USD Million)
  • TABLE 414 MEA Electric bus market, by battery capacity, 2018-2022 (Units)
  • TABLE 415 MEA Electric bus market, by battery capacity, 2023-2032 (Units)
  • TABLE 416 MEA Electric bus market, by seating capacity, 2018-2022 (USD Million)
  • TABLE 417 MEA Electric bus market, by seating capacity, 2023-2032 (USD Million)
  • TABLE 418 MEA Electric bus market, by seating capacity, 2018-2022 (Units)
  • TABLE 419 MEA Electric bus market, by seating capacity, 2023-2032 (Units)
  • TABLE 420 MEA Electric bus market, by application, 2018-2022 (USD Million)
  • TABLE 421 MEA Electric bus market, by application, 2023-2032 (USD Million)
  • TABLE 422 MEA Electric bus market, by application, 2018-2022 (Units)
  • TABLE 423 MEA Electric bus market, by application, 2023-2032 (Units)
  • TABLE 424 UAE Electric bus market, by type, 2018-2022 (USD Million)
  • TABLE 425 UAE Electric bus market, by type, 2023-2032 (USD Million)
  • TABLE 426 UAE Electric bus market, by type, 2018-2022 (Units)
  • TABLE 427 UAE Electric bus market, by type, 2023-2032 (Units)
  • TABLE 428 UAE Electric bus market, by battery capacity, 2018-2022 (USD Million)
  • TABLE 429 UAE Electric bus market, by battery capacity, 2023-2032 (USD Million)
  • TABLE 430 UAE Electric bus market, by battery capacity, 2018-2022 (Units)
  • TABLE 431 UAE Electric bus market, by battery capacity, 2023-2032 (Units)
  • TABLE 432 UAE Electric bus market, by seating capacity, 2018-2022 (USD Million)
  • TABLE 433 UAE Electric bus market, by seating capacity, 2023-2032 (USD Million)
  • TABLE 434 UAE Electric bus market, by seating capacity, 2018-2022 (Units)
  • TABLE 435 UAE Electric bus market, by seating capacity, 2023-2032 (Units)
  • TABLE 436 UAE Electric bus market, by application, 2018-2022 (USD Million)
  • TABLE 437 UAE Electric bus market, by application, 2023-2032 (USD Million)
  • TABLE 438 UAE Electric bus market, by application, 2018-2022 (Units)
  • TABLE 439 UAE Electric bus market, by application, 2023-2032 (Units)
  • TABLE 440 South Africa Electric bus market, by type, 2018-2022 (USD Million)
  • TABLE 441 South Africa Electric bus market, by type, 2023-2032 (USD Million)
  • TABLE 442 South Africa Electric bus market, by type, 2018-2022 (Units)
  • TABLE 443 South Africa Electric bus market, by type, 2023-2032 (Units)
  • TABLE 444 South Africa Electric bus market, by battery capacity, 2018-2022 (USD Million)
  • TABLE 445 South Africa Electric bus market, by battery capacity, 2023-2032 (USD Million)
  • TABLE 446 South Africa Electric bus market, by battery capacity, 2018-2022 (Units)
  • TABLE 447 South Africa Electric bus market, by battery capacity, 2023-2032 (Units)
  • TABLE 448 South Africa Electric bus market, by seating capacity, 2018-2022 (USD Million)
  • TABLE 449 South Africa Electric bus market, by seating capacity, 2023-2032 (USD Million)
  • TABLE 450 South Africa Electric bus market, by seating capacity, 2018-2022 (Units)
  • TABLE 451 South Africa Electric bus market, by seating capacity, 2023-2032 (Units)
  • TABLE 452 South Africa Electric bus market, by application, 2018-2022 (USD Million)
  • TABLE 453 South Africa Electric bus market, by application, 2023-2032 (USD Million)
  • TABLE 454 South Africa Electric bus market, by application, 2018-2022 (Units)
  • TABLE 455 South Africa Electric bus market, by application, 2023-2032 (Units)
  • TABLE 456 Saudi Arabia Electric bus market, by type, 2018-2022 (USD Million)
  • TABLE 457 Saudi Arabia Electric bus market, by type, 2023-2032 (USD Million)
  • TABLE 458 Saudi Arabia Electric bus market, by type, 2018-2022 (Units)
  • TABLE 459 Saudi Arabia Electric bus market, by type, 2023-2032 (Units)
  • TABLE 460 Saudi Arabia Electric bus market, by battery capacity, 2018-2022 (USD Million)
  • TABLE 461 Saudi Arabia Electric bus market, by battery capacity, 2023-2032 (USD Million)
  • TABLE 462 Saudi Arabia Electric bus market, by battery capacity, 2018-2022 (Units)
  • TABLE 463 Saudi Arabia Electric bus market, by battery capacity, 2023-2032 (Units)
  • TABLE 464 Saudi Arabia Electric bus market, by seating capacity, 2018-2022 (USD Million)
  • TABLE 465 Saudi Arabia Electric bus market, by seating capacity, 2023-2032 (USD Million)
  • TABLE 466 Saudi Arabia Electric bus market, by seating capacity, 2018-2022 (Units)
  • TABLE 467 Saudi Arabia Electric bus market, by seating capacity, 2023-2032 (Units)
  • TABLE 468 Saudi Arabia Electric bus market, by application, 2018-2022 (USD Million)
  • TABLE 469 Saudi Arabia Electric bus market, by application, 2023-2032 (USD Million)
  • TABLE 470 Saudi Arabia Electric bus market, by application, 2018-2022 (Units)
  • TABLE 471 Saudi Arabia Electric bus market, by application, 2023-2032 (Units)

Charts & Figures

  • FIG 1 GMI's report coverage in the Electric bus market
  • FIG 2 Industry segmentation
  • FIG 3 Forecast calculations
  • FIG 4 Profile break-up of primary respondents
  • FIG 5 Electric bus industry 360 degree synopsis, 2018-2032
  • FIG 6 Industry ecosystem analysis
  • FIG 7 Profit margin analysis
  • FIG 8 Growth potential analysis
  • FIG 9 Porter's analysis
  • FIG 10 PESTEL analysis
  • FIG 11 Company market share, 2022
  • FIG 12 Competitive analysis of major market players, 2022
  • FIG 13 Competitive positioning matrix, 2022
  • FIG 14 Strategic outlook matrix, 2022
  • FIG 15 SWOT Analysis, Anhui Ankai AutoPHEV Co., Ltd.
  • FIG 16 SWOT Analysis, Beiqi Foton Motor Co., Ltd.
  • FIG 17 SWOT Analysis, BYD Co. Ltd.
  • FIG 18 SWOT Analysis, Daimler AG
  • FIG 19 SWOT Analysis, Ebusco
  • FIG 20 SWOT Analysis, Irizar Group Technologies
  • FIG 21 SWOT Analysis, IVECO S.p.A.
  • FIG 22 SWOT Analysis, King Long United Automotive Industry Co., Ltd.
  • FIG 23 SWOT Analysis, MAN BUS
  • FIG 24 SWOT Analysis, NFI Group, Inc.
  • FIG 25 SWOT Analysis, Proterra
  • FIG 26 SWOT Analysis, Scania AB
  • FIG 27 SWOT Analysis, Solaris Bus & Couch
  • FIG 28 SWOT Analysis, TATA motors
  • FIG 29 SWOT Analysis, VDL Bus & Coach
  • FIG 30 SWOT Analysis, Volvo
  • FIG 31 SWOT Analysis, Xiamen Golden Dragon Bus Co. Ltd
  • FIG 32 SWOT Analysis, Zhengzhou Yutong Bus Co., Ltd.
  • FIG 33 SWOT Analysis, Zhongtong Bus Co., Ltd.
目次
Product Code: 4959

Electric Bus Market is anticipated to depict over 10% CAGR through 2032, as electric buses are among the fastest-growing parts of the EV market. With rapid urbanization, the sales of electric buses are set to grow exponentially. Ongoing technological innovations are also estimated to make batteries more powerful. The e-bus industry is expected to further be benefitted from the changing landscape as national and local policies steadily move towards lower emissions. Additionally, as costs drop, local governments with tight budgets will become more reliant on e-bus fleets.

Overall, the electric bus industry is segmented in terms of type, battery capacity, seating capacity, application, and region.

Based on type, the FCEV segment is anticipated to witness significant demand owing to its low operating cost and easy technical maintenance compared to EVs. In addition, the constant technological innovations across the hydrogen cells that reduce TCO by offering enhanced battery performance and surged fuel cell capacity will assist the segmental growth. Besides, FCEV buses run on hydrogen fuel cells that function as combustion engines. Increasing research and development studies in hydrogen fuel are further anticipated to fuel market demand for FCEV buses.

By battery, the below-100-KWh battery segment will grow considerably as electric buses under 100 kWh capacity have become most preferred choice for short-distance commutes, such as within a town or city. In addition, this battery segment is more affordable, which is anticipated to drive industry growth in the coming years.

In terms of the seating capacity, the below 40 seats bus segment will gain strong momentum in tourism transportation applications during the estimated timeframe. These kinds of electric buses are designed primarily for short-distance travel. Increasing use of below 40 seats buses by hotels and induvial organizations to offer an eco-friendly mode of transport for their staff is expected to drive the segment growth during the forecast period.

Considering the application, the intercity segment will showcase noticeable growth between 2023-2032. Increasing government investments in electric vehicles, emerging hotels, and public transportation authorities within various cities will drive the demand for electric buses in the intercity application.

Regionally, the North America electric buses industry will register strong growth during the forecast timeline. The increasing preference of using electric buses in the region to reduce traffic congestion and GHG emissions will influence market expansion.

Table of Contents

Chapter 1 Methodology and Scope

  • 1.1 Scope & definitions
  • 1.2 Base estimates and calculations
  • 1.3 Forecast calculations
  • 1.4 Data Sources
    • 1.4.1 Primary
    • 1.4.2 Secondary
      • 1.4.2.1 Paid sources
      • 1.4.2.2 Public sources

Chapter 2 Executive Summary

  • 2.1 Electric bus industry 360 degree synopsis, 2018-2032
  • 2.2 Business trends
    • 2.2.1 Total Addressable Market (TAM), 2023-2032
  • 2.3 Regional trends
  • 2.4 Type trends
  • 2.5 Battery capacity trends
  • 2.6 Seating capacity trends
  • 2.7 Application trends

Chapter 3 Electric Bus Market Industry Insights

  • 3.1 Impact of COVID-19
    • 3.1.1 North America
    • 3.1.2 Europe
    • 3.1.3 Asia Pacific
    • 3.1.4 Latin America
    • 3.1.5 MEA
  • 3.2 Russia- Ukraine war impact
  • 3.3 Industry ecosystem
    • 3.3.1 Component suppliers
    • 3.3.2 Technology providers
    • 3.3.3 Manufacturers
    • 3.3.4 Distributors
    • 3.3.5 End-users
    • 3.3.6 Profit margin analysis
    • 3.3.7 Vendor Matrix
  • 3.4 Technology & innovation landscape
    • 3.4.1 Telematics
    • 3.4.2 Interior Permanent Magnet (IPM) motors
    • 3.4.3 Electric Bus pantograph
  • 3.5 Patent analysis
  • 3.6 Key initiatives and news
    • 3.6.1 New product launch
    • 3.6.2 Partnerships/Collaborations
    • 3.6.3 Business Expansion
  • 3.7 Regulatory landscape
  • 3.8 Industry impact forces
    • 3.8.1 Growth drivers
      • 3.8.1.1 Significant electrification of public transport
      • 3.8.1.2 Low maintenance cost of electric bus
      • 3.8.1.3 Increasing government investment in charging infrastructure development in North America
      • 3.8.1.4 Rising R&D development in battery technology in Europe
      • 3.8.1.5 Growing demand for eco-friendly transport and mobility in Asia Pacific
      • 3.8.1.6 Shifting focus of fleet operators on alternative fuels in MEA and Latin America
    • 3.8.2 Industry pitfalls & challenges
      • 3.8.2.1 High cost associated with electric bus
  • 3.9 Growth potential analysis
  • 3.10 Porter's analysis
  • 3.11 PESTEL analysis

Chapter 4 Competitive Landscape, 2022

  • 4.1 Introduction
  • 4.2 Company market share, 2022
  • 4.3 Competitive analysis of major market players, 2022
    • 4.3.1 BYD co. ltd.
    • 4.3.2 Yutong Bus Co. Ltd.
    • 4.3.3 MAN Bus
    • 4.3.4 Solaris Bus & Couch
    • 4.3.5 AB Volvo
    • 4.3.6 Scania AB
    • 4.3.7 VDL Bus & Coach
  • 4.4 Competitive positioning matrix
  • 4.5 Strategic outlook matrix

Chapter 5 Electric Bus Market, By Type (Revenue, Shipments)

  • 5.1 Key trends, by type
  • 5.2 All electric
    • 5.2.1 Market estimates and forecast, 2018-2032
  • 5.3 PHEV
    • 5.3.1 Market estimates and forecast, 2018-2032
  • 5.4 FCEV
    • 5.4.1 Market estimates and forecast, 2018-2032

Chapter 6 Electric Bus Market, By Battery Capacity (Revenue, Shipments)

  • 6.1 Key trends, by battery capacity
  • 6.2 Below 100 kWh
    • 6.2.1 Market estimates and forecast, 2018-2032
  • 6.3 100-300 kWh
    • 6.3.1 Market estimates and forecast, 2018-2032
  • 6.4 Above 300 kWh
    • 6.4.1 Market estimates and forecast, 2018-2032

Chapter 7 Electric Bus Market, By Seating Capacity (Revenue, Shipments)

  • 7.1 Key trends, by seating capacity
  • 7.2 Below 40 Seats
    • 7.2.1 Market estimates and forecast, 2018-2032
  • 7.3 40-70 seats
    • 7.3.1 Market estimates and forecast, 2018-2032
  • 7.4 Above 70 seats
    • 7.4.1 Market estimates and forecast, 2018-2032

Chapter 8 Electric Bus Market, By Application (Revenue, Shipments)

  • 8.1 Key trends, by application
  • 8.2 Intercity
    • 8.2.1 Market estimates and forecast, 2018-2032
  • 8.3 Intracity
    • 8.3.1 Market estimates and forecast, 2018-2032

Chapter 9 Electric Bus Market, By Region (Revenue, Shipments)

  • 9.1 Key trends, by region
  • 9.2 North America
    • 9.2.1 Market estimates and forecast, 2018-2032
    • 9.2.2 Market estimates and forecast, by type, 2018-2032
    • 9.2.3 Market estimates and forecast, by battery capacity, 2018-2032
    • 9.2.4 Market estimates and forecast, by seating capacity, 2018-2032
    • 9.2.5 Market estimates and forecast, by application, 2018-2032
    • 9.2.6 U.S.
      • 9.2.6.1 Market estimates and forecast, 2018-2032
      • 9.2.6.2 Market estimates and forecast, by type, 2018-2032
      • 9.2.6.3 Market estimates and forecast, by battery capacity, 2018-2032
      • 9.2.6.4 Market estimates and forecast, by seating capacity, 2018-2032
      • 9.2.6.5 Market estimates and forecast, by application, 2018-2032
    • 9.2.7 Canada
      • 9.2.7.1 Market estimates and forecast, 2018-2032
      • 9.2.7.2 Market estimates and forecast, by type, 2018-2032
      • 9.2.7.3 Market estimates and forecast, by battery capacity, 2018-2032
      • 9.2.7.4 Market estimates and forecast, by seating capacity, 2018-2032
      • 9.2.7.5 Market estimates and forecast, by application, 2018-2032
  • 9.3 Europe
    • 9.3.1 Market estimates and forecast, 2018-2032
    • 9.3.2 Market estimates and forecast, by type, 2018-2032
    • 9.3.3 Market estimates and forecast, by battery capacity, 2018-2032
    • 9.3.4 Market estimates and forecast, by seating capacity, 2018-2032
    • 9.3.5 Market estimates and forecast, by application, 2018-2032
    • 9.3.6 UK
      • 9.3.6.1 Market estimates and forecast, 2018-2032
      • 9.3.6.2 Market estimates and forecast, by type, 2018-2032
      • 9.3.6.3 Market estimates and forecast, by battery capacity, 2018-2032
      • 9.3.6.4 Market estimates and forecast, by seating capacity, 2018-2032
      • 9.3.6.5 Market estimates and forecast, by application, 2018-2032
    • 9.3.7 Germany
      • 9.3.7.1 Market estimates and forecast, 2018-2032
      • 9.3.7.2 Market estimates and forecast, by type, 2018-2032
      • 9.3.7.3 Market estimates and forecast, by battery capacity, 2018-2032
      • 9.3.7.4 Market estimates and forecast, by seating capacity, 2018-2032
      • 9.3.7.5 Market estimates and forecast, by application, 2018-2032
    • 9.3.8 France
      • 9.3.8.1 Market estimates and forecast, 2018-2032
      • 9.3.8.2 Market estimates and forecast, by type, 2018-2032
      • 9.3.8.3 Market estimates and forecast, by battery capacity, 2018-2032
      • 9.3.8.4 Market estimates and forecast, by seating capacity, 2018-2032
      • 9.3.8.5 Market estimates and forecast, by application, 2018-2032
    • 9.3.9 Italy
      • 9.3.9.1 Market estimates and forecast, 2018-2032
      • 9.3.9.2 Market estimates and forecast, by type, 2018-2032
      • 9.3.9.3 Market estimates and forecast, by battery capacity, 2018-2032
      • 9.3.9.4 Market estimates and forecast, by seating capacity, 2018-2032
      • 9.3.9.5 Market estimates and forecast, by application, 2018-2032
    • 9.3.10 Russia
      • 9.3.10.1 Market estimates and forecast, 2018-2032
      • 9.3.10.2 Market estimates and forecast, by type, 2018-2032
      • 9.3.10.3 Market estimates and forecast, by battery capacity, 2018-2032
      • 9.3.10.4 Market estimates and forecast, by seating capacity, 2018-2032
      • 9.3.10.5 Market estimates and forecast, by application, 2018-2032
    • 9.3.11 Netherlands
      • 9.3.11.1 Market estimates and forecast, 2018-2032
      • 9.3.11.2 Market estimates and forecast, by type, 2018-2032
      • 9.3.11.3 Market estimates and forecast, by battery capacity, 2018-2032
      • 9.3.11.4 Market estimates and forecast, by seating capacity, 2018-2032
      • 9.3.11.5 Market estimates and forecast, by application, 2018-2032
  • 9.4 Asia Pacific
    • 9.4.1 Market estimates and forecast, 2018-2032
    • 9.4.2 Market estimates and forecast, by type, 2018-2032
    • 9.4.3 Market estimates and forecast, by battery capacity, 2018-2032
    • 9.4.4 Market estimates and forecast, by seating capacity, 2018-2032
    • 9.4.5 Market estimates and forecast, by application, 2018-2032
    • 9.4.6 China
      • 9.4.6.1 Market estimates and forecast, 2018-2032
      • 9.4.6.2 Market estimates and forecast, by type, 2018-2032
      • 9.4.6.3 Market estimates and forecast, by battery capacity, 2018-2032
      • 9.4.6.4 Market estimates and forecast, by seating capacity, 2018-2032
      • 9.4.6.5 Market estimates and forecast, by application, 2018-2032
    • 9.4.7 India
      • 9.4.7.1 Market estimates and forecast, 2018-2032
      • 9.4.7.2 Market estimates and forecast, by type, 2018-2032
      • 9.4.7.3 Market estimates and forecast, by battery capacity, 2018-2032
      • 9.4.7.4 Market estimates and forecast, by seating capacity, 2018-2032
      • 9.4.7.5 Market estimates and forecast, by application, 2018-2032
    • 9.4.8 Japan
      • 9.4.8.1 Market estimates and forecast, 2018-2032
      • 9.4.8.2 Market estimates and forecast, by type, 2018-2032
      • 9.4.8.3 Market estimates and forecast, by battery capacity, 2018-2032
      • 9.4.8.4 Market estimates and forecast, by seating capacity, 2018-2032
      • 9.4.8.5 Market estimates and forecast, by application, 2018-2032
    • 9.4.9 South Korea
      • 9.4.9.1 Market estimates and forecast, 2018-2032
      • 9.4.9.2 Market estimates and forecast, by type, 2018-2032
      • 9.4.9.3 Market estimates and forecast, by battery capacity, 2018-2032
      • 9.4.9.4 Market estimates and forecast, by seating capacity, 2018-2032
      • 9.4.9.5 Market estimates and forecast, by application, 2018-2032
  • 9.5 Latin America
    • 9.5.1 Market estimates and forecast, 2018-2032
    • 9.5.2 Market estimates and forecast, by type, 2018-2032
    • 9.5.3 Market estimates and forecast, by battery capacity, 2018-2032
    • 9.5.4 Market estimates and forecast, by seating capacity, 2018-2032
    • 9.5.5 Market estimates and forecast, by application, 2018-2032
    • 9.5.6 Brazil
      • 9.5.6.1 Market estimates and forecast, 2018-2032
      • 9.5.6.2 Market estimates and forecast, by type, 2018-2032
      • 9.5.6.3 Market estimates and forecast, by battery capacity, 2018-2032
      • 9.5.6.4 Market estimates and forecast, by seating capacity, 2018-2032
      • 9.5.6.5 Market estimates and forecast, by application, 2018-2032
    • 9.5.7 Mexico
      • 9.5.7.1 Market estimates and forecast, 2018-2032
      • 9.5.7.2 Market estimates and forecast, by type, 2018-2032
      • 9.5.7.3 Market estimates and forecast, by battery capacity, 2018-2032
      • 9.5.7.4 Market estimates and forecast, by seating capacity, 2018-2032
      • 9.5.7.5 Market estimates and forecast, by application, 2018-2032
    • 9.5.8 Argentina
      • 9.5.8.1 Market estimates and forecast, 2018-2032
      • 9.5.8.2 Market estimates and forecast, by type, 2018-2032
      • 9.5.8.3 Market estimates and forecast, by battery capacity, 2018-2032
      • 9.5.8.4 Market estimates and forecast, by seating capacity, 2018-2032
      • 9.5.8.5 Market estimates and forecast, by application, 2018-2032
    • 9.5.9 Chile
      • 9.5.9.1 Market estimates and forecast, 2018-2032
      • 9.5.9.2 Market estimates and forecast, by type, 2018-2032
      • 9.5.9.3 Market estimates and forecast, by battery capacity, 2018-2032
      • 9.5.9.4 Market estimates and forecast, by seating capacity, 2018-2032
      • 9.5.9.5 Market estimates and forecast, by application, 2018-2032
  • 9.6 MEA
    • 9.6.1 Market estimates and forecast, 2018-2032
    • 9.6.2 Market estimates and forecast, by type, 2018-2032
    • 9.6.3 Market estimates and forecast, by battery capacity, 2018-2032
    • 9.6.4 Market estimates and forecast, by seating capacity, 2018-2032
    • 9.6.5 Market estimates and forecast, by application, 2018-2032
    • 9.6.6 UAE
      • 9.6.6.1 Market estimates and forecast, 2018-2032
      • 9.6.6.2 Market estimates and forecast, by type, 2018-2032
      • 9.6.6.3 Market estimates and forecast, by battery capacity, 2018-2032
      • 9.6.6.4 Market estimates and forecast, by seating capacity, 2018-2032
      • 9.6.6.5 Market estimates and forecast, by application, 2018-2032
    • 9.6.7 Saudi Arabia
      • 9.6.7.1 Market estimates and forecast, 2018-2032
      • 9.6.7.2 Market estimates and forecast, by type, 2018-2032
      • 9.6.7.3 Market estimates and forecast, by battery capacity, 2018-2032
      • 9.6.7.4 Market estimates and forecast, by seating capacity, 2018-2032
      • 9.6.7.5 Market estimates and forecast, by application, 2018-2032
    • 9.6.8 South Africa
      • 9.6.8.1 Market estimates and forecast, 2018-2032
      • 9.6.8.2 Market estimates and forecast, by type, 2018-2032
      • 9.6.8.3 Market estimates and forecast, by battery capacity, 2018-2032
      • 9.6.8.4 Market estimates and forecast, by seating capacity, 2018-2032
      • 9.6.8.5 Market estimates and forecast, by application, 2018-2032

Chapter 10 Company Profiles

  • 10.1 Anhui Ankai Automobile Co., Ltd.
    • 10.1.1 Business Overview
    • 10.1.2 Financial Data
    • 10.1.3 Product Landscape
    • 10.1.4 Strategic Outlook
    • 10.1.5 SWOT Analysis
  • 10.2 Beiqi Foton Motor Co., Ltd.
    • 10.2.1 Business Overview
    • 10.2.2 Financial Data
    • 10.2.3 Product Landscape
    • 10.2.4 Strategic Outlook
    • 10.2.5 SWOT Analysis
  • 10.3 BYD Co. Ltd.
    • 10.3.1 Business Overview
    • 10.3.2 Financial Data
    • 10.3.3 Product Landscape
    • 10.3.4 Strategic Outlook
    • 10.3.5 SWOT Analysis
  • 10.4 Daimler AG
    • 10.4.1 Business Overview
    • 10.4.2 Financial Data
    • 10.4.3 Product Landscape
    • 10.4.4 Strategic Outlook
    • 10.4.5 SWOT Analysis
  • 10.5 Ebusco
    • 10.5.1 Business Overview
    • 10.5.2 Financial Data
    • 10.5.3 Product Landscape
    • 10.5.4 Strategic Outlook
    • 10.5.5 SWOT Analysis
  • 10.6 Irizar Group
    • 10.6.1 Business Overview
    • 10.6.2 Financial Data
    • 10.6.3 Product Landscape
    • 10.6.4 Strategic Outlook
    • 10.6.5 SWOT Analysis
  • 10.7 IVECO S.p.A.
    • 10.7.1 Business Overview
    • 10.7.2 Financial Data
    • 10.7.3 Product Landscape
    • 10.7.4 Strategic Outlook
    • 10.7.5 SWOT Analysis
  • 10.8 King Long United Automotive Industry Co., Ltd.
    • 10.8.1 Business Overview
    • 10.8.2 Financial Data
    • 10.8.3 Product Landscape
    • 10.8.4 Strategic Outlook
    • 10.8.5 SWOT Analysis
  • 10.9 MAN BUS
    • 10.9.1 Business Overview
    • 10.9.2 Financial Data
    • 10.9.3 Product Landscape
    • 10.9.4 Strategic Outlook
    • 10.9.5 SWOT Analysis
  • 10.10 NFI Group, Inc.
    • 10.10.1 Business Overview
    • 10.10.2 Financial Data
    • 10.10.3 Product Landscape
    • 10.10.4 Strategic Outlook
    • 10.10.5 SWOT Analysis
  • 10.11 Proterra
    • 10.11.1 Business Overview
    • 10.11.2 Financial Data
    • 10.11.3 Product Landscape
    • 10.11.4 Strategic Outlook
    • 10.11.5 SWOT Analysis
  • 10.12 Scania AB
    • 10.12.1 Business Overview
    • 10.12.2 Financial Data
    • 10.12.3 Product Landscape
    • 10.12.4 Strategic Outlook
    • 10.12.5 SWOT Analysis
  • 10.13 Solaris Bus & Couch
    • 10.13.1 Business Overview
    • 10.13.2 Financial Data
    • 10.13.3 Product Landscape
    • 10.13.4 Strategic Outlook
    • 10.13.5 SWOT Analysis
  • 10.14 TATA motors
    • 10.14.1 Business Overview
    • 10.14.2 Financial Data
    • 10.14.3 Product Landscape
    • 10.14.4 Strategic Outlook
    • 10.14.5 SWOT Analysis
  • 10.15 VDL Bus & Coach
    • 10.15.1 Business Overview
    • 10.15.2 Financial Data
    • 10.15.3 Product Landscape
    • 10.15.4 Strategic Outlook
    • 10.15.5 SWOT Analysis
  • 10.16 Volvo
    • 10.16.1 Business Overview
    • 10.16.2 Financial Data
    • 10.16.3 Product Landscape
    • 10.16.4 Strategic Outlook
    • 10.16.5 SWOT Analysis
  • 10.17 Xiamen Golden Dragon Bus Co. Ltd
    • 10.17.1 Business Overview
    • 10.17.2 Financial Data
    • 10.17.3 Product Landscape
    • 10.17.4 Strategic Outlook
    • 10.17.5 SWOT Analysis
  • 10.18 Zhengzhou Yutong Bus Co., Ltd.
    • 10.18.1 Business Overview
    • 10.18.2 Financial Data
    • 10.18.3 Product Landscape
    • 10.18.4 Strategic Outlook
    • 10.18.5 SWOT Analysis
  • 10.19 Zhongtong Bus Co. Ltd.
    • 10.19.1 Business Overview
    • 10.19.2 Financial Data
    • 10.19.3 Product Landscape
    • 10.19.4 Strategic Outlook
    • 10.19.5 SWOT Analysis

Data Tables

  • TABLE 1 Revenue mapping, by company, 2022
  • TABLE 2 Electric bus product-level ASP, by country, 2022 (USD)
  • TABLE 3 Sources, by region
  • TABLE 4 Electric bus industry 360º synopsis, 2018-2032
  • TABLE 5 Electric bus market, 2018-2022 (USD Million)
  • TABLE 6 Electric bus market, 2023-2032 (USD Million)
  • TABLE 7 Electric bus market, 2018-2022 (Units)
  • TABLE 8 Electric bus market, 2023-2032 (Units)
  • TABLE 9 Total Addressable Market (TAM), 2023-2032 (USD Billion)
  • TABLE 10 Electric bus market, by region, 2018-2022 (USD Million)
  • TABLE 11 Electric bus market, by region, 2023-2032 (USD Million)
  • TABLE 12 Electric bus market, by region, 2018-2022 (Units)
  • TABLE 13 Electric bus market, by region, 2023-2032 (Units)
  • TABLE 14 Electric bus market, by type, 2018-2022 (USD Million)
  • TABLE 15 Electric bus market, by type, 2023-2032 (USD Million)
  • TABLE 16 Electric bus market, by type, 2018-2022 (Units)
  • TABLE 17 Electric bus market, by type, 2023-2032 (Units)
  • TABLE 18 Electric bus market, by battery capacity, 2018-2022 (USD Million)
  • TABLE 19 Electric bus market, by battery capacity, 2023-2032 (USD Million)
  • TABLE 20 Electric bus market, by battery capacity, 2018-2022 (Units)
  • TABLE 21 Electric bus market, by battery capacity, 2023-2032 (Units)
  • TABLE 22 Electric bus market, by seating capacity, 2018-2022 (USD Million)
  • TABLE 23 Electric bus market, by seating capacity, 2023-2032 (USD Million)
  • TABLE 24 Electric bus market, by seating capacity, 2018-2022 (Units)
  • TABLE 25 Electric bus market, by seating capacity, 2023-2032 (Units)
  • TABLE 26 Electric bus market, by application, 2018-2022 (USD Million)
  • TABLE 27 Electric bus market, by application, 2023-2032 (USD Million)
  • TABLE 28 Electric bus market, by application, 2018-2022 (Units)
  • TABLE 29 Electric bus market, by application, 2023-2032 (Units)
  • TABLE 30 Covid-19 impact on North America electric bus market
  • TABLE 31 Covid-19 impact on Europe electric bus market
  • TABLE 32 Covid-19 impact on Asia Pacific electric bus market
  • TABLE 33 Covid-19 impact on Latin America electric bus market
  • TABLE 34 Covid-19 impact on MEA electric bus market
  • TABLE 35 Vendor matrix
  • TABLE 36 Patent analysis
  • TABLE 37 Growth potential analysis, 2022
  • TABLE 38 Industry impact forces
  • TABLE 39 Competitive analysis of major market players, 2022
  • TABLE 40 All electric market estimates and forecast, 2018- 2022 (USD Million)
  • TABLE 41 All electric market estimates and forecast, 2023- 2032 (USD Million)
  • TABLE 42 All electric market estimates and forecast, 2018- 2022 (Units)
  • TABLE 43 All electric market estimates and forecast, 2023- 2032 (Units)
  • TABLE 44 PHEV market estimates and forecast, 2018- 2022 (USD Million)
  • TABLE 45 PHEV market estimates and forecast, 2023- 2032 (USD Million)
  • TABLE 46 PHEV market estimates and forecast, 2018- 2022 (Units)
  • TABLE 47 PHEV market estimates and forecast, 2023- 2032 (Units)
  • TABLE 48 FCEV market estimates and forecast, 2018- 2022 (USD Million)
  • TABLE 49 FCEV market estimates and forecast, 2023- 2032 (USD Million)
  • TABLE 50 FCEV market estimates and forecast, 2018- 2022 (Units)
  • TABLE 51 FCEV market estimates and forecast, 2023- 2032 (Units)
  • TABLE 52 Below 100 kWh market estimates and forecast, 2018- 2022 (USD Million)
  • TABLE 53 Below 100 kWh market estimates and forecast, 2023- 2032 (USD Million)
  • TABLE 54 Below 100 kWh market estimates and forecast, 2018- 2022 (Units)
  • TABLE 55 Below 100 kWh market estimates and forecast, 2023- 2032 (Units)
  • TABLE 56 100-300 kWh market estimates and forecast, 2018- 2022 (USD Million)
  • TABLE 57 100-300 kWh market estimates and forecast, 2023- 2032 (USD Million)
  • TABLE 58 100-300 kWh market estimates and forecast, 2018- 2022 (Units)
  • TABLE 59 100-300 kWh market estimates and forecast, 2023- 2032 (Units)
  • TABLE 60 Above 300 kWh market estimates and forecast, 2018- 2022 (USD Million)
  • TABLE 61 Above 300 kWh market estimates and forecast, 2023- 2032 (USD Million)
  • TABLE 62 Above 300 kWh market estimates and forecast, 2018- 2022 (Units)
  • TABLE 63 Above 300 kWh market estimates and forecast, 2023- 2032 (Units)
  • TABLE 64 Below 40 seats market estimates and forecast, 2018- 2022 (USD Million)
  • TABLE 65 Below 40 seats market estimates and forecast, 2023- 2032 (USD Million)
  • TABLE 66 Below 40 seats market estimates and forecast, 2018- 2022 (Units)
  • TABLE 67 Below 40 seats market estimates and forecast, 2023- 2032 (Units)
  • TABLE 68 40-70 seats market estimates and forecast, 2018- 2022 (USD Million)
  • TABLE 69 40-70 seats market estimates and forecast, 2023- 2032 (USD Million)
  • TABLE 70 40-70 seats market estimates and forecast, 2018- 2022 (Units)
  • TABLE 71 40-70 seats market estimates and forecast, 2023- 2032 (Units)
  • TABLE 72 Above 70 seats market estimates and forecast, 2018- 2022 (USD Million)
  • TABLE 73 Above 70 seats market estimates and forecast, 2023- 2032 (USD Million)
  • TABLE 74 Above 70 seats market estimates and forecast, 2018- 2022 (Units)
  • TABLE 75 Above 70 seats market estimates and forecast, 2023- 2032 (Units)
  • TABLE 76 Intercity market estimates and forecast, 2018- 2022 (USD Million)
  • TABLE 77 Intercity market estimates and forecast, 2023- 2032 (USD Million)
  • TABLE 78 Intercity market estimates and forecast, 2018- 2022 (Units)
  • TABLE 79 Intercity market estimates and forecast, 2023- 2032 (Units)
  • TABLE 80 Intracity market estimates and forecast, 2018- 2022 (USD Million)
  • TABLE 81 Intracity market estimates and forecast, 2023- 2032 (USD Million)
  • TABLE 82 Intracity market estimates and forecast, 2018- 2022 (Units)
  • TABLE 83 Intracity market estimates and forecast, 2023- 2032 (Units)
  • TABLE 84 North America Electric bus market, by type, 2018-2022 (USD Million)
  • TABLE 85 North America Electric bus market, by type, 2023-2032 (USD Million)
  • TABLE 86 North America Electric bus market, by type, 2018-2022 (Units)
  • TABLE 87 North America Electric bus market, by type, 2023-2032 (Units)
  • TABLE 88 North America Electric bus market, by battery capacity, 2018-2022 (USD Million)
  • TABLE 89 North America Electric bus market, by battery capacity, 2023-2032 (USD Million)
  • TABLE 90 North America Electric bus market, by battery capacity, 2018-2022 (Units)
  • TABLE 91 North America Electric bus market, by battery capacity, 2023-2032 (Units)
  • TABLE 92 North America Electric bus market, by seating capacity, 2018-2022 (USD Million)
  • TABLE 93 North America Electric bus market, by seating capacity, 2023-2032 (USD Million)
  • TABLE 94 North America Electric bus market, by seating capacity, 2018-2022 (Units)
  • TABLE 95 North America Electric bus market, by seating capacity, 2023-2032 (Units)
  • TABLE 96 North America Electric bus market, by application, 2018-2022 (USD Million)
  • TABLE 97 North America Electric bus market, by application, 2023-2032 (USD Million)
  • TABLE 98 North America Electric bus market, by application, 2018-2022 (Units)
  • TABLE 99 North America Electric bus market, by application, 2023-2032 (Units)
  • TABLE 100 U.S. Electric bus market, by type, 2018-2022 (USD Million)
  • TABLE 101 U.S. Electric bus market, by type, 2023-2032 (USD Million)
  • TABLE 102 U.S. Electric bus market, by type, 2018-2022 (Units)
  • TABLE 103 U.S. Electric bus market, by type, 2023-2032 (Units)
  • TABLE 104 U.S. Electric bus market, by battery capacity, 2018-2022 (USD Million)
  • TABLE 105 U.S. Electric bus market, by battery capacity, 2023-2032 (USD Million)
  • TABLE 106 U.S. Electric bus market, by battery capacity, 2018-2022 (Units)
  • TABLE 107 U.S. Electric bus market, by battery capacity, 2023-2032 (Units)
  • TABLE 108 U.S. Electric bus market, by seating capacity, 2018-2022 (USD Million)
  • TABLE 109 U.S. Electric bus market, by seating capacity, 2023-2032 (USD Million)
  • TABLE 110 U.S. Electric bus market, by seating capacity, 2018-2022 (Units)
  • TABLE 111 U.S. Electric bus market, by seating capacity, 2023-2032 (Units)
  • TABLE 112 U.S. Electric bus market, by application, 2018-2022 (USD Million)
  • TABLE 113 U.S. Electric bus market, by application, 2023-2032 (USD Million)
  • TABLE 114 U.S. Electric bus market, by application, 2018-2022 (Units)
  • TABLE 115 U.S. Electric bus market, by application, 2023-2032 (Units)
  • TABLE 116 Canada Electric bus market, by type, 2018-2022 (USD Million)
  • TABLE 117 Canada Electric bus market, by type, 2023-2032 (USD Million)
  • TABLE 118 Canada Electric bus market, by type, 2018-2022 (Units)
  • TABLE 119 Canada Electric bus market, by type, 2023-2032 (Units)
  • TABLE 120 Canada Electric bus market, by battery capacity, 2018-2022 (USD Million)
  • TABLE 121 Canada Electric bus market, by battery capacity, 2023-2032 (USD Million)
  • TABLE 122 Canada Electric bus market, by battery capacity, 2018-2022 (Units)
  • TABLE 123 Canada Electric bus market, by battery capacity, 2023-2032 (Units)
  • TABLE 124 Canada Electric bus market, by seating capacity, 2018-2022 (USD Million)
  • TABLE 125 Canada Electric bus market, by seating capacity, 2023-2032 (USD Million)
  • TABLE 126 Canada Electric bus market, by seating capacity, 2018-2022 (Units)
  • TABLE 127 Canada Electric bus market, by seating capacity, 2023-2032 (Units)
  • TABLE 128 Canada Electric bus market, by application, 2018-2022 (USD Million)
  • TABLE 129 Canada Electric bus market, by application, 2023-2032 (USD Million)
  • TABLE 130 Canada Electric bus market, by application, 2018-2022 (Units)
  • TABLE 131 Canada Electric bus market, by application, 2023-2032 (Units)
  • TABLE 132 Europe Electric bus market, by type, 2018-2022 (USD Million)
  • TABLE 133 Europe Electric bus market, by type, 2023-2032 (USD Million)
  • TABLE 134 Europe Electric bus market, by type, 2018-2022 (Units)
  • TABLE 135 Europe Electric bus market, by type, 2023-2032 (Units)
  • TABLE 136 Europe Electric bus market, by battery capacity, 2018-2022 (USD Million)
  • TABLE 137 Europe Electric bus market, by battery capacity, 2023-2032 (USD Million)
  • TABLE 138 Europe Electric bus market, by battery capacity, 2018-2022 (Units)
  • TABLE 139 Europe Electric bus market, by battery capacity, 2023-2032 (Units)
  • TABLE 140 Europe Electric bus market, by seating capacity, 2018-2022 (USD Million)
  • TABLE 141 Europe Electric bus market, by seating capacity, 2023-2032 (USD Million)
  • TABLE 142 Europe Electric bus market, by seating capacity, 2018-2022 (Units)
  • TABLE 143 Europe Electric bus market, by seating capacity, 2023-2032 (Units)
  • TABLE 144 Europe Electric bus market, by application, 2018-2022 (USD Million)
  • TABLE 145 Europe Electric bus market, by application, 2023-2032 (USD Million)
  • TABLE 146 Europe Electric bus market, by application, 2018-2022 (Units)
  • TABLE 147 Europe Electric bus market, by application, 2023-2032 (Units)
  • TABLE 148 UK Electric bus market, by type, 2018-2022 (USD Million)
  • TABLE 149 UK Electric bus market, by type, 2023-2032 (USD Million)
  • TABLE 150 UK Electric bus market, by type, 2018-2022 (Units)
  • TABLE 151 UK Electric bus market, by type, 2023-2032 (Units)
  • TABLE 152 UK Electric bus market, by battery capacity, 2018-2022 (USD Million)
  • TABLE 153 UK Electric bus market, by battery capacity, 2023-2032 (USD Million)
  • TABLE 154 UK Electric bus market, by battery capacity, 2018-2022 (Units)
  • TABLE 155 UK Electric bus market, by battery capacity, 2023-2032 (Units)
  • TABLE 156 UK Electric bus market, by seating capacity, 2018-2022 (USD Million)
  • TABLE 157 UK Electric bus market, by seating capacity, 2023-2032 (USD Million)
  • TABLE 158 UK Electric bus market, by seating capacity, 2018-2022 (Units)
  • TABLE 159 UK Electric bus market, by seating capacity, 2023-2032 (Units)
  • TABLE 160 UK Electric bus market, by application, 2018-2022 (USD Million)
  • TABLE 161 UK Electric bus market, by application, 2023-2032 (USD Million)
  • TABLE 162 UK Electric bus market, by application, 2018-2022 (Units)
  • TABLE 163 UK Electric bus market, by application, 2023-2032 (Units)
  • TABLE 164 Germany Electric bus market, by type, 2018-2022 (USD Million)
  • TABLE 165 Germany Electric bus market, by type, 2023-2032 (USD Million)
  • TABLE 166 Germany Electric bus market, by type, 2018-2022 (Units)
  • TABLE 167 Germany Electric bus market, by type, 2023-2032 (Units)
  • TABLE 168 Germany Electric bus market, by battery capacity, 2018-2022 (USD Million)
  • TABLE 169 Germany Electric bus market, by battery capacity, 2023-2032 (USD Million)
  • TABLE 170 Germany Electric bus market, by battery capacity, 2018-2022 (Units)
  • TABLE 171 Germany Electric bus market, by battery capacity, 2023-2032 (Units)
  • TABLE 172 Germany Electric bus market, by seating capacity, 2018-2022 (USD Million)
  • TABLE 173 Germany Electric bus market, by seating capacity, 2023-2032 (USD Million)
  • TABLE 174 Germany Electric bus market, by seating capacity, 2018-2022 (Units)
  • TABLE 175 Germany Electric bus market, by seating capacity, 2023-2032 (Units)
  • TABLE 176 Germany Electric bus market, by application, 2018-2022 (USD Million)
  • TABLE 177 Germany Electric bus market, by application, 2023-2032 (USD Million)
  • TABLE 178 Germany Electric bus market, by application, 2018-2022 (Units)
  • TABLE 179 Germany Electric bus market, by application, 2023-2032 (Units)
  • TABLE 180 France Electric bus market, by type, 2018-2022 (USD Million)
  • TABLE 181 France Electric bus market, by type, 2023-2032 (USD Million)
  • TABLE 182 France Electric bus market, by type, 2018-2022 (Units)
  • TABLE 183 France Electric bus market, by type, 2023-2032 (Units)
  • TABLE 184 France Electric bus market, by battery capacity, 2018-2022 (USD Million)
  • TABLE 185 France Electric bus market, by battery capacity, 2023-2032 (USD Million)
  • TABLE 186 France Electric bus market, by battery capacity, 2018-2022 (Units)
  • TABLE 187 France Electric bus market, by battery capacity, 2023-2032 (Units)
  • TABLE 188 France Electric bus market, by seating capacity, 2018-2022 (USD Million)
  • TABLE 189 France Electric bus market, by seating capacity, 2023-2032 (USD Million)
  • TABLE 190 France Electric bus market, by seating capacity, 2018-2022 (Units)
  • TABLE 191 France Electric bus market, by seating capacity, 2023-2032 (Units)
  • TABLE 192 France Electric bus market, by application, 2018-2022 (USD Million)
  • TABLE 193 France Electric bus market, by application, 2023-2032 (USD Million)
  • TABLE 194 France Electric bus market, by application, 2018-2022 (Units)
  • TABLE 195 France Electric bus market, by application, 2023-2032 (Units)
  • TABLE 196 Italy Electric bus market, by type, 2018-2022 (USD Million)
  • TABLE 197 Italy Electric bus market, by type, 2023-2032 (USD Million)
  • TABLE 198 Italy Electric bus market, by type, 2018-2022 (Units)
  • TABLE 199 Italy Electric bus market, by type, 2023-2032 (Units)
  • TABLE 200 Italy Electric bus market, by battery capacity, 2018-2022 (USD Million)
  • TABLE 201 Italy Electric bus market, by battery capacity, 2023-2032 (USD Million)
  • TABLE 202 Italy Electric bus market, by battery capacity, 2018-2022 (Units)
  • TABLE 203 Italy Electric bus market, by battery capacity, 2023-2032 (Units)
  • TABLE 204 Italy Electric bus market, by seating capacity, 2018-2022 (USD Million)
  • TABLE 205 Italy Electric bus market, by seating capacity, 2023-2032 (USD Million)
  • TABLE 206 Italy Electric bus market, by seating capacity, 2018-2022 (Units)
  • TABLE 207 Italy Electric bus market, by seating capacity, 2023-2032 (Units)
  • TABLE 208 Italy Electric bus market, by application, 2018-2022 (USD Million)
  • TABLE 209 Italy Electric bus market, by application, 2023-2032 (USD Million)
  • TABLE 210 Italy Electric bus market, by application, 2018-2022 (Units)
  • TABLE 211 Italy Electric bus market, by application, 2023-2032 (Units)
  • TABLE 212 Russia Electric bus market, by type, 2018-2022 (USD Million)
  • TABLE 213 Russia Electric bus market, by type, 2023-2032 (USD Million)
  • TABLE 214 Russia Electric bus market, by type, 2018-2022 (Units)
  • TABLE 215 Russia Electric bus market, by type, 2023-2032 (Units)
  • TABLE 216 Russia Electric bus market, by battery capacity, 2018-2022 (USD Million)
  • TABLE 217 Russia Electric bus market, by battery capacity, 2023-2032 (USD Million)
  • TABLE 218 Russia Electric bus market, by battery capacity, 2018-2022 (Units)
  • TABLE 219 Russia Electric bus market, by battery capacity, 2023-2032 (Units)
  • TABLE 220 Russia Electric bus market, by seating capacity, 2018-2022 (USD Million)