
|
市場調査レポート
商品コード
1666941
フォトブースの市場機会、成長促進要因、産業動向分析、2025年~2034年予測Photo Booth Market Opportunity, Growth Drivers, Industry Trend Analysis, and Forecast 2025 - 2034 |
||||||
カスタマイズ可能
|
|||||||
| フォトブースの市場機会、成長促進要因、産業動向分析、2025年~2034年予測 |
|
出版日: 2024年12月27日
発行: Global Market Insights Inc.
ページ情報: 英文 180 Pages
納期: 2~3営業日
|

全表示
- 概要
- 目次
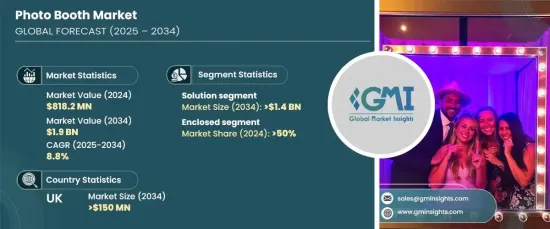
フォトブースの世界市場は、2024年に8億1,820万米ドルとなり、2025年から2034年にかけてCAGR8.8%で成長すると予測されています。
この成長の主な原動力の1つは、イベントでのインタラクティブでカスタマイズされた体験に対する需要の増加です。人々は結婚式、パーティー、企業イベントなどで思い出を残すユニークで楽しい方法を探しています。フォトブースは、背景や小道具をカスタマイズでき、すぐに写真をプリントアウトできるため、こうしたイベントで人気を集めています。
ソーシャルメディアもまた、この需要を促進する上で重要な役割を果たしています。ゲストは、InstagramやFacebookなどのプラットフォームで写真やビデオを即座に共有するのが大好きで、それがイベントに興奮を与え、話題を呼んでいます。カスタマイズとソーシャルメディア共有の組み合わせにより、フォトブースはイベント主催者の必需品となり、市場の成長をさらに後押ししています。
| 市場規模 | |
|---|---|
| 開始年 | 2024年 |
| 予測年 | 2025年~2034年 |
| 開始金額 | 8億1,820万米ドル |
| 予測金額 | 19億米ドル |
| CAGR | 8.8% |
すぐに写真を共有したいという欲求が高まっていることも重要な要因です。イベントの参加者は、思い出の写真を撮影し、すぐに友人やフォロワーとオンラインで共有したいと考えています。インスタントプリントやデジタル共有機能など、フォトブースはこの需要に完璧に応えています。このようなソーシャルメディアとの統合は、イベント体験を向上させるだけでなく、より多くの人々がその瞬間を素早く撮影し、共有することを求めているため、フォトブースの人気は高まり続けています。
市場セグメンテーションでは、フォトブース産業はソリューションとサービスに分けられます。2024年にはソリューション部門が市場シェアの75%以上を占め、2034年には14億米ドルを超えると予想されています。このセグメントは、消費者のニーズに合わせてカスタマイズされたハードウェアとソフトウェアの両方を含む、包括的な提供により繁栄しています。デジタル共有やインスタントプリントのようなカスタマイズ可能な機能を提供するソリューションは、ユーザー体験を大幅に向上させます。さらに、統合ソフトウェアはブースの管理とカスタマイズを支援し、イベントでの運用を容易にします。
同市場はタイプ別にも分かれており、オープン型と密閉型の2つに大別されます。密閉型ブースは市場シェアの50%以上を占めています。プライバシーが確保され、快適に撮影できるため、人気が高いです。よりパーソナルな体験ができるため、プライバシーと高品質な写真を求めるイベントには特に魅力的です。また、コンパクトで持ち運びしやすいデザインのため、さまざまなイベント会場で簡単に持ち運び、設置することができます。
英国のフォトブース市場は、2024年には世界市場シェアの20%を占め、2034年には1億5,000万米ドルを超えると予想されています。英国におけるフォトブースの需要は、結婚式、企業行事、パーティーを中心とした同国の強いイベント文化によって牽引されています。同国のテクノロジーの進歩、強力なインフラ、ソーシャルメディアの動向も、フォトブースの人気拡大に寄与しています。
目次
第1章 調査手法と調査範囲
- 調査デザイン
- 調査アプローチ
- データ収集方法
- 基本推定と計算
- 基準年の算出
- 市場推計の主要動向
- 予測モデル
- 一次調査と検証
- 一次ソース
- データマイニングソース
- 市場定義
第2章 エグゼクティブサマリー
第3章 業界洞察
- 業界エコシステム分析
- サプライヤーの状況
- フォトブース部品メーカー
- アフターマーケットプロバイダー
- 流通業者
- 最終用途
- 利益率分析
- 価格分析
- 特許情勢
- コスト内訳
- 技術とイノベーションの展望
- 主要ニュース・イニシアチブ
- 規制状況
- 影響要因
- 成長促進要因
- インタラクティブでパーソナライズされたイベント体験への需要の高まり
- ソーシャルメディアの普及と写真の即時共有への欲求の高まり
- 高画質カメラやカスタマイズ可能な機能など、技術の進歩
- 結婚式、パーティー、企業イベント、マーケティングキャンペーンにおけるフォトブースの人気上昇
- 業界の潜在的リスク・課題
- フォトブース機器の設置や維持にかかる初期投資コストの高さ
- 市場競争が激しく、新規参入者が地位を確立することが困難になっている
- 成長促進要因
- 成長可能性分析
- ポーター分析
- PESTEL分析
第4章 競合情勢
- イントロダクション
- 企業市場シェア分析
- 競合のポジショニングマトリックス
- 戦略展望マトリックス
第5章 市場推計・予測:コンポーネント別、2021年~2034年
- 主要動向
- ソリューション
- サービス
第6章 市場推計・予測:タイプ別、2021年~2034年
- 主要動向
- オープン型
- ミラーフォトブース
- グリーンスクリーンフォトブース
- 360フォトブース
- 密閉型
- 膨脹可能な写真ブース
- パスポートフォトブース
第7章 市場推計・予測:オペレーションモード別、2021年~2034年
- 主要動向
- 固定式
- モバイル/レンタル
第8章 市場推計・予測:用途別、2021年~2032年
- 主要動向
- ドキュメント写真
- エンターテインメント
- アミューズメントパーク
- ショッピングセンター
- 小売店
- イベント
- その他
第9章 市場推計・予測:地域別、2021年~2034年
- 主要動向
- 北米
- 米国
- カナダ
- 欧州
- 英国
- ドイツ
- フランス
- スペイン
- イタリア
- ロシア
- 北欧
- アジア太平洋
- 中国
- インド
- 日本
- 韓国
- ニュージーランド
- 東南アジア
- ラテンアメリカ
- ブラジル
- メキシコ
- アルゼンチン
- 中東・アフリカ
- UAE
- 南アフリカ
- サウジアラビア
第10章 企業プロファイル
- Breeze Systems
- Bubbly Booths
- Darkroom Booth
- DEDEM
- Face Place Photo Booths
- Foto Master
- Me-Group International
- MyBooth
- Open Air Photobooth
- PBC Photobooths
- Photo Booth International
- Photobooth Supply
- Photobooths.co.uk
- Picture Pod
- Pixster Photo Booths
- Simple Booth
- SnapShotz Photo Booths
- Studio Foto Immagine
- The Bosco
- The Original Selfie Booth
The Global Photo Booth Market was valued at USD 818.2 million in 2024 and is expected to grow at a CAGR of 8.8% from 2025 to 2034. One of the key drivers behind this growth is the increasing demand for interactive and customized experiences at events. People are looking for unique and fun ways to capture memories at weddings, parties, corporate events, and more. Photo booths, with their ability to offer personalized backdrops, props, and instant photo printouts, are becoming a popular feature at these events.
Social media also plays a significant role in driving this demand. Guests love to instantly share their photos and videos on platforms like Instagram and Facebook, which adds excitement to the event and creates buzz around it. The combination of customization and social media sharing has made photo booths a must-have for event organizers, further boosting the market's growth.
| Market Scope | |
|---|---|
| Start Year | 2024 |
| Forecast Year | 2025-2034 |
| Start Value | $818.2 Million |
| Forecast Value | $1.9 Billion |
| CAGR | 8.8% |
The increasing desire for immediate photo sharing is another important factor. Attendees at events want to capture and instantly share their memories with friends and followers online. With features like instant printing and digital sharing capabilities, photo booths perfectly meet this demand. This integration with social media not only enhances the event experience but also ensures that the popularity of photo booths continues to grow as more people look to capture and share moments quickly.
In terms of market segments, the photo booth industry is divided into solutions and services. The solution segment dominated in 2024, accounting for over 75% of the market share, and is expected to exceed USD 1.4 billion by 2034. This segment thrives due to its all-encompassing offerings, which include both hardware and software tailored to meet consumer needs. Solutions that offer customizable features, like digital sharing and instant prints, greatly enhance user experience. Moreover, integrated software helps manage and customize the booths, making them easier to operate at events.
The market is also divided by type, with two main categories: open and enclosed photo booths. The enclosed booth segment holds more than 50% of the market share. These booths are more popular due to their enhanced privacy and comfort features, which make users feel more at ease when taking photos. They offer a more personal experience, which is particularly appealing at events where guests want privacy and high-quality photos. Additionally, their compact and portable design allows them to be easily transported and set up at various event locations.
The photo booth market in the U.K. accounted for 20% of the global market share in 2024 and is expected to exceed USD 150 million by 2034. The demand for photo booths in the U.K. is driven by the country's strong event culture, with a particular focus on weddings, corporate functions, and parties. The country's advancements in technology, strong infrastructure, and social media trends also contribute to the growing popularity of photo booths.
Table of Contents
Chapter 1 Methodology & Scope
- 1.1 Research design
- 1.1.1 Research approach
- 1.1.2 Data collection methods
- 1.2 Base estimates and calculations
- 1.2.1 Base year calculation
- 1.2.2 Key trends for market estimates
- 1.3 Forecast model
- 1.4 Primary research & validation
- 1.4.1 Primary sources
- 1.4.2 Data mining sources
- 1.5 Market definitions
Chapter 2 Executive Summary
- 2.1 Industry 3600 synopsis, 2021 - 2034
Chapter 3 Industry Insights
- 3.1 Industry ecosystem analysis
- 3.2 Supplier landscape
- 3.2.1 Photo booth component manufacturers
- 3.2.2 Aftermarket providers
- 3.2.3 Distributors
- 3.2.4 End use
- 3.3 Profit margin analysis
- 3.4 Pricing analysis
- 3.5 Patent Landscape
- 3.6 Cost Breakdown
- 3.7 Technology & innovation landscape
- 3.8 Key news & initiatives
- 3.9 Regulatory landscape
- 3.10 Impact forces
- 3.10.1 Growth drivers
- 3.10.1.1 Growing demand for interactive and personalized event experiences
- 3.10.1.2 Increasing popularity of social media and the desire for instant sharing of photos
- 3.10.1.3 Technological advancements, such as high-quality cameras and customizable features
- 3.10.1.4 Rising popularity of photo booths in weddings, parties, corporate events, and marketing campaigns
- 3.10.2 Industry pitfalls & challenges
- 3.10.2.1 High initial investment costs for setting up and maintaining photobooth equipment
- 3.10.2.2 Intense competition in the market, making it difficult for new entrants to establish themselves
- 3.10.1 Growth drivers
- 3.11 Growth potential analysis
- 3.12 Porter’s analysis
- 3.13 PESTEL analysis
Chapter 4 Competitive Landscape, 2024
- 4.1 Introduction
- 4.2 Company market share analysis
- 4.3 Competitive positioning matrix
- 4.4 Strategic outlook matrix
Chapter 5 Market Estimates & Forecast, By Component, 2021 - 2034 ($Bn)
- 5.1 Key trends
- 5.2 Solution
- 5.3 Service
Chapter 6 Market Estimates & Forecast, By Type, 2021 - 2034 ($Bn)
- 6.1 Key trends
- 6.2 Open
- 6.2.1 Mirror photo booth
- 6.2.2 Green screen photo booth
- 6.2.3 360 photobooth
- 6.3 Enclosed
- 6.3.1 Inflatable photo booth
- 6.3.2 Passport photo booth
Chapter 7 Market Estimates & Forecast, By Mode of Operation, 2021 - 2034 ($Bn)
- 7.1 Key trends
- 7.2 Fixed
- 7.3 Mobile/Rental
Chapter 8 Market Estimates & Forecast, By Application, 2021 - 2032 ($Bn)
- 8.1 Key trends
- 8.2 Document photo
- 8.3 Entertainment
- 8.3.1 Amusement parks
- 8.3.2 Shopping centers
- 8.3.3 Retail outlets
- 8.3.4 Events
- 8.3.5 Others
Chapter 9 Market Estimates & Forecast, By Region, 2021 - 2034 ($Bn)
- 9.1 Key trends
- 9.2 North America
- 9.2.1 U.S.
- 9.2.2 Canada
- 9.3 Europe
- 9.3.1 UK
- 9.3.2 Germany
- 9.3.3 France
- 9.3.4 Spain
- 9.3.5 Italy
- 9.3.6 Russia
- 9.3.7 Nordics
- 9.4 Asia Pacific
- 9.4.1 China
- 9.4.2 India
- 9.4.3 Japan
- 9.4.4 South Korea
- 9.4.5 ANZ
- 9.4.6 Southeast Asia
- 9.5 Latin America
- 9.5.1 Brazil
- 9.5.2 Mexico
- 9.5.3 Argentina
- 9.6 MEA
- 9.6.1 UAE
- 9.6.2 South Africa
- 9.6.3 Saudi Arabia
Chapter 10 Company Profiles
- 10.1 Breeze Systems
- 10.2 Bubbly Booths
- 10.3 Darkroom Booth
- 10.4 DEDEM
- 10.5 Face Place Photo Booths
- 10.6 Foto Master
- 10.7 Me-Group International
- 10.8 MyBooth
- 10.9 Open Air Photobooth
- 10.10 PBC Photobooths
- 10.11 Photo Booth International
- 10.12 Photobooth Supply
- 10.13 Photobooths.co.uk
- 10.14 Picture Pod
- 10.15 Pixster Photo Booths
- 10.16 Simple Booth
- 10.17 SnapShotz Photo Booths
- 10.18 Studio Foto Immagine
- 10.19 The Bosco
- 10.20 The Original Selfie Booth
