|
|
市場調査レポート
商品コード
1871279
試験・検査・認証(TIC)サービス市場における機会、成長要因、業界動向分析、2025年~2034年の予測Testing, Inspection and Certification (TIC) Services Market Opportunity, Growth Drivers, Industry Trend Analysis, and Forecast 2025 - 2034 |
||||||
|
|||||||
カスタマイズ可能
|
|||||||

| 試験・検査・認証(TIC)サービス市場における機会、成長要因、業界動向分析、2025年~2034年の予測 |
|
出版日: 2025年10月30日
発行: Global Market Insights Inc.
ページ情報: 英文 220 Pages
納期: 2~3営業日
|

概要
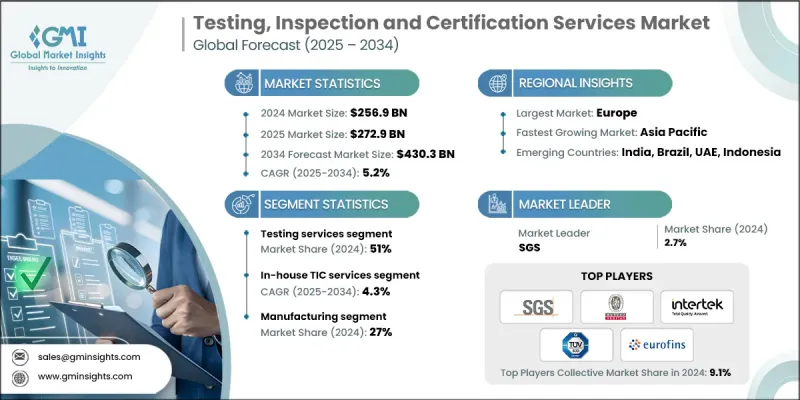
世界の試験・検査・認証(TIC)サービス市場は、2024年に2,569億米ドルと評価され、2034年までにCAGR5.2%で成長し、4,303億米ドルに達すると予測されております。
TICサービス市場は、製造業、エネルギー、建設、消費財など多様な産業において、製品の品質、安全性、コンプライアンスを確保する上で極めて重要な役割を果たしています。これらのサービスは、製造業者が自社製品が国内外の基準を満たしていることを検証し、グローバル市場に参入する前に一貫性、安全性、信頼性を保証するのに役立ちます。国際貿易が拡大する中、TICサービスはリスクの最小化、消費者信頼の維持、業務効率の向上に不可欠なものとなっています。特に自動車、医療、食品、電子機器などの分野における規制順守の重要性が高まる中、TICサービスへの安定した需要が継続的に生み出されています。世界中の政府機関や民間企業は、製品が厳しい品質、性能、環境規制を満たしていることを確認するために、これらのサービスに依存しています。国際貿易の複雑化と安全基準への期待の高まりにより、企業は独立したTICプロバイダーへの依存度をさらに高めており、これが世界的な市場成長をさらに強化しています。
| 市場範囲 | |
|---|---|
| 開始年 | 2024年 |
| 予測期間 | 2025年~2034年 |
| 開始時価値 | 2,569億米ドル |
| 予測金額 | 4,303億米ドル |
| CAGR | 5.2% |
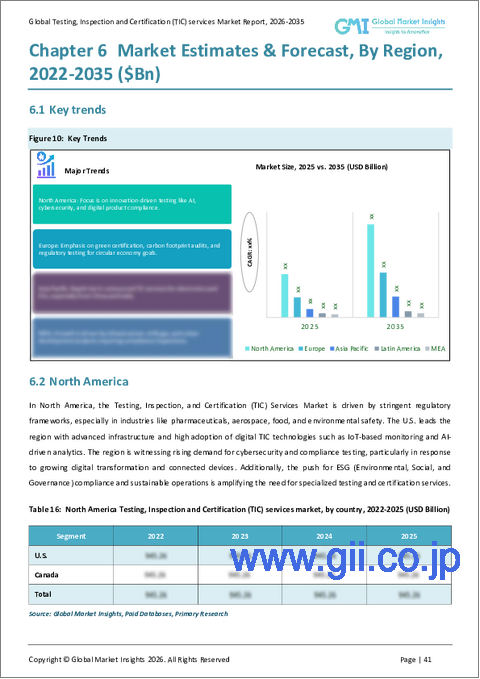
北米、欧州、アジア太平洋地域など、各地域における政府の規制により、第三者機関によるTICサービスの需要が加速しております。各国および地域の当局は、国内および輸出において、消費者の健康を守り、環境の安全を確保するため、一貫した製品試験および認証を要求しております。製造業者は、コンプライアンス評価を処理するため、認定を受けたTICサービスプロバイダーとの提携をますます進めており、これにより国際貿易基準を効率的に満たすことが可能となっております。独立した試験・認証は、製品が輸入規制や地域の技術要件に適合していることを証明し、企業がより迅速に市場参入を果たすとともに、高額なリコールや輸出拒否のリスクを低減するのに役立ちます。
試験サービス分野は2024年に51%のシェアを占めました。これらのサービスは、医療、製造、電子機器、消費財セクターで広く活用され、性能の正確性と安全性を確保しています。試験は、国内および国際基準への適合を確認する上で不可欠なステップであり続けています。一方、検査サービスは、建設や農業などの産業で広く採用され、市場投入前に製品の安全性、品質の一貫性、規制基準への適合性を検証します。
社内TICサービスセグメントは、2025年から2034年にかけてCAGR 4.3%で成長すると予測されています。多くの企業は、直接的な監督を維持し、専有情報を保護するため、TIC業務を社内で実施することを好みます。社内サービスは、より迅速な対応、品質保証に対する高度な管理、内部コンプライアンス体制との整合性も提供します。この手法に投資する組織は、試験研究所の設立、専門機器の導入、技術的専門知識の確保に資本を投入し、グローバル基準への準拠を維持しながら効率的かつ機密性の高いサービス提供を実現しています。
米国の試験・検査・認証(TIC)サービス市場は2024年に637億米ドルの規模に達しました。同国市場の成長は主に製造業によって牽引されており、生産基準の維持、規制順守、製品信頼性の確保においてTICサービスへの依存度が高いことが背景にあります。自動車、電子機器、機械などの重要産業を支える当業界の役割は、製品の完全性を維持し国際市場における競争力を持続させる上で極めて重要です。
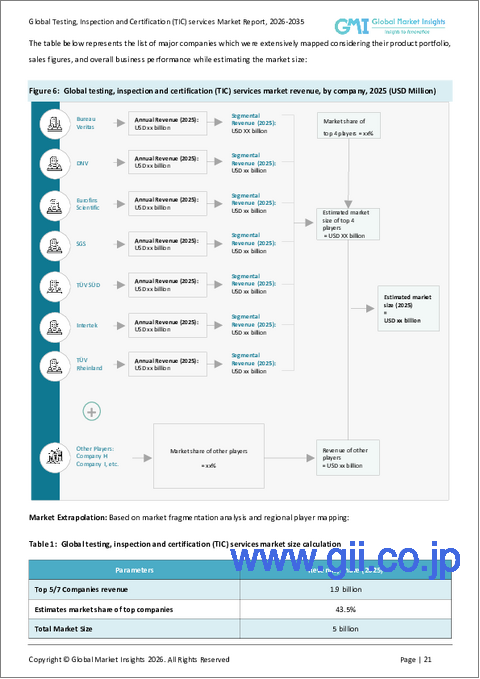
世界の試験・検査・認証(TIC)サービス市場で主要な企業には、TUV SUD、SGS、DEKRA、ユーロフィンズ、ビューローベリタス、BSI、DNV、TUV Rheinland、インターテック、ULソリューションズなどが挙げられます。TICサービス市場で事業を展開する企業は、サービスポートフォリオと地理的範囲を拡大するため、合併、買収、戦略的提携を通じてグローバルな存在感を強化しています。主要企業は、試験精度向上、納期短縮、効率化を図るため、自動化、デジタルプラットフォーム、AIベースの検査ツールに多額の投資を行っています。多くの企業が、強化される環境規制に対応し、持続可能性を重視した試験・コンプライアンスソリューションを導入しています。再生可能エネルギー、自動運転車、スマート製造といった新興分野における能力拡大も、重要な焦点となっています。
よくあるご質問
目次
第1章 調査手法
- 市場範囲と定義
- 調査設計
- 調査アプローチ
- データ収集方法
- データマイニングの情報源
- グローバル
- 地域別/国別
- 基本推定値と計算
- 基準年計算
- 市場推定における主要な動向
- 1次調査および検証
- 一次情報
- 予測
- 調査前提条件と制限事項
第2章 エグゼクティブサマリー
第3章 業界考察
- エコシステム分析
- サプライヤーの情勢
- 利益率分析
- コスト構造
- 各段階における付加価値
- バリューチェーンに影響を与える要因
- ディスラプション
- 業界への影響要因
- 促進要因
- 厳格な製品安全・品質規制の施行強化
- 新興経済国における工業化と製造業生産高の増加
- 認証済みで持続可能な製品に対する消費者の意識と需要の高まり
- デジタルおよび遠隔検査技術(AI、IoT、ブロックチェーン)の導入
- 業界の潜在的リスク&課題
- 複雑なテスト環境における高い運用コストとサービスコスト
- 地域間における認証基準の差異
- 市場機会
- 再生可能エネルギー、電気自動車、グリーンテクノロジー分野におけるTICサービスの拡大
- サイバーセキュリティおよびデジタルシステム認証に対する需要の高まり
- 促進要因
- 成長可能性分析
- 規制情勢
- 北米
- 欧州
- アジア太平洋
- ラテンアメリカ
- 中東・アフリカ
- ポーターの分析
- PESTEL分析
- 技術とイノベーションの情勢
- 現在の技術動向
- 新興技術
- 特許分析
- 持続可能性と環境面
- カーボンフットプリント評価
- 循環型経済の統合
- 電子廃棄物管理要件
- グリーン製造イニシアチブ
- 使用事例と応用事例
- ベストケースシナリオ
- 費用便益分析フレームワーク
- 社内対応と外部委託のTICサービス費用比較
- 総所有コスト(TCO)分析
- 市場投入までの時間への影響評価
- コンプライアンスリスク軽減の価値分析
- デジタルと従来型サービス提供のコストモデル比較
- 市場成熟度と技術導入状況の分析
- 地域別TIC市場成熟度評価
- 技術導入曲線と導入スケジュール
- デジタルトランスフォーメーション準備度指数
- 規制調和の進捗状況分析
- 業界ベンチマーク調査
- クライアント要件及び調達分析
- ベンダー選定基準及びベンチマーキングフレームワーク
- コンプライアンスコスト最適化戦略
- ROI分析とパフォーマンス指標
- リスク管理及び事業継続要件
- デジタル能力評価フレームワーク
- 品質保証及び認証要件
第4章 競合情勢
- イントロダクション
- 企業の市場シェア分析
- 北米
- 欧州
- アジア太平洋
- ラテンアメリカ
- 中東・アフリカ
- 主要市場企業の競合分析
- 競合ポジショニングマトリックス
- 戦略的展望マトリックス
- 主な発展
- 合併・買収
- 提携・協業
- 新製品の発売
- 事業拡大計画と資金調達
第5章 市場推計・予測:サービス別、2021年~2034年
- 主要動向
- 試験サービス
- 電磁両立性試験
- 電気安全および性能試験
- 機械・材料試験
- その他
- 検査サービス
- 出荷前検査および委託検査
- 産業用施設および設備の点検
- 建設およびインフラストラクチャー検査
- その他
- 認証サービス
- 製品認証
- マネジメントシステム認証
- 人材認証
- その他
- 校正サービス
- 計測器の校正
- 計量学および測定基準
- その他
- その他
第6章 市場推計・予測:提供元別、2021年~2034年
- 主要動向
- 社内TICサービス
- 内部試験および品質管理研究所
- 自社検査・認証部門
- 企業研究開発部門およびコンプライアンス試験センター
- その他
- 外部委託TICサービス
- 独立した第三者TICプロバイダー
- 契約ベースの試験所
- 外部検査機関および認証機関
- その他
第7章 市場推計・予測:最終用途別、2021年~2034年
- 主要動向
- 製造業
- 産業用機械・設備の試験
- 品質管理および工場監査
- サプライチェーンおよび部品の検証
- エネルギー・公益事業
- 再生可能エネルギーシステムの試験
- スマートグリッドおよびバッテリー認証
- 原子力発電所の安全検査
- 石油・ガス資産の健全性評価
- 食品・飲料
- 食品安全および衛生検査
- 包装および表示のコンプライアンス
- サプライチェーンのトレーサビリティと原産地検証
- 有機認証および持続可能性認証
- 自動車
- 電気自動車の試験および認証
- 自動運転車の検証
- コネクテッドカー向けサイバーセキュリティ試験
- 車両検査および型式認定
- 化学品
- 化学組成および純度試験
- 危険物認定
- 環境および規制順守監査
- 建設・インフラ
- 建築材料試験
- 構造健全性検査
- グリーンビルディングおよびサステナビリティ認証
- ヘルスケア・ライフサイエンス
- 生体適合性試験および滅菌試験
- 医薬品および臨床試験の検証
- 医療機器およびソフトウェアのバリデーション
- 航空宇宙・防衛産業
- 航空機部品の認証
- 防衛システムおよび軍事規格試験
- 宇宙システムの認定
- 消費財
- 電気機器の安全試験
- 玩具、繊維、化粧品認証
- 消費者保護と品質保証
- その他
第8章 市場推計・予測:地域別、2021年~2034年
- 主要動向
- 北米
- 米国
- カナダ
- 欧州
- ドイツ
- 英国
- フランス
- イタリア
- スペイン
- 北欧諸国
- ロシア
- アジア太平洋
- 中国
- インド
- 日本
- オーストラリア
- 韓国
- 東南アジア
- ラテンアメリカ
- ブラジル
- メキシコ
- アルゼンチン
- 中東・アフリカ
- 南アフリカ
- サウジアラビア
- アラブ首長国連邦
第9章 企業プロファイル
- 主要グローバル企業
- Bureau Veritas
- DEKRA
- DNV
- Eurofins Scientific
- Intertek
- SGS
- TUV Rheinland
- TUV SUD
- Regional Champions
- APAVE
- BSI
- Centre Testing International
- CCIC
- CSA
- Lloyd's Register
- SOCOTEC
- UL Solutions
- 新興企業・専門機関
- ALS
- Applus+Services
- Element Materials Technology
- Kiwa
- NSF International
- QIMA
- RINA

