|
|
市場調査レポート
商品コード
1536049
EVバッテリー再利用の市場規模:用途別、供給源別、地域別、展望・予測、2024年~2032年EV Battery Reuse Market Size - By Application (Energy Storage, EV Charging, Base Stations, Low Speed Vehicles), By Source (BEV, HEV & PHEV), Regional Outlook & Forecast, 2024 - 2032 |
||||||
|
|||||||
カスタマイズ可能
|
|||||||

| EVバッテリー再利用の市場規模:用途別、供給源別、地域別、展望・予測、2024年~2032年 |
|
出版日: 2024年06月26日
発行: Global Market Insights Inc.
ページ情報: 英文 110 Pages
納期: 2~3営業日
|

全表示
- 概要
- 目次
EVバッテリー再利用の市場規模は、電気自動車の発売の増加と急速な技術進歩により、2024年から2032年にかけてCAGR 46.6%で拡大すると予測されます。
より多くのEVが道路を走るようになり、エネルギー貯蔵やグリッド安定化などの二次用途にバッテリーを再利用する需要が高まっています。改善されたバッテリー管理システムや高度なリサイクルプロセスなどの技術も、バッテリー再利用の効果を高めています。例えば、Trumpfは2024年6月、産業規模のEVバッテリー・リサイクル用の革新的なレーザー技術を発表し、電気自動車バッテリーのより持続可能で効果的なリサイクル・プロセスをサポートするため、バッテリー材料回収の効率と精度を高めています。
用途別では、EVバッテリー再利用の市場価値は、エネルギー貯蔵能力を強化するための採用増加により、基地局セグメントから2024年から2032年にかけてかなりの割合で上昇すると推定されます。基地局には、EVバッテリーを再利用した蓄電システムが搭載されており、送電網の安定化とエネルギー供給の効率的な管理に役立っています。その後、継続的な技術革新により、基地局におけるリユースEVバッテリーの性能と統合が改善され、グリッドサポートとエネルギー管理においてより効果的なものとなっています。
HEVとPHEVの供給源セグメントからのEVバッテリー再利用産業は、バッテリーパックを再利用するための貴重な供給源の必要性が高まっているため、2032年まで大幅なCAGRで拡大すると予想されます。バッテリー管理とリサイクル技術の進歩により、HEVとPHEVからのリユースバッテリーの有効性が高まっています。この継続的な開発は、持続可能な電池ライフサイクルの実践を支援し、資源を最適化し、よりクリーンなエネルギーソリューションを促進するために、より効率的なエネルギー利用に貢献しています。
地域別では、北米のEVバッテリー再利用市場規模は、2024年から2032年にかけて拡大すると予測されます。経済的インセンティブは、バッテリーの再利用技術への投資と革新的ソリューションの開発を企業に促しています。このようなプロセスをより費用対効果が高く持続可能なものにするために、バッテリーのリサイクルと再利用に関する研究開発が活発化していることが、北米全域での業界成長の原動力となっています。
目次
第1章 調査手法と調査範囲
第2章 エグゼクティブサマリー
第3章 業界洞察
- エコシステム分析
- 規制状況
- 業界への影響要因
- 促進要因
- 業界の潜在的リスク&課題
- 成長ポテンシャル分析
- ポーター分析
- PESTEL分析
第4章 競合情勢
- 戦略ダッシュボード
- イノベーションとテクノロジーの展望
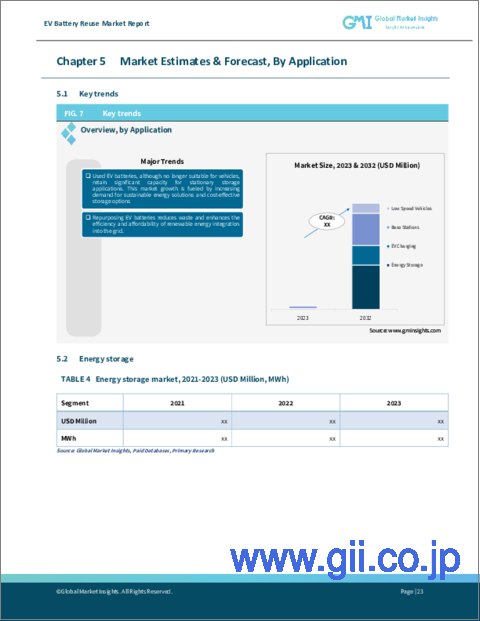
第5章 市場規模・予測:用途別、2021年~2032年
- 主要動向
- エネルギー貯蔵
- EV充電
- 基地局
- 低速車両
第6章 市場規模・予測:供給源別、2021年~2032年
- 主要動向
- BEV
- HEV・PHEV
第7章 市場規模・予測:地域別、2021年~2032年
- 主要動向
- 北米
- 米国
- カナダ
- 欧州
- 英国
- ドイツ
- イタリア
- スペイン
- ロシア
- フランス
- アジア太平洋
- 中国
- 日本
- 韓国
- インド
- オーストラリア
- 世界のその他の地域
第8章 企業プロファイル
- B2U Storage
- BatteryLoop
- Connected Energy Ltd.
- evyon.com.
- Moment Energy
- Nissan Motor Co., Ltd.
- OCTAVE BV
- RePurpose Energy Inc.
- Renault Group
- RWE+Audi(AUDI AG and RWE)
- Second Life EV Batteries Ltd
- Spiers New Technologies Inc.
- Stena Metall
- Tesla
EV Battery Reuse Market size is projected to expand at 46.6% CAGR from 2024 to 2032, led by increasing launches of electric vehicles and rapid technological advancements.
With more EVS hitting the roads, the demand for repurposing their batteries for secondary applications, such as energy storage and grid stabilization is rising. Technologies, such as improved battery management systems and advanced recycling processes are also enhancing the effectiveness of battery reuse. For instance, in June 2024, Trumpf launched innovative laser technology for industrial-scale EV battery recycling to enhance the efficiency and precision of battery material recovery for supporting more sustainable and effective recycling processes for electric vehicle batteries.
The overall market is segregated into application, source and region.
Based on application, the EV battery reuse market value from the base stations segment is estimated to rise at significant rate from 2024 to 2032, due to increasing adoption to enhance their energy storage capabilities. Base stations are equipped with energy storage systems that utilize repurposed EV batteries to help stabilize the grid and manage energy supply efficiently. Subsequently, ongoing innovations are improving the performance and integration of reused EV batteries in base stations for making them even more effective for grid support and energy management.
EV battery reuse industry from the HEV & PHEV source segment is anticipated to expand at substantial CAGR through 2032, owing to the increasing need of valuable sources for re-purpose battery packs. Increasing advancements in battery management and recycling technologies are enhancing the effectiveness of reused batteries from HEVs and PHEVs. This ongoing development is supporting sustainable battery lifecycle practices and contributing to more efficient energy use to optimize resources and promote cleaner energy solutions.
Regionally, the North America EV battery reuse market size is projected to expand between 2024 and 2032, on account of the economic incentives provided by governments and organizations. Economic incentives are encouraging companies to invest in battery repurposing technologies and develop innovative solutions. The rise in R&D in battery recycling and reuse for making these processes more cost-effective and sustainable will drive the industry growth throughout North America.
Table of Contents
Chapter 1 Methodology & Scope
- 1.1 Market definitions
- 1.2 Base estimates & calculations
- 1.3 Forecast calculation
- 1.4 Data sources
- 1.4.1 Primary
- 1.4.2 Secondary
- 1.4.2.1 Paid
- 1.4.2.2 Public
Chapter 2 Executive Summary
- 2.1 Industry 360° synopsis, 2021 - 2032
Chapter 3 Industry Insights
- 3.1 Industry ecosystem analysis
- 3.2 Regulatory landscape
- 3.3 Industry impact forces
- 3.3.1 Growth drivers
- 3.3.2 Industry pitfalls & challenges
- 3.4 Growth potential analysis
- 3.5 Porter's analysis
- 3.5.1 Bargaining power of suppliers
- 3.5.2 Bargaining power of buyers
- 3.5.3 Threat of new entrants
- 3.5.4 Threat of substitutes
- 3.6 PESTEL analysis
Chapter 4 Competitive landscape, 2023
- 4.1 Strategic dashboard
- 4.2 Innovation & technology landscape
Chapter 5 Market Size and Forecast, By Application, 2021 - 2032 (MWh & USD Million)
- 5.1 Key trends
- 5.2 Energy storage
- 5.3 Ev charging
- 5.4 Base stations
- 5.5 Low speed vehicles
Chapter 6 Market Size and Forecast, By Source, 2021 - 2032 (MWh & USD Million)
- 6.1 Key trends
- 6.2 BEV
- 6.3 HEV & PHEV
Chapter 7 Market Size and Forecast, By Region, 2021 - 2032 (MWh & USD Million)
- 7.1 Key trends
- 7.2 North America
- 7.2.1 U.S.
- 7.2.2 Canada
- 7.3 Europe
- 7.3.1 UK
- 7.3.2 Germany
- 7.3.3 Italy
- 7.3.4 Spain
- 7.3.5 Russia
- 7.3.6 France
- 7.4 Asia Pacific
- 7.4.1 China
- 7.4.2 Japan
- 7.4.3 South Korea
- 7.4.4 India
- 7.4.5 Australia
- 7.5 Rest of the world
Chapter 8 Company Profiles
- 8.1 B2U Storage
- 8.2 BatteryLoop
- 8.3 Connected Energy Ltd.
- 8.4 evyon.com.
- 8.5 Moment Energy
- 8.6 Nissan Motor Co., Ltd.
- 8.7 OCTAVE BV
- 8.8 RePurpose Energy Inc.
- 8.9 Renault Group
- 8.10 RWE + Audi (AUDI AG and RWE)
- 8.11 Second Life EV Batteries Ltd
- 8.12 Spiers New Technologies Inc.
- 8.13 Stena Metall
- 8.14 Tesla
