
|
市場調査レポート
商品コード
1844317
ヘリコバクター・ピロリ検査の市場機会、成長促進要因、産業動向分析、2025年~2034年予測Helicobacter Pylori Testing Market Opportunity, Growth Drivers, Industry Trend Analysis, and Forecast 2025 - 2034 |
||||||
カスタマイズ可能
|
|||||||
| ヘリコバクター・ピロリ検査の市場機会、成長促進要因、産業動向分析、2025年~2034年予測 |
|
出版日: 2025年09月19日
発行: Global Market Insights Inc.
ページ情報: 英文 172 Pages
納期: 2~3営業日
|

概要
世界のヘリコバクター・ピロリ検査市場は、2024年に5億1,780万米ドルと評価され、CAGR 7.1%で成長し、2034年には10億米ドルに達すると推定されています。
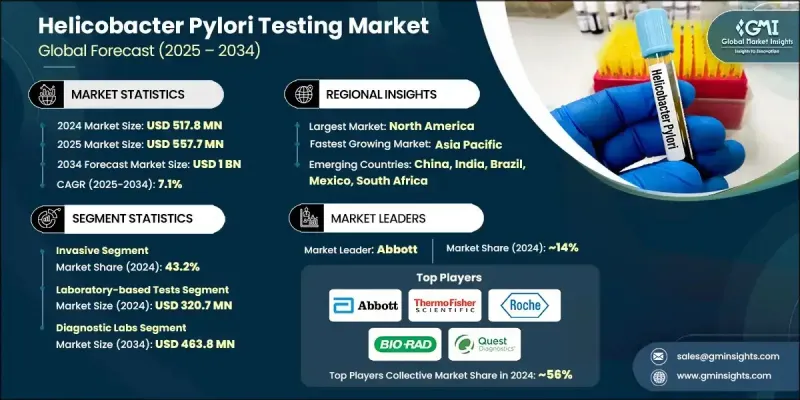
着実な成長の背景には、胃疾患の有病率の増加、高齢者人口の増加、非侵襲的診断アプローチへの関心の高まりがあります。臨床診断では大きな転換が進行中であり、世界中のヘルスケア・システムが高度な検査ツールによる疾患の早期発見に注力しています。消化器疾患が一般的になるにつれ、正確で患者にやさしい検査に対する需要が高まっています。同時に、早期発見に対する認識と嗜好の高まりが、病院や診断センターがピロリ菌検査能力を拡大することに影響を与えています。ポイント・オブ・ケア検査も、その迅速性、利便性、さまざまなヘルスケア環境での利用しやすさから、広く支持を集めています。これらの機器により、臨床医は迅速な結果を得ることができ、患者の転帰や治療期間を向上させることができます。さらに、分子診断学とAIベースの結果解釈や遠隔検査プラットフォームを含むデジタルヘルスツールの革新は、市場へのアクセスを大幅に拡大し、臨床精度を向上させています。これらの要素が相まって、ヘリコバクター・ピロリ検査領域は世界の消化器ヘルスケア診断の重要な分野へと形成されつつあります。
| 市場範囲 | |
|---|---|
| 開始年 | 2024 |
| 予測年 | 2025-2034 |
| 市場規模 | 5億1,780万米ドル |
| 予測金額 | 10億米ドル |
| CAGR | 7.1% |
侵襲的検査セグメントは、組織生検と顕微鏡分析によって達成される優れた診断精度により、2024年に43.2%のシェアを獲得しました。これらの方法は、特にリスクの高い症例や複雑な症例において、細菌感染や関連する胃の異常について信頼性の高い知見を提供します。臨床医は、精度と詳細な病理学的検査が必要な場合、侵襲的検査に依存し続けており、包括的診断とがんスクリーニングにおける重要な役割を強化しています。
ラボラトリーベースの検査セグメントは、2024年に3億2,070万米ドルを生み出しました。この分野は、提供される診断情報の高い信頼性と深さによってリードを保っています。組織学的分析、培養、血清学的アッセイなどのラボ検査は、細菌株の同定、感染ステージの決定、抗生物質耐性の評価に不可欠です。潰瘍や慢性胃炎のようなピロリ菌に関連した胃腸疾患の増加率は、病院と独立したラボの両方の環境において、精密なラボベースの診断の需要を高め続けています。
北米のヘリコバクター・ピロリ検査市場は2024年に34.6%のシェアを占めたが、これは同地域の確立されたヘルスケアインフラと消化器疾患負担の増加によるものです。診断ラボの存在感の強さ、臨床意識の高まり、早期スクリーニングの実施が検査普及に寄与しています。同地域はまた、先端診断への継続的な投資と非侵襲的ソリューションの利用増加の恩恵を受けており、米国とカナダの持続的な市場成長を支えています。
ヘリコバクター・ピロリ検査の世界市場で積極的に競争している主要企業は、Abbott、bioMerieux、Thermo Fisher Scientific、Bio-Rad Laboratories、Meridian Biosciences、Quidel Corporation、Gulf Coast Scientific、CERTEST、Coris BioConcept、Quest Diagnostics、Roche、Cardinal Health、BIOHITなどです。ヘリコバクター・ピロリ検査市場の企業は、市場での存在感を高めるために多面的な戦略を採用しています。大手メーカーは、研究開発投資を優先し、短納期で臨床的有用性の高い高感度診断キットを開発しています。多くの企業は、患者に優しい診断薬に対する需要の高まりに合わせ、非侵襲的な検査ポートフォリオを拡大しています。病院、診断チェーン、研究機関との戦略的パートナーシップにより、企業は販売網を拡大し、検査ソリューションを主流の臨床ワークフローに組み込むことができます。
目次
第1章 調査手法と範囲
第2章 エグゼクティブサマリー
第3章 業界考察
- エコシステム分析
- サプライヤーの情勢
- 各段階での付加価値
- バリューチェーンに影響を与える要因
- 業界への影響要因
- 促進要因
- 胃潰瘍の有病率の上昇
- 危険にさらされる高齢者人口の増加
- ポイントオブケア検査機器の需要増加
- 非侵襲性ピロリ菌検査の導入増加
- 業界の潜在的リスク&課題
- 侵襲的検査を行う熟練した専門家の不足
- H.ピロリ菌感染に関する認識の欠如
- 市場機会
- 分子検査における技術革新
- 自宅でできる自己検査キット
- 促進要因
- 成長可能性分析
- 規制情勢
- テクノロジーの情勢
- 現在の技術動向
- 非侵襲的検査の導入(尿素呼気、便抗原、血清学)
- 自動化および高スループット診断システム
- 検査情報システム(LIS)との統合
- アッセイの感度と特異性の向上
- 新興技術
- ポイントオブケア(POC)ポータブルH.ピロリ検出キット
- 正確な検出のための分子およびPCRベースのアッセイ
- 生検および組織学的分析のためのAIと機械学習
- 同時病原体検出のためのマルチプレックス検査プラットフォーム
- 現在の技術動向
- 将来の市場動向
- 非侵襲性の家庭用H.ピロリ検査キットの普及率
- より迅速かつ正確な検出のためのAI駆動型診断ツールの拡張
- 検査モニタリングのためのデジタルヘルスプラットフォームと遠隔医療の統合の拡大
- 市場開拓戦略
- 価格分析
- GAP分析
- ポーターの分析
- PESTEL分析
第4章 競合情勢
- イントロダクション
- 企業の市場シェア分析
- グローバル
- 北米
- 欧州
- アジア太平洋地域
- ラテンアメリカ・中東・アフリカ
- 企業マトリックス分析
- 主要市場企業の競合分析
- 競合ポジショニングマトリックス
- 主な発展
- 合併と買収
- パートナーシップとコラボレーション
- 新製品の発売
- 拡張計画
第5章 市場推計・予測:テストタイプ別、2021-2034
- 主要動向
- 侵襲的
- 迅速ウレアーゼ試験
- 組織学
- HP文化
- 非侵襲的
- 血清学的検査
- 尿素呼気試験
- 便抗原検査
第6章 市場推計・予測:方法別、2021-2034
- 主要動向
- 実験室でのテスト
- ポイントオブケア(POC)検査
第7章 市場推計・予測:最終用途別、2021-2034
- 主要動向
- 診断ラボ
- 病院
- クリニック
- その他の用途
第8章 市場推計・予測:地域別、2021-2034
- 主要動向
- 北米
- 米国
- カナダ
- 欧州
- ドイツ
- 英国
- フランス
- スペイン
- イタリア
- オランダ
- アジア太平洋地域
- 中国
- インド
- 日本
- オーストラリア
- 韓国
- ラテンアメリカ
- ブラジル
- メキシコ
- アルゼンチン
- 中東・アフリカ
- 南アフリカ
- サウジアラビア
- アラブ首長国連邦
第9章 企業プロファイル
- Abbott
- BIOHIT
- bioMerieux
- Bio-Rad Laboratories
- Cardinal Health
- CERTEST
- Coris BioConcept
- Gulf Coast Scientific
- Meridian Biosciences
- Quest Diagnostics
- Quidel Corporation
- Roche
- Thermo Fisher Scientific
