
レクリエーション用車両市場の機会、成長要因、業界動向分析、および2026年~2035年の予測
Recreational Vehicle Market Opportunity, Growth Drivers, Industry Trend Analysis, and Forecast 2026 - 2035- 発行日
- ページ情報
- 英文 260 Pages
- 納期
- 2~3営業日
- 商品コード
- 2045757
- カスタマイズ可能 お客様のご希望に応じて、既存データの加工や未掲載情報(例:国別セグメント)の追加などの対応が可能です。詳細はお問い合わせください。
- 翻訳ツール提供対象 PDF対応AI翻訳ツールの無料貸し出しサービスのご利用が可能です
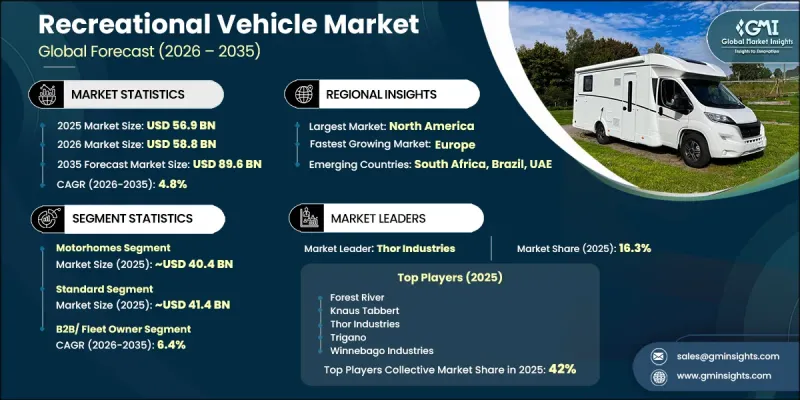
世界のレクリエーション用車両(RV)市場は、2025年に569億米ドルと評価され、2035年までにCAGR 4.8%で成長し、896億米ドルに達すると推定されています。
この市場は、旅行嗜好の変化、アウトドアレクリエーションへの参加増加、そして業界全体での継続的な製品革新に支えられ、安定した成長を遂げています。柔軟な旅行体験やモバイルな生活ソリューションに対する消費者の関心の高まりが、世界中でレクリエーション用車両への需要を牽引し続けています。メーカー各社は、先進的な電力管理システム、ソーラー統合、リチウム電池技術、そして強化されたコネクティビティ機能を備えた、コンパクトでありながら機能豊富なモデルを投入しており、これらが平均販売価格の上昇に寄与しています。人口動態の変化も市場拡大に大きな役割を果たしています。若い消費者は短期間で頻度の高い旅行体験を好む傾向が強まる一方、高齢の消費者は引き続き高級レクリエーション用車両やプレミアムモデルへの需要を支えています。レンタルや個人間車両シェアリングプラットフォームは、初めて利用するユーザーが所有へと移行するよう促すことで、顧客のアクセスをさらに広げています。さらに、充電インフラの進化やバッテリー技術の向上に支えられ、メーカーが電気式レクリエーション用車両の選択肢を模索する中、電動化技術の進歩が業界に徐々に影響を与えています。
| 市場範囲 | |
|---|---|
| 開始年 | 2025年 |
| 予測期間 | 2026年~2035年 |
| 開始時の市場規模 | 569億米ドル |
| 予測額 | 896億米ドル |
| CAGR | 4.8% |
レクリエーション用車両(RV)業界は、デジタル技術のさらなる統合、車両効率の向上、そして旅行の快適性を高める機能の充実を通じて、進化を続けています。パーソナライズされた旅行体験や自動車並みの利便性に対する消費者の需要が高まっていることから、メーカー各社は車両デザイン、走行性能、車載コネクティビティシステムにおけるイノベーションに注力しています。インテリジェントなエネルギー管理、統合型ナビゲーションシステム、高度な安全技術、そして改良されたインテリア機能といった特徴は、多様な顧客層において、ますます重要な購入要因となりつつあります。同時に、資金調達の容易化や販売店ネットワークの拡大により、より幅広い顧客層がレクリエーション用車両を手に入れやすくなっています。アウトドア観光、遠方への旅行の柔軟性、そしてモバイルなライフスタイルへの関心の高まりが、先進国および新興地域における長期的な市場成長をさらに後押ししています。
2025年には、モーターホームセグメントが70.9%のシェアを占め、404億米ドルの市場規模を生み出しました。様々な消費者層の好みに合わせた多様な車種が提供されていることから、モーターホームへの需要は引き続き高まっています。高級志向の購入者はハイエンドなモーターホームへの需要を支え続けていますが、一方で、利便性と柔軟性を求める若い旅行者や家族層の間では、コンパクトモデルや中型モデルの人気が高まっています。ADAS(先進運転支援システム)、運転支援技術、そして強化されたコネクティビティソリューションが、中級およびプレミアムクラスのモーターホームにますます組み込まれるようになり、全体的な運転体験と消費者の関心を高めています。
標準用途セグメントは2025年に415億米ドルの市場規模を記録し、2026年から2035年にかけてCAGR 4.3%で成長すると予測されています。標準的なレクリエーション用車両は、実用的な機能性、手頃な価格設定、そして季節ごとの旅行利用における信頼性の高い性能により、依然として人気を博しています。これらのモデルは、幅広い消費者層にとって手頃な価格を維持しつつ、必要不可欠な設備と耐久性に優れた構造を提供しています。強固な販売店ネットワーク、柔軟なファイナンスオプション、そして多様な製品ラインナップが、世界市場におけるスタンダード・レクリエーション・ビークルの需要を支え続けています。
米国レクリエーション用車両市場は、2025年に257億米ドルに達し、2035年までCAGR4.7%で成長すると予測されています。同国は、根強いアウトドアレクリエーション文化、広範な道路交通網、そしてキャンプ施設の豊富な利用可能性により、世界でも最大かつ最も成熟したレクリエーション用車両市場の一つであり続けています。道路旅行、アウトドア観光、そして柔軟な宿泊オプションに対する消費者の関心の高まりが、米国における需要を支え続けています。また、レンタルの利用しやすさ、リモートワークの柔軟性、そして移動型ライフスタイルへの関心の高まりに後押しされ、若い世代の消費者もより多く市場に参入しています。
よくあるご質問
目次
第1章 調査手法
第2章 エグゼクティブサマリー
第3章 業界洞察
- 業界エコシステム分析
- サプライヤーの情勢
- 利益率
- コスト構造
- 各段階における付加価値
- バリューチェーンに影響を与える要因
- ディスラプション
- 業界への影響要因
- 促進要因
- 体験型旅行およびアドベンチャー・ツーリズムへの関心の高まり
- ミレニアル世代とZ世代のアウトドアレクリエーションへの関心の高まり
- リモートワークの定着が長期のRV旅行を可能にする
- 新興市場における可処分所得の増加
- 業界の潜在的リスク・課題
- 季節的な需要の変動と稼働率の低下
- キャンプ場のインフラおよび駐車施設の不足
- 市場機会
- 持続可能な旅行に向けた電気・ハイブリッドRVの開発
- レンタル・シェアリングエコノミー・プラットフォームの拡大
- 未開拓のアジア太平洋市場への進出
- 促進要因
- 技術とイノベーションの展望
- 最新技術動向
- GPSナビゲーションおよびテレマティクスシステム
- 太陽光発電統合システム
- 新興技術
- Vehicle-to-Grid(V2G)充電システム
- 水素燃料電池推進システム
- 最新技術動向
- 成長ポテンシャル分析
- 価格分析
- 過去の価格動向分析
- プレイヤータイプ別価格戦略(プレミアム・バリュー・コストプラス)
- 規制情勢
- 北米
- 米国- 米国大気浄化法(CAA)
- 米国- 連邦自動車安全基準(FMVSS)
- カナダ- 自動車安全法(MVSA)
- 欧州
- EU-ユーロVI自動車排出ガス基準
- EU-一般安全規則(GSR)2019/2144
- アジア太平洋
- 中国- 中国VI排出ガス基準
- インド- バーラト・ステージVI(BS-VI)排出ガス規制
- LATAM
- ブラジル-PROCONVE自動車排出ガス規制プログラム
- チリ- 自動車排出ガス基準DS No. 211
- 中東・アフリカ
- UAE-UAEの自動車安全規制
- サウジアラビア-SASO燃費基準
- 北米
- ポーターの分析
- PESTLE分析
- 貿易データ分析
- 輸出入数量・金額の動向
- 主要貿易ルートと関税の影響
- 生産能力・生産情勢
- 設備容量:地域・主要生産者別
- 稼働率・拡張計画
- コスト内訳分析
- 原材料・部品コスト
- 製造・組立コスト
- パワートレインおよびエネルギーシステムのコスト
- 内装および快適装備のコスト
- 流通・物流コスト
- 特許分析
- 持続可能性と環境面
- 持続可能な取り組み
- 廃棄物削減戦略
- 生産におけるエネルギー効率
- 環境に配慮した取り組み
- カーボンフットプリントへの配慮
- AIおよび生成AIが市場に与える影響
- AIによる既存ビジネスモデルの変革
- セグメント別の生成AIのユースケースと導入ロードマップ
- リスク、制約、および規制上の考慮事項
- 所有経済からレンタル経済への移行
- 車種別・地域別のレンタル市場浸透率
- P2Pレンタルプラットフォームによる変革
- 従来の所有モデルの衰退のメカニズム
- 予測前提条件およびシナリオ分析
- ベースケース:CAGRを牽引する主要なマクロ経済および業界変数
- 楽観的シナリオ:マクロ経済および業界における追い風
- 悲観シナリオ:マクロ経済の減速または業界の逆風
第4章 競合情勢
- イントロダクション
- 企業市場シェア分析
- 北米
- 欧州
- アジア太平洋
- LATAM
- 中東・アフリカ
- 主要市場企業の競合分析
- 競合ポジショニング・マトリックス
- 主な発展
- 合併・買収
- パートナーシップ・提携
- 新製品の発売
- 事業拡大計画と資金調達
- 企業規模のベンチマーク
- ランク分類基準および選定基準
- 売上高、地域、イノベーション別ティア位置付けマトリックス
第5章 市場推計・予測:車両別、2022年-2035年
- キャンピングカー
- クラス
- クラスA
- クラスB
- クラスC
- 燃料
- ガソリン
- ディーゼル
- バッテリー式電気自動車
- ハイブリッド
- クラス
- 牽引式RV
- 折りたたみ式/キャンプ用トレーラー
- トラックキャンパー
- フィフス・ウィーラー
- トラベルトレーラー
第6章 市場推計・予測:価格帯別、2022年-2035年
- スタンダード
- 高級
第7章 市場推計・予測:用途別、2022年-2035年
- B2C/個人
- B2B/フリートオーナー
第8章 市場推計・予測:地域別、2022年-2035年
- 北米
- 米国
- カナダ
- 欧州
- ドイツ
- 英国
- フランス
- イタリア
- スペイン
- オランダ
- スウェーデン
- ノルウェー
- スイス
- アジア太平洋
- 中国
- 日本
- 韓国
- インド
- タイ
- インドネシア
- マレーシア
- ラテンアメリカ
- ブラジル
- メキシコ
- アルゼンチン
- チリ
- 中東・アフリカ
- 南アフリカ
- サウジアラビア
- UAE
第9章 企業プロファイル
- 世界企業
- Thor Industries
- Forest River
- Winnebago Industries
- REV Group
- Trigano
- Knaus Tabbert
- Hymer
- Wildax Motorhomes
- Dethleffs
- Burstner
- Hobby Caravan
- Groupe Pilote
- 地域企業
- Triple E RV
- Adria Mobil
- Swift Leisure
- Fendt Caravan
- Bailey of Bristol
- Zone RV
- Giottiline
- 新興企業
- Sportsmobile
- Kimberley Kampers
- Tonke Campers
- 発行日
- 発行
- Global Market Insights Inc.
- ページ情報
- 英文 260 Pages
- 納期
- 2~3営業日