
|
市場調査レポート
商品コード
1913396
高純度アルミナ市場:市場機会、成長促進要因、産業動向分析、将来予測(2026~2035年)High Purity Alumina Market Opportunity, Growth Drivers, Industry Trend Analysis, and Forecast 2026 - 2035 |
||||||
カスタマイズ可能
|
|||||||
| 高純度アルミナ市場:市場機会、成長促進要因、産業動向分析、将来予測(2026~2035年) |
|
出版日: 2025年12月22日
発行: Global Market Insights Inc.
ページ情報: 英文 250 Pages
納期: 2~3営業日
|

概要
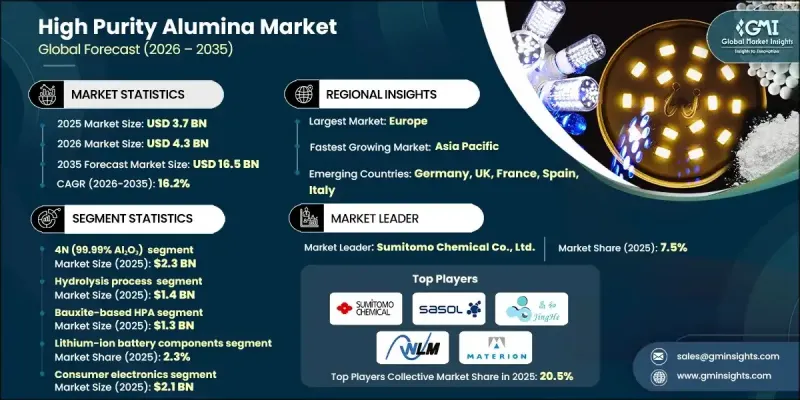
世界の高純度アルミナ市場は、2025年に37億米ドルと評価され、2035年までにCAGR 16.2%で成長し、165億米ドルに達すると予測されています。
市場成長は、ハイエンド産業用途において厳格な品質・信頼性・性能要件を満たす先端材料への需要増加に牽引されています。不純物含有量が最小限の酸化アルミニウムから製造される高純度アルミナは、優れた熱安定性、高い耐薬品性、優れた電気絶縁特性を備えています。これらの特性により、精度と耐久性が不可欠な用途において重要な材料となっています。製造分野全体での高性能材料への継続的な依存が、市場の着実な拡大を支えています。生産技術の著しい進歩も市場の勢いを後押ししており、近代化された精製・浄化手法により均一な材料品質が実現されています。メーカーはエネルギー効率の向上と排出量削減を図りながら、用途固有の要件を満たすために材料特性を微調整する能力を高めています。この進化は、持続可能な製造手法と最適化された生産プロセスへの広範な産業的転換を反映しており、高純度アルミナを次世代技術の基幹材料として位置づけています。
| 市場範囲 | |
|---|---|
| 開始年 | 2025年 |
| 予測期間 | 2026~2035年 |
| 当初の市場規模 | 37億米ドル |
| 市場規模予測 | 165億米ドル |
| CAGR | 16.2% |
加水分解法のセグメントは2025年に14億米ドルに達しました。塩酸浸出法と並んで、加水分解は一貫した純度レベルを実現できる費用対効果が高く拡張性のある生産方法として注目されています。大規模な生産量と厳格な品質管理の両立が可能であるため、増加する産業需要に応えるのに適しています。
リチウムイオン電池部品のセグメントは2025年に2.3%のシェアを占めました。高純度アルミナの需要は、卓越した材料の一貫性と信頼性を必要とする用途へとシフトし続けています。特に高温環境や精密加工環境において製造公差が厳格化する中、高い熱安定性、光学透明性、最小限の汚染を必要とする分野での使用は引き続き堅調です。
北米の高純度アルミナ市場は2025年に5億2,530万米ドルの規模に達しました。この地域の成長は、先端電子機器、航空宇宙、防衛、エネルギー貯蔵産業からの強い需要に支えられています。研究開発、イノベーション、高水準の製造基準への継続的な投資が、地域全体での採用と消費をさらに加速させています。
よくあるご質問
目次
第1章 分析手法と範囲
第2章 エグゼクティブサマリー
第3章 業界考察
- 業界のエコシステム分析
- サプライヤーの情勢
- 利益率
- 各段階における付加価値
- バリューチェーンに影響を与える要因
- ディスラプション
- 業界への影響要因
- 促進要因
- 高度な電子機器に対する需要の高まり
- 電気自動車エコシステムの急速な成長
- LEDおよび照明技術の拡大
- 業界の潜在的リスクと課題
- 高い生産コストとエネルギー需要
- 低コスト地域生産者からの競合圧力
- 市場機会
- 次世代電池における採用拡大
- 5Gおよび将来の6Gインフラの拡大
- 航空宇宙・防衛分野における利用拡大
- 促進要因
- 成長可能性分析
- 規制情勢
- 北米
- 欧州
- アジア太平洋
- ラテンアメリカ
- 中東・アフリカ
- ポーターのファイブフォース分析
- PESTEL分析
- 技術とイノベーションの動向
- 現在の技術動向
- 新興技術
- 価格動向
- 地域別
- 純度等級別
- 将来の市場動向
- 技術とイノベーションの動向
- 現在の技術動向
- 新興技術
- 特許状況
- 貿易統計(HSコード)(注:貿易統計は主要国のみ提供いたします)
- 主要輸入国
- 主要輸出国
- 持続可能性と環境面
- 持続可能な取り組み
- 廃棄物削減戦略
- 生産におけるエネルギー効率
- 環境に配慮した取り組み
- カーボンフットプリントへの配慮
第4章 競合情勢
- イントロダクション
- 企業別の市場シェア分析
- 地域別
- 北米
- 欧州
- アジア太平洋
- ラテンアメリカ
- 中東・アフリカ
- 地域別
- 企業マトリックス分析
- 主要企業の競合分析
- 競合ポジショニング・マトリックス
- 主な動向
- 企業合併・買収 (M&A)
- 事業提携・協力
- 新製品の発売
- 拡大計画
第5章 市場推計・予測:純度グレード別(2022~2035年)
- 3N(99.9% AL2O3)
- 4N(99.99% AL2O3)
- 5N(99.999% AL2O3)
- 6N(99.9999% AL2O3)
- UHPA-超高純度アルミナ(99.9999%超)
第6章 市場推計・予測:製造技術別(2022~2035年)
- 加水分解法
- 塩酸(HCl)浸出法
- アルコキシド法
- 熱分解
- 三層電解精製
- 分留結晶化
- 真空蒸留
- その他
第7章 市場推計・予測:原料別(2022~2035年)
- ボーキサイト系HPA
- カオリン系HPA
- アルミニウム金属ベースのHPA
- 高アルミナ粘土系HPA
第8章 市場推計・予測:用途別(2022~2035年)
- LED基板および照明
- サファイア基板の生産
- 半導体製造
- リチウムイオン電池部品
- 5Gおよび通信インフラ
- 医療・バイオメディカル用途
- 量子コンピューティング部品
- 航空宇宙・防衛用セラミックス
- パワーエレクトロニクス・高周波デバイス
- 技術用・先端セラミックス
- 電子ディスプレイ、オプトエレクトロニクス
- その他
第9章 市場推計・予測:最終用途産業別(2022~2035年)
- 民生用電子機器
- 自動車
- 航空宇宙・防衛産業
- 医療・医療機器
- 電気通信
- エネルギー・電力
- 工業・製造業
- その他
第10章 市場推計・予測:地域別(2022~2035年)
- 北米
- 米国
- カナダ
- メキシコ
- 欧州
- ドイツ
- 英国
- フランス
- スペイン
- イタリア
- その他欧州
- アジア太平洋
- 中国
- インド
- 日本
- オーストラリア
- 韓国
- その他アジア太平洋
- ラテンアメリカ
- ブラジル
- メキシコ
- アルゼンチン
- その他ラテンアメリカ
- 中東・アフリカ
- サウジアラビア
- 南アフリカ
- アラブ首長国連邦
- その他中東・アフリカ
第11章 企業プロファイル
- Alcoa Corporation
- Altech Chemicals Limited
- Baikowski
- Caplinq Corporation
- Emerging sustainable HPA producers
- Hebei Pengda Advanced Materials Technology
- Materion Corporation
- Nippon Light Metal Holdings Co., Ltd.
- Norsk Hydro ASA
- Orbite Technologies Inc.
- PSB Industries SA
- Sumitomo Chemical Co., Ltd.
- Sasol Limited
- Xuancheng Jingrui New Materials Co., Ltd.
