
|
市場調査レポート
商品コード
1885924
データセンターインフラストラクチャ管理市場の機会、成長要因、業界動向分析、および2025年から2034年までの予測Data Center Infrastructure Management (DCIM) Market Opportunity, Growth Drivers, Industry Trend Analysis, and Forecast 2025 - 2034 |
||||||
カスタマイズ可能
|
|||||||
| データセンターインフラストラクチャ管理市場の機会、成長要因、業界動向分析、および2025年から2034年までの予測 |
|
出版日: 2025年11月24日
発行: Global Market Insights Inc.
ページ情報: 英文 230 Pages
納期: 2~3営業日
|

概要
世界のデータセンターインフラストラクチャ管理(DCIM)市場は、2024年に43億米ドルと評価され、2034年までにCAGR22.7%で成長し、336億米ドルに達すると予測されています。
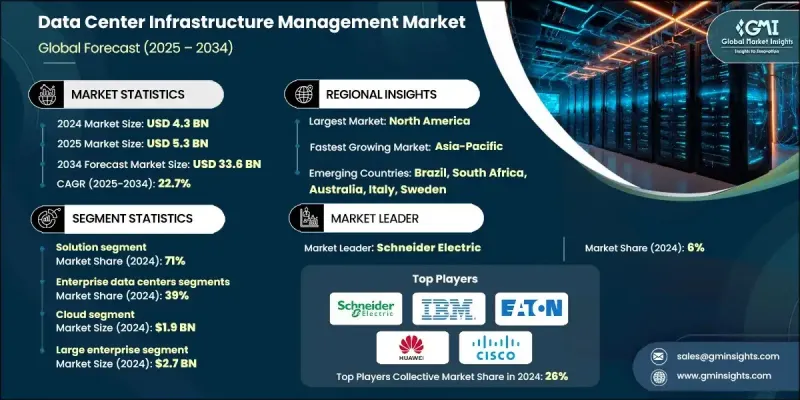
市場の拡大は、AIワークロードの急速な普及、ハイブリッドクラウドの複雑化、そしてますます厳格化するエネルギー効率規制によって推進されています。従来のキャパシティプランニングは、AIを活用した予測運用、デジタルツインシミュレーション、ITと運用技術(OT)の完全統合環境へと移行しつつあります。特にラックあたり40kWを超える高密度AIトレーニングクラスターにおいて、運用者は性能維持とダウンタイム回避のため、電力分配、熱環境、冷却システムのリアルタイム可視化を求め、DCIMソリューションは不可欠となっています。この市場の成長加速は、世界中のエンタープライズ、ハイパースケール、コロケーションデータセンターにおけるインフラ最適化、サステナビリティ報告、コスト効率の高い運用への需要の高まりとも関連しています。AI、機械学習、予測分析の統合は、運用管理を再定義し、現代のデータセンター環境においてより高い効率性、回復力、拡張性を確保しています。
| 市場範囲 | |
|---|---|
| 開始年 | 2024年 |
| 予測期間 | 2025-2034 |
| 開始時価値 | 43億米ドル |
| 予測金額 | 336億米ドル |
| CAGR | 22.7% |
ソリューションセグメントは2024年に71%のシェアを占め、2025年から2034年にかけてCAGR 23.5%で成長すると予測されています。このセグメントには、DCIMソフトウェアプラットフォーム、監視ツール、分析エンジン、統合型ハードウェア・ソフトウェアアプライアンスが含まれます。最新のDCIMソリューションは、監視機能を超え、包括的な資産管理、キャパシティプランニング、予知保全、デジタルツインシミュレーション、電力・冷却の最適化、サステナビリティ報告などを提供し、運用者がインフラ全体にわたって実用的な知見を得られるようにします。
エンタープライズデータセンターセグメントは、2024年に39%のシェアを占め、2034年までCAGR21.7%で成長すると予測されています。これらのセンターは、組織が内部で所有・運営しており、医療、製造、政府、金融サービスなどの分野で世界的に普及しているため、支配的な地位を占めています。効率性の要求の高まり、コスト削減目標、持続可能性コンプライアンス要件が、エンタープライズにおけるDCIMソリューションの導入を促進しています。
米国のデータセンターインフラストラクチャ管理(DCIM)市場は2024年に14億8,000万米ドルの規模に達しました。ハイパースケール事業者、コロケーションプロバイダー、企業データセンターが集中する北米地域が引き続き主導的立場にあり、地域収益の90%を米国が占めています。世界のデータセンター容量の約60%、データセンターエネルギー消費量の45%が米国に集中しています。米国市場は電力使用量の増加に牽引されており、効率最適化、電力消費の監視、運用コスト削減を実現するインテリジェント管理ソリューションの導入が促進されています。
よくあるご質問
目次
第1章 調査手法と範囲
第2章 エグゼクティブサマリー
第3章 業界考察
- エコシステム分析
- サプライヤーの情勢
- コンポーネントメーカー
- システムインテグレーター及びディストリビューター
- 施設運営者様とサービスプロバイダー様
- エンドユースと企業
- コスト構造
- 利益率
- 各段階における付加価値
- 垂直統合の動向
- ディスラプター
- サプライヤーの情勢
- 影響要因
- 促進要因
- 高密度AI・HPCワークロードの急増
- ハイブリッドおよびマルチクラウドインフラストラクチャへの移行
- 上昇するエネルギーコストと義務化された効率化規制
- エッジデータセンターの普及
- 業界の潜在的リスク&課題
- 初期導入時の統合・展開の複雑さ
- 断片化されたベンダーエコシステムと相互運用性の課題
- 市場機会
- DCIM 2.0の導入状況
- OTとITの統合による施設全体のデジタルツイン構築
- 促進要因
- 技術動向とイノベーションエコシステム
- 現行技術
- 人工知能(AI)と機械学習(ML)
- 生成AIと大規模言語モデル
- デジタルツイン技術
- モノのインターネット(IoT)とエッジコンピューティング
- 新興技術
- ブロックチェーン及び分散型台帳技術
- 拡張現実(AR)と仮想現実(VR)
- 量子コンピューティング
- 5Gおよび次世代接続技術
- 現行技術
- 成長可能性分析
- 規制情勢
- データ主権とローカライゼーション要件
- 環境・持続可能性に関する規制
- 建築基準及び安全基準
- 地域別規制比較
- 北米
- 欧州
- アジア太平洋地域
- ラテンアメリカ
- 中東・アフリカ
- ポーター分析
- PESTEL分析
- 特許分析
- コスト内訳分析
- 価格動向
- 競争力のある価格戦略
- ソフトウェアライセンシング価格帯
- プロフェッショナルサービス料金
- ベンダーの収益モデルと戦略
- 製品パイプラインと研究開発ロードマップ
- 現行製品世代の分析
- 機能セットと能力のベンチマーク
- 技術スタックとアーキテクチャ
- パフォーマンス及びスケーラビリティ指標
- 強みと限界
- 次世代製品パイプライン
- 発表済み製品リリース(2024-2026)
- ベータ版および早期アクセスプログラム
- 技術プレビュー及び概念実証
- 今後の機能強化予定
- 現行製品世代の分析
- 特許分析
- 米国特許商標庁(USPTO)特許分類分析
- 主要特許保有者及びイノベーションリーダー
- 特許プール及び標準必須特許
- 新興技術の特許ホットスポット
- 持続可能性と環境面
- データセンターの環境フットプリント
- カーボンプライシング及び排出量取引制度
- 持続可能性におけるDCIMの役割
- DCIMを活用した持続可能性の達成事例
- 市場導入・浸透分析
- 技術導入ライフサイクル
- 導入障壁と促進要因
- 市場浸透分析
- 顧客意思決定プロセス
- 使用事例分析と適用シナリオ
- 使用事例分類体系と分類
- データセンターの種類別
- 機能別目的別
- 業界別
- 導入規模別
- 詳細使用事例分析
- エネルギー効率の最適化
- キャパシティ計画と予測
- 予知保全と故障予防
- 複数拠点の可視化と管理
- 使用事例分類体系と分類
- 顧客及びエンドユースに関する洞察
- 購買行動と意思決定プロセス
- 顧客の購買プロセス分析
- 顧客満足度とネットプロモータースコア
- 顧客の課題点と未充足ニーズ
第4章 競合情勢
- イントロダクション
- 企業の市場シェア分析
- 北米
- 欧州
- アジア太平洋地域
- ラテンアメリカ
- 中東・アフリカ
- 競合ポジショニングマトリックス
- 戦略的展望マトリックス
- 主な発展
- 合併・買収
- 提携・協業
- 新製品の発売
- 事業拡大計画と資金調達
- プレミアムポジショニング戦略
- 競合分析と独自の強み(USP)
第5章 市場推計・予測:コンポーネント別、2021-2034
- 主要動向
- ソリューション
- 資産運用
- ネットワーク管理
- 冷却管理
- 電力および温度管理
- その他
- サービス
- 設置および統合
- 管理
- コンサルティング
第6章 市場推計・予測:データセンター別、2021-2034
- 主要動向
- 企業向けデータセンター
- コロケーションデータセンター
- ハイパースケールデータセンター
- エッジデータセンター
第7章 市場推計・予測:導入形態別、2021-2034
- 主要動向
- クラウド
- ハイブリッド
- オンプレミス
第8章 市場推計・予測:企業規模別、2021-2034
- 主要動向
- 大企業
- 中小企業
第9章 市場推計・予測:用途別、2021-2034
- 主要動向
- BFSI
- コロケーション
- エネルギー
- 政府
- ヘルスケア
- 製造業
- IT・通信
- その他
第10章 市場推計・予測:地域別、2021-2034
- 北米
- 米国
- カナダ
- 欧州
- 英国
- ドイツ
- フランス
- イタリア
- スペイン
- ベルギー
- オランダ
- スウェーデン
- ロシア
- アジア太平洋地域
- 中国
- インド
- 日本
- オーストラリア
- シンガポール
- 韓国
- ベトナム
- インドネシア
- ラテンアメリカ
- ブラジル
- メキシコ
- アルゼンチン
- 中東・アフリカ地域
- 南アフリカ
- サウジアラビア
- アラブ首長国連邦
第11章 企業プロファイル
- 世界の企業
- ABB
- Eaton
- FNT Software
- Hewlett-Packard Enterprise
- IBM
- Nlyte Software
- Schneider Electric
- Siemens
- Sunbird Software
- 地域の企業
- CommScope
- Cormant
- Device42
- EkkoSense
- Emerson
- Fujitsu
- Huawei Technologies
- Hyperview
- Packet Power
- Rittal
- 新興企業・イノベーター
- Arista
- Cisco
- Inspur
- Lenovo
- Modius
- NetApp
- Supermicro
