
ワイヤレスセンサー市場の機会、成長促進要因、産業動向分析、2025年~2034年の予測
Wireless Sensor Market Opportunity, Growth Drivers, Industry Trend Analysis, and Forecast 2025 - 2034- 発行日
- ページ情報
- 英文 180 Pages
- 納期
- 2~3営業日
- 商品コード
- 1801812
- カスタマイズ可能 お客様のご希望に応じて、既存データの加工や未掲載情報(例:国別セグメント)の追加などの対応が可能です。詳細はお問い合わせください。
- 翻訳ツール提供対象 PDF対応AI翻訳ツールの無料貸し出しサービスのご利用が可能です
概要
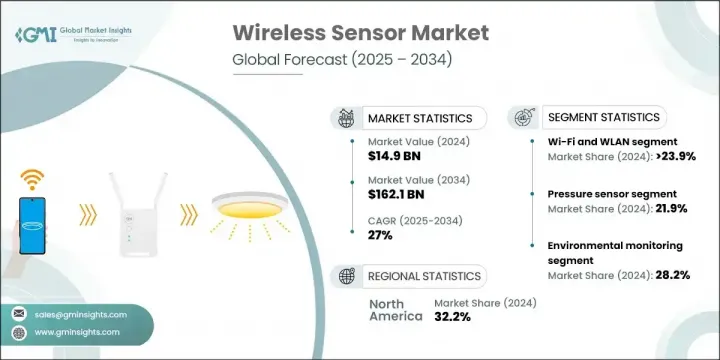
ワイヤレスセンサーの世界市場規模は、2024年に149億米ドルとなり、CAGR 27%で成長し、2034年には1,621億米ドルに達すると予測されています。
この市場拡大の背景には、各産業における自動化の進展、ロボット導入の急増、スマートインフラへの継続的な投資があります。自動車産業は、特にADAS(先進運転支援システム)や自律走行技術の需要で重要な役割を果たしています。産業エコシステムの近代化に伴い、ワイヤレスセンサーはリアルタイムのデータ取得と遠隔監視に不可欠なものとなり、配線の複雑さを軽減し、より柔軟なシステム構成を可能にしています。
スマートシティからインダストリー4.0への変革に至るまで、これらのセンサーは予測分析、システム最適化、コネクテッド・オペレーションの実現に役立っています。機械、インフラ、デバイスがシームレスに相互作用するインテリジェント環境のバックボーンとして機能します。製造業では、ワイヤレス・センサは状態ベースのモニタリングをサポートし、故障の早期発見とメンテナンス・アラートによって予定外のダウンタイムを最小限に抑えます。スマートシティでは、空気の質、交通の流れ、エネルギー使用量、公共安全システムをリアルタイムで追跡し、都市計画担当者がデータに基づいた意思決定を行えるよう支援します。エネルギーと公益事業では、ワイヤレスセンサーが負荷配分を最適化し、グリッド性能を監視し、リモート資産管理を可能にします。その役割はサプライチェーンにも及び、センサーは可視性、トレーサビリティ、在庫管理を強化します。
| 市場範囲 | |
|---|---|
| 開始年 | 2024 |
| 予測年 | 2025-2034 |
| 開始金額 | 149億米ドル |
| 予測金額 | 1,621億米ドル |
| CAGR | 27% |
Wi-FiおよびWLAN技術セグメントは、2034年までCAGR 28.2%で成長します。Wi-Fi 6EやWi-Fi 7のような標準規格の進歩は、企業ネットワーク、スマートホーム、家電製品におけるWi-Fiの高い普及率を支えており、低遅延、高速化、高密度環境でのデバイス処理の改善を実現しています。こうした改良により、ストリーミング、産業用IoT、ゲーム用途での役割がさらに強化されています。
2024年には、圧力センサセグメントはアプリケーションタイプによって支配され、製造、自動車、ヘルスケア、空調制御システムなどのセクターで広く展開されます。リアルタイムで精度の高いデータを提供できることから、ミッションクリティカルなシステム全体の厳密な監視と精密な制御を必要とする業務に不可欠です。
北米のワイヤレスセンサー市場は2024年に32.2%のシェアを占め、スマート製造の急速な進展と低消費電力ワイヤレス技術の広範な展開がその原動力となっています。主要センサメーカーは、エネルギー効率、エッジコンピューティング、プロトコル標準化に焦点を当てた研究開発を強化しています。米国の都市におけるワイヤレスセンサーネットワークの最近の拡大は、リアルタイムの環境モニタリングをサポートし、都市計画や公衆衛生イニシアチブのためのデータ主導の意思決定を改善しています。
世界のワイヤレスセンサー市場の主要企業には、Honeywell International, Inc.、Emerson Electric Co.、Siemens AG、ABB Ltd.、Texas Instruments Incorporatedなどがあります。主要企業は、エッジコンピューティングをサポートする超低消費電力かつ高集積のセンサープラットフォームを開発するため、製品イノベーションへの投資を優先しています。これらの企業は、センサーをエンド・ツー・エンドのソリューションに統合するため、産業用IoTプロバイダーとの戦略的パートナーシップを拡大しています。企業はまた、ヘルスケアやスマート農業などの新しいアプリケーション垂直分野にも参入し、市場範囲を多様化しています。多額の研究開発予算は、接続プロトコルの強化とリアルタイム分析のための性能最適化に向けられています。また、多くの企業が世界な販売網とデジタル・プラットフォームを強化し、市場への浸透とアフターセールス・サポートの向上を図るとともに、合併や提携を積極的に模索し、技術力と地理的なフットプリントの拡大を図っています。
目次
第1章 調査手法と範囲
第2章 エグゼクティブサマリー
第3章 業界考察
- エコシステム分析
- サプライヤーの情勢
- 利益率
- コスト構造
- 各段階での付加価値
- バリューチェーンに影響を与える要因
- ディスラプション
- 業界への影響要因
- 促進要因
- エネルギー効率の高い技術の採用の増加
- 世界中で成長する自動車産業
- 産業オートメーションとインダストリー4.0の導入拡大
- 遠隔監視と資産追跡の需要
- 世界中でスマートインフラへの投資が増加
- 業界の潜在的リスク&課題
- 標準化の欠如
- 電力とバッテリーの制限
- 市場機会
- 世界中でスマートシティが拡大
- 精密農業の成長
- ヘルスケアと遠隔患者モニタリング
- エネルギーハーベスティングの進歩
- 促進要因
- 成長可能性分析
- 規制情勢
- 北米
- 欧州
- アジア太平洋地域
- ラテンアメリカ
- 中東・アフリカ
- ポーターの分析
- PESTEL分析
- テクノロジーとイノベーションの情勢
- 現在の技術動向
- 新興技術
- 価格動向
- 地域別
- 製品別
- 価格戦略
- 新たなビジネスモデル
- コンプライアンス要件
- 持続可能性対策
- 特許および知的財産分析
- 地政学と貿易のダイナミクス
第4章 競合情勢
- イントロダクション
- 企業の市場シェア分析
- 地域別
- 市場集中分析
- 主要プレーヤーの競合ベンチマーキング
- 財務実績の比較
- 収益
- 利益率
- 研究開発
- 製品ポートフォリオの比較
- 製品ラインナップの広さ
- テクノロジー
- 革新
- 地理的プレゼンスの比較
- 世界フットプリント分析
- サービスネットワークの範囲
- 地域別の市場浸透率
- 競合ポジショニングマトリックス
- リーダーたち
- 課題者たち
- フォロワー
- ニッチプレイヤー
- 戦略的展望マトリックス
- 財務実績の比較
- 主な発展, 2021-2024
- 合併と買収
- パートナーシップとコラボレーション
- 技術的進歩
- 拡大と投資戦略
- デジタル変革の取り組み
- 新興企業/スタートアップ企業の競合情勢
第5章 市場推計・予測:センサータイプ別、2021年~2034年
- 主要動向
- バイオセンサー
- 温度センサー
- 圧力センサー
- 湿度センサー
- ガス/化学センサー
- フローセンサー
- レベルセンサー
- モーション&ポジショニングセンサー
- その他
第6章 市場推計・予測:技術別、2021年~2034年
- 主要動向
- Bluetooth
- Wi-FiとWLAN
- Zigbee
- Wireless HART
- RFID
- EnOcean
- その他
第7章 市場推計・予測:用途別、2021年~2034年
- 主要動向
- 環境モニタリング
- 資産追跡
- 構造健全性モニタリング
- エネルギー管理
- セキュリティと監視
- その他
第8章 市場推計・予測:最終用途別、2021年~2034年
- 主要動向
- 自動車
- ヘルスケア
- 産業
- コンシューマーエレクトロニクス
- 農業
- 航空宇宙および防衛
- 運輸・物流
- その他
第9章 市場推計・予測:地域別、2021年~2034年
- 主要動向
- 北米
- 米国
- カナダ
- 欧州
- ドイツ
- 英国
- フランス
- イタリア
- スペイン
- オランダ
- アジア太平洋地域
- 中国
- インド
- 日本
- オーストラリア
- 韓国
- ラテンアメリカ
- ブラジル
- メキシコ
- アルゼンチン
- 中東・アフリカ
- 南アフリカ
- サウジアラビア
- アラブ首長国連邦
第10章 企業プロファイル
- 世界の主要企業
- Honeywell International
- Texas Instruments Inc
- Siemens AG
- ABB Ltd.
- Emerson Electric Co.
- 地域別主要企業
- 北米
- Analog Devices Inc.
- Cisco Systems Inc.
- Monnit Corporation
- 欧州
- STMicroelectronics N.V.
- Infineon Technologies AG
- TE Connectivity Ltd.
- NXP Semiconductors N.V.
- アジア太平洋地域
- Yokogawa Electric Corporation
- Huawei Investment Holding Co., Ltd.
- Toshiba Corporation
- Holykell Technology Co., Ltd.
- 北米
- ニッチ企業/ディスラプター
- BAE Systems PLC
- Phoenix Sensors LLC
- IntelliSense.io
- Inovonics Corporation
目次
The Global Wireless Sensor Market was valued at USD 14.9 billion in 2024 and is estimated to grow at a CAGR of 27% to reach USD 162.1 billion by 2034. The expansion is fueled by rising automation across industries, a sharp increase in robotics adoption, and continued investment in smart infrastructure. The automotive sector is playing a key role, particularly with demand for advanced driver-assistance systems and autonomous technologies. As industrial ecosystems modernize, wireless sensors are becoming essential to real-time data capture and remote monitoring, helping reduce wiring complexity and enabling more flexible system configurations.
From smart cities to Industry 4.0 transformations, these sensors are instrumental in enabling predictive analytics, system optimization, and connected operations. They serve as the backbone for intelligent environments where machines, infrastructure, and devices interact seamlessly. In manufacturing, wireless sensors support condition-based monitoring, minimizing unplanned downtime through early fault detection and maintenance alerts. Within smart cities, they power real-time tracking of air quality, traffic flow, energy usage, and public safety systems-helping urban planners make data-driven decisions. In energy and utilities, wireless sensors optimize load distribution, monitor grid performance, and enable remote asset management. Their role extends to supply chains as well, where sensors enhance visibility, traceability, and inventory control.
| Market Scope | |
|---|---|
| Start Year | 2024 |
| Forecast Year | 2025-2034 |
| Start Value | $14.9 billion |
| Forecast Value | $162.1 Billion |
| CAGR | 27% |
The Wi-Fi and WLAN technology segment will grow at a CAGR of 28.2% through 2034. Its high adoption across enterprise networks, smart homes, and consumer electronics is supported by advancements in standards like Wi-Fi 6E and Wi-Fi 7, which offer lower latency, enhanced speeds, and improved device handling in high-density environments. These improvements are further strengthening its role in streaming, industrial IoT, and gaming applications.
In 2024, the pressure sensors segment will be dominated by application type, widely deployed in sectors such as manufacturing, automotive, healthcare, and climate control systems. Their ability to deliver real-time, highly accurate data makes them vital for operations requiring tight monitoring and precise control across mission-critical systems.
North America Wireless Sensor Market held 32.2% share in 2024, driven by rapid advances in smart manufacturing and widespread deployment of low-power wireless technologies. Major sensor manufacturers are boosting R&D to focus on energy efficiency, edge computing, and protocol standardization. Recent expansions of wireless sensor networks in American cities have supported real-time environmental monitoring, improving data-driven decisions for urban planning and public health initiatives.
Key players in the Global Wireless Sensor Market include Honeywell International, Inc., Emerson Electric Co., Siemens AG, ABB Ltd., and Texas Instruments Incorporated. Leading companies are prioritizing investments in product innovation to develop ultra-low power and highly integrated sensor platforms that support edge computing. They are expanding strategic partnerships with industrial IoT providers to integrate sensors into end-to-end solutions. Firms are also entering new application verticals such as healthcare and smart agriculture to diversify market reach. Significant R&D budgets are being directed toward enhancing connectivity protocols and optimizing performance for real-time analytics. Many players are also strengthening global distribution networks and digital platforms to improve market penetration and after-sales support, while actively exploring mergers and collaborations to scale technological capabilities and geographic footprint.
Table of Contents
Chapter 1 Methodology and Scope
- 1.1 Market scope and definition
- 1.2 Research design
- 1.2.1 Research approach
- 1.2.2 Data collection methods
- 1.3 Data mining sources
- 1.3.1 Global
- 1.3.2 Regional/Country
- 1.4 Base estimates and calculations
- 1.4.1 Base year calculation
- 1.4.2 Key trends for market estimation
- 1.5 Primary research and validation
- 1.5.1 Primary sources
- 1.6 Forecast model
- 1.7 Research assumptions and limitations
Chapter 2 Executive Summary
- 2.1 Industry 3600 synopsis
- 2.2 Key market trends
- 2.2.1 Sensor type
- 2.2.2 Technology
- 2.2.3 Application
- 2.2.4 End use
- 2.2.5 Regional
- 2.3 TAM Analysis, 2025-2034 (USD Billion)
- 2.4 CXO perspectives: Strategic imperatives
- 2.4.1 Executive decision points
- 2.4.2 Critical success factors
- 2.5 Future outlook and strategic recommendations
Chapter 3 Industry Insights
- 3.1 Industry ecosystem analysis
- 3.1.1 Supplier landscape
- 3.1.2 Profit margin
- 3.1.3 Cost structure
- 3.1.4 Value addition at each stage
- 3.1.5 Factor affecting the value chain
- 3.1.6 Disruptions
- 3.2 Industry impact forces
- 3.2.1 Growth drivers
- 3.2.1.1 Rising adoption of energy-efficient technologies
- 3.2.1.2 Growing automotive industries worldwide
- 3.2.1.3 Growing industrial automation and Industry 4.0 adoption
- 3.2.1.4 Demand for remote monitoring and asset tracking
- 3.2.1.5 Rising investment in smart infrastructure worldwide
- 3.2.2 Industry pitfalls and challenges
- 3.2.2.1 Lack of standardization
- 3.2.2.2 Power and battery limitations
- 3.2.3 Market opportunities
- 3.2.3.1 Expansion of smart cities across the globe
- 3.2.3.2 Growth in precision agriculture
- 3.2.3.3 Healthcare and remote patient monitoring
- 3.2.3.4 Advancements in energy harvesting
- 3.2.1 Growth drivers
- 3.3 Growth potential analysis
- 3.4 Regulatory landscape
- 3.4.1 North America
- 3.4.2 Europe
- 3.4.3 Asia Pacific
- 3.4.4 Latin America
- 3.4.5 Middle East & Africa
- 3.5 Porter’s analysis
- 3.6 PESTEL analysis
- 3.7 Technology and innovation landscape
- 3.7.1 Current technological trends
- 3.7.2 Emerging technologies
- 3.8 Price trends
- 3.8.1 By region
- 3.8.2 By product
- 3.9 Pricing strategies
- 3.10 Emerging business models
- 3.11 Compliance requirements
- 3.12 Sustainability measures
- 3.13 Patent and IP analysis
- 3.14 Geopolitical and trade dynamics
Chapter 4 Competitive Landscape, 2024
- 4.1 Introduction
- 4.2 Company market share analysis
- 4.2.1 By region
- 4.2.1.1 North America
- 4.2.1.2 Europe
- 4.2.1.3 Asia Pacific
- 4.2.1.4 Latin America
- 4.2.1.5 MEA
- 4.2.2 Market concentration analysis
- 4.2.1 By region
- 4.3 Competitive benchmarking of key players
- 4.3.1 Financial performance comparison
- 4.3.1.1 Revenue
- 4.3.1.2 Profit margin
- 4.3.1.3 R&D
- 4.3.2 Product portfolio comparison
- 4.3.2.1 Product range breadth
- 4.3.2.2 Technology
- 4.3.2.3 Innovation
- 4.3.3 Geographic presence comparison
- 4.3.3.1 Global footprint analysis
- 4.3.3.2 Service network coverage
- 4.3.3.3 Market penetration by region
- 4.3.4 Competitive positioning matrix
- 4.3.4.1 Leaders
- 4.3.4.2 Challengers
- 4.3.4.3 Followers
- 4.3.4.4 Niche Players
- 4.3.5 Strategic outlook matrix
- 4.3.1 Financial performance comparison
- 4.4 Key developments, 2021-2024
- 4.4.1 Mergers and acquisitions
- 4.4.2 Partnerships and collaborations
- 4.4.3 Technological advancements
- 4.4.4 Expansion and investment strategies
- 4.4.5 Digital transformation initiatives
- 4.5 Emerging/ startup competitors landscape
Chapter 5 Market Estimates and Forecast, By Sensor Type, 2021 - 2034 (USD Million & Units)
- 5.1 Key trends
- 5.2 Biosensors
- 5.3 Temperature sensors
- 5.4 Pressure sensors
- 5.5 Humidity sensors
- 5.6 Gas / chemical sensors
- 5.7 Flow sensors
- 5.8 Level sensors
- 5.9 Motion & positioning sensors
- 5.10 Others
Chapter 6 Market Estimates & Forecast, By Technology, 2021-2034 (USD Million & Units)
- 6.1 Key trends
- 6.2 Bluetooth
- 6.3 Wi-Fi and WLAN
- 6.4 Zigbee
- 6.5 Wireless HART
- 6.6 RFID
- 6.7 EnOcean
- 6.8 Others
Chapter 7 Market Estimates & Forecast, By Application, 2021-2034 (USD Million & Units)
- 7.1 Key trends
- 7.2 Environmental monitoring
- 7.3 Asset tracking
- 7.4 Structural health monitoring
- 7.5 Energy management
- 7.6 Security and surveillance
- 7.7 Others
Chapter 8 Market Estimates & Forecast, By End Use, 2021-2034 (USD Million & Units)
- 8.1 Key trends
- 8.2 Automotive
- 8.3 Healthcare
- 8.4 Industrial
- 8.5 Consumer electronics
- 8.6 Agriculture
- 8.7 Aerospace & defense
- 8.8 Transportation & logistics
- 8.9 Others
Chapter 9 Market Estimates & Forecast, By Region, 2021 - 2034 (USD Million & Units)
- 9.1 Key trends
- 9.2 North America
- 9.2.1 U.S.
- 9.2.2 Canada
- 9.3 Europe
- 9.3.1 Germany
- 9.3.2 UK
- 9.3.3 France
- 9.3.4 Italy
- 9.3.5 Spain
- 9.3.6 Netherlands
- 9.4 Asia Pacific
- 9.4.1 China
- 9.4.2 India
- 9.4.3 Japan
- 9.4.4 Australia
- 9.4.5 South Korea
- 9.5 Latin America
- 9.5.1 Brazil
- 9.5.2 Mexico
- 9.5.3 Argentina
- 9.6 MEA
- 9.6.1 South Africa
- 9.6.2 Saudi Arabia
- 9.6.3 UAE
Chapter 10 Company Profiles
- 10.1 Global Key Players
- 10.1.1 Honeywell International
- 10.1.2 Texas Instruments Inc
- 10.1.3 Siemens AG
- 10.1.4 ABB Ltd.
- 10.1.5 Emerson Electric Co.
- 10.2 Regional Key Players
- 10.2.1 North America
- 10.2.1.1 Analog Devices Inc.
- 10.2.1.2 Cisco Systems Inc.
- 10.2.1.3 Monnit Corporation
- 10.2.2 Europe
- 10.2.2.1 STMicroelectronics N.V.
- 10.2.2.2 Infineon Technologies AG
- 10.2.2.3 TE Connectivity Ltd.
- 10.2.2.4 NXP Semiconductors N.V.
- 10.2.3 APAC
- 10.2.3.1 Yokogawa Electric Corporation
- 10.2.3.2 Huawei Investment Holding Co., Ltd.
- 10.2.3.3 Toshiba Corporation
- 10.2.3.4 Holykell Technology Co., Ltd.
- 10.2.1 North America
- 10.3 Niche Players / Disruptors
- 10.3.1 BAE Systems PLC
- 10.3.2 Phoenix Sensors LLC
- 10.3.3 IntelliSense.io
- 10.3.4 Inovonics Corporation
- 発行日
- 発行
- Global Market Insights Inc.
- ページ情報
- 英文 180 Pages
- 納期
- 2~3営業日


