
商用・産業用PVインバーターの市場機会、成長促進要因、産業動向分析、2025年~2034年予測
Commercial and Industrial PV Inverter Market Opportunity, Growth Drivers, Industry Trend Analysis, and Forecast 2025 - 2034- 発行日
- ページ情報
- 英文 123 Pages
- 納期
- 2~3営業日
- 商品コード
- 1766306
- カスタマイズ可能 お客様のご希望に応じて、既存データの加工や未掲載情報(例:国別セグメント)の追加などの対応が可能です。詳細はお問い合わせください。
- 翻訳ツール提供対象 PDF対応AI翻訳ツールの無料貸し出しサービスのご利用が可能です
概要
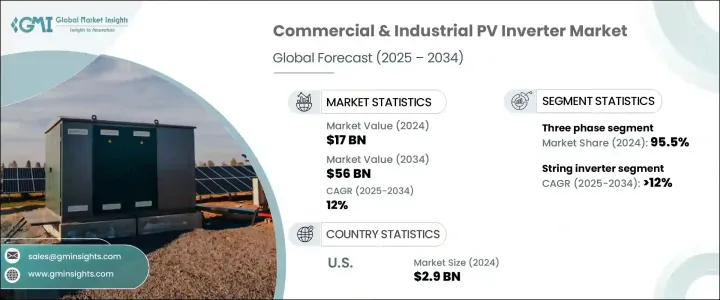
商用・産業用PVインバーターの世界市場規模は、2024年に170億米ドルとなり、CAGR 12%で成長し、2034年には560億米ドルに達すると推定されています。
この成長を促進する主な要因は、電力価格が不安定になり、企業がより予測可能で持続可能なエネルギー源を求めるようになったことです。商業施設や産業施設では、太陽光発電システムへの注目が高まっており、インバータは、太陽エネルギーの効率的な変換と日常業務への統合を確実にする上で重要な役割を果たしています。このシフトは主に、運用コストの削減、エネルギー効率の向上、持続可能性の基準の高まりへの対応を目的としています。
商業ビルや製造装置で電力需要が急増し続ける中、ソーラーインバータは、企業がエネルギー消費を最適化し、ピーク負荷を管理し、二酸化炭素削減目標を達成するのに役立つ重要なツールとして登場しました。よりスマートなエネルギーソリューションに対するニーズの高まりを反映し、ビルのエネルギー管理システムとの統合が一般的になりつつあります。企業は、コスト削減の動機だけでなく、環境への影響を削減しなければならないという圧力の高まりによっても動かされており、これがソーラーベースの技術への需要を強化しています。
| 市場範囲 | |
|---|---|
| 開始年 | 2024 |
| 予測年 | 2025-2034 |
| 開始金額 | 170億米ドル |
| 予測金額 | 560億米ドル |
| CAGR | 12% |
世界各国の政府や民間団体が再生可能エネルギーの導入に向け、より積極的な目標を掲げており、PVインバータの需要をさらに押し上げています。こうした目標は、太陽エネルギーへの移行を加速させることを目的とした有利な規制やインセンティブプログラムによって支えられています。ネットメータリングや再生可能エネルギークレジットなどの政策は、特に商業・産業用途において、太陽エネルギーソリューションの採用に前向きなビジネスケースを生み出し続けています。気候変動やエネルギー安全保障に対する意識が高まるにつれ、エネルギー自給を優先する企業が増えており、インバーターはその戦略に不可欠なものとなっています。加えて、コンパクトで高効率、低電圧のインバーターシステムが利用可能になりつつあることで、ソーラー技術がより幅広い用途で利用可能になり、スペースやインフラの制約を克服するのに役立っています。これは、不動産や設置スペースに余裕のない都市部で事業を展開する企業にとって特に重要です。
しかし、貿易関連の課題、特に輸入太陽電池部品に課される関税は、市場の勢いに若干の制約をもたらすと予想されます。太陽光発電設備の調達コストが上昇すれば、商業用・産業用の開発業者にとって、プロジェクトのスケジュールが遅れ、予算超過につながる可能性があります。こうした障壁は、特に競合価格の高性能インバーターの入手がすでに限られている場合には、サプライチェーンにも負担をかける可能性があります。こうした逆風にもかかわらず、産業用設備に合わせたインバーター技術への一貫した技術革新と投資により、市場全体の見通しは引き続き堅調です。
製品タイプ別に見ると、市場はストリングインバータ、マイクロインバータ、セントラルインバータに分けられます。ストリングインバータセグメントは、2034年までCAGR12%以上で拡大すると予測されます。このカテゴリーの需要は、主に設計、効率、システム拡張性の改善によって促進され、商業施設の屋上や中規模の産業用設備に好ましい選択肢となっています。太陽光発電プロジェクト開発者がより柔軟でモジュール化されたオプションを求める中、ストリングインバータは様々な導入規模においてますます普及しています。
市場セグメンテーションでは、相構成の観点から単相システムと三相システムに区分されています。三相セグメントは2024年の世界市場シェアの95.5%を占め、工場団地、倉庫、マルチテナント型商業ビルなどの大規模アプリケーションでの利用の拡大に支えられています。三相インバーターは、大電力負荷の処理効率が高く、グリッドシステムとの統合に適しているため、大規模設備に最適です。
地域別では米国が主要市場として浮上しており、商用・産業用PVインバーター産業は2023年の25億米ドル、2022年の22億米ドルから2024年には29億米ドルに達します。北米は2024年時点で世界市場の17.3%のシェアを占めており、予測期間終了までにはこのシェアが上昇すると予想されます。堅調な国内製造基盤と迅速な納期が、米国の商業用および産業用設備におけるインバーター普及を加速させています。
大手メーカーは、生産能力の拡大、研究開発、高性能アプリケーション用に設計された先進インバータの発売などに多額の投資を行っています。これらの企業はまた、迅速な対応と現地でのより良いサービスを可能にする戦略的パートナーシップと流通ネットワークを通じて、世界なリーチを広げています。特に大規模な商業用・産業用プロジェクトを確保するために、太陽光発電デベロッパーだけでなく、エンジニアリング・調達・建設会社との共同開発も一般的になっています。現地での製造とサポートサービスは、高い成長が見込まれる市場において、引き続き重要な差別化要因となっています。
目次
第1章 調査手法と範囲
第2章 エグゼクティブサマリー
第3章 業界考察
- 業界エコシステム
- トランプ政権の関税分析
- 貿易への影響
- 貿易量の混乱
- 報復措置
- 業界への影響
- 供給側の影響(原材料)
- 主要原材料の価格変動
- サプライチェーンの再構築
- 生産コストへの影響
- 需要側の影響(販売価格)
- 最終市場への価格伝達
- 市場シェアの動向
- 消費者の反応パターン
- 供給側の影響(原材料)
- 影響を受ける主要企業
- 戦略的な業界対応
- サプライチェーンの再構成
- 価格設定と製品戦略
- 政策関与
- 展望と今後の検討事項
- 貿易への影響
- 規制情勢
- 業界への影響要因
- 促進要因
- 業界の潜在的リスク&課題
- 成長可能性分析
- ポーター分析
- PESTEL分析
第4章 競合情勢
- イントロダクション
- 企業の市場シェア
- 戦略的ダッシュボード
- 戦略的取り組み
- 競合ベンチマーキング
- イノベーションと持続可能性の情勢
第5章 市場規模・予測:製品別、2021年~2034年
- 主要動向
- ストリング
- マイクロ
- セントラル
第6章 市場規模・予測:フェーズ別、2021年~2034年
- 主要動向
- 単相
- 三相
第7章 市場規模・予測:接続性別、2021年~2034年
- 主要動向
- スタンドアロン
- グリッド
第8章 市場規模・予測:地域別、2021年~2034年
- 主要動向
- 北米
- 米国
- カナダ
- 欧州
- ドイツ
- イタリア
- ポーランド
- オランダ
- オーストリア
- 英国
- フランス
- アジア太平洋地域
- 中国
- オーストラリア
- インド
- 日本
- 韓国
- 中東・アフリカ
- イスラエル
- サウジアラビア
- アラブ首長国連邦
- 南アフリカ
- ラテンアメリカ
- ブラジル
- メキシコ
- チリ
第9章 企業プロファイル
- Canadian Solar
- Delta Electronics
- Darfon Electronics
- Eaton
- Fimer Group
- Ginlong Technologies
- GoodWe
- Growatt New Energy
- Huawei Technologies
- Schneider Electric
- SMA Solar Technology
- Sungrow
- SolarEdge Technologies
- Sineng Electric
- Tabuchi Electric
目次
The Global Commercial and Industrial PV Inverter Market was valued at USD 17 billion in 2024 and is estimated to grow at a CAGR of 12% to reach USD 56 billion by 2034. A major factor driving this growth is the rising instability in electricity prices, prompting businesses to seek more predictable and sustainable energy sources. Commercial and industrial facilities are increasingly turning to solar photovoltaic systems, with inverters playing a crucial role in ensuring the effective conversion and integration of solar energy into everyday operations. This shift is primarily aimed at reducing operational costs, improving energy efficiency, and meeting rising sustainability standards.
As power demands continue to surge across commercial buildings and manufacturing units, solar inverters have emerged as vital tools to help companies optimize their energy consumption, manage peak loads, and meet carbon reduction goals. Their integration with building energy management systems is becoming more common, reflecting the rising need for smarter energy solutions. Companies are not only driven by cost-saving motives but also by mounting pressure to reduce their environmental impact, which is reinforcing the demand for solar-based technologies.
| Market Scope | |
|---|---|
| Start Year | 2024 |
| Forecast Year | 2025-2034 |
| Start Value | $17 Billion |
| Forecast Value | $56 Billion |
| CAGR | 12% |
Governments and private organizations worldwide are setting more aggressive targets for renewable energy adoption, further fueling demand for PV inverters. These goals are supported by favorable regulations and incentive programs aimed at accelerating the shift to solar energy. Policies such as net metering and renewable energy credits continue to create a positive business case for adopting solar energy solutions, especially in commercial and industrial applications. As awareness of climate change and energy security rises, more enterprises are prioritizing energy independence, and inverters are becoming an essential part of that strategy. In addition, the growing availability of compact, high-efficiency, low-voltage inverter systems is making solar technology more viable for a wider range of applications, helping businesses overcome space and infrastructure limitations. This is particularly important for companies operating in urban areas where real estate and installation space come at a premium.
However, trade-related challenges, particularly tariffs imposed on imported solar components, are expected to pose some limitations on the market's momentum. Increased procurement costs for solar equipment can delay project timelines and result in budget overruns for commercial and industrial developers. These barriers could also strain the supply chain, especially when the availability of competitively priced high-performance inverters is already limited. Despite these headwinds, the overall outlook for the market remains strong due to consistent innovation and investments in inverter technology tailored for industrial-grade installations.
Based on product type, the market is divided into string, micro, and central inverters. The string inverter segment is projected to expand at a CAGR exceeding 12% through 2034. Demand for this category is primarily fueled by improvements in design, efficiency, and system scalability, making it a preferred choice for commercial rooftops and mid-sized industrial installations. As solar project developers seek more flexible and modular options, string inverters are becoming increasingly popular across various deployment scales.
In terms of phase configuration, the commercial and industrial PV inverter market is segmented into single phase and three phase systems. The three phase segment accounted for 95.5% of the global market share in 2024, supported by its growing use in large-scale applications such as factory complexes, warehouses, and multi-tenant commercial buildings. Three phase inverters are more efficient for handling high power loads and are better suited for integration with grid systems, which makes them ideal for large-scale installations.
Regionally, the United States has emerged as a key market, with its commercial and industrial PV inverter industry reaching USD 2.9 billion in 2024, up from USD 2.5 billion in 2023 and USD 2.2 billion in 2022. North America held a 17.3% share of the global market in 2024, and this is expected to increase by the end of the forecast period. A robust domestic manufacturing base and faster delivery timelines are helping to accelerate inverter adoption across commercial and industrial installations in the U.S. Market growth is also being reinforced by government-backed initiatives that promote clean energy and reward the use of domestically produced components.
Leading manufacturers are investing heavily in capacity expansion, research and development, and the launch of advanced inverters designed for high-performance applications. These companies are also extending their global reach through strategic partnerships and distribution networks that enable quicker response times and better local service. Collaborations with engineering, procurement, and construction firms, as well as solar developers, have become common, especially for securing large-scale commercial and industrial projects. Local manufacturing and support services continue to be key differentiators in markets with high growth potential.
Table of Contents
Chapter 1 Methodology & Scope
- 1.1 Research design
- 1.2 Base estimates & calculations
- 1.3 Forecast calculation
- 1.4 Primary research & validation
- 1.4.1 Primary sources
- 1.4.2 Data mining sources
- 1.5 Market definitions
Chapter 2 Executive Summary
- 2.1 Industry synopsis, 2021 - 2034
Chapter 3 Industry Insights
- 3.1 Industry ecosystem
- 3.2 Trump administration tariff analysis
- 3.2.1 Impact on trade
- 3.2.1.1 Trade volume disruptions
- 3.2.1.2 Retaliatory measures
- 3.2.2 Impact on the industry
- 3.2.2.1 Supply-side impact (raw materials)
- 3.2.2.1.1 Price volatility in key materials
- 3.2.2.1.2 Supply chain restructuring
- 3.2.2.1.3 Production cost implications
- 3.2.2.2 Demand-side impact (selling price)
- 3.2.2.2.1 Price transmission to end markets
- 3.2.2.2.2 Market share dynamics
- 3.2.2.2.3 Consumer response patterns
- 3.2.2.1 Supply-side impact (raw materials)
- 3.2.3 Key companies impacted
- 3.2.4 Strategic industry responses
- 3.2.4.1 Supply chain reconfiguration
- 3.2.4.2 Pricing and product strategies
- 3.2.4.3 Policy engagement
- 3.2.5 Outlook and future considerations
- 3.2.1 Impact on trade
- 3.3 Regulatory landscape
- 3.4 Industry impact forces
- 3.4.1 Growth drivers
- 3.4.2 Industry pitfalls & challenges
- 3.5 Growth potential analysis
- 3.6 Porter's analysis
- 3.6.1 Bargaining power of suppliers
- 3.6.2 Bargaining power of buyers
- 3.6.3 Threat of new entrants
- 3.6.4 Threat of substitutes
- 3.7 PESTEL analysis
Chapter 4 Competitive landscape, 2024
- 4.1 Introduction
- 4.2 Company market share
- 4.3 Strategic dashboard
- 4.4 Strategic initiative
- 4.5 Competitive benchmarking
- 4.6 Innovation & sustainability landscape
Chapter 5 Market Size and Forecast, By Product, 2021 - 2034 (USD Billion & MW)
- 5.1 Key trends
- 5.2 String
- 5.3 Micro
- 5.4 Central
Chapter 6 Market Size and Forecast, By Phase, 2021 - 2034 (USD Billion & MW)
- 6.1 Key trends
- 6.2 Single phase
- 6.3 Three phase
Chapter 7 Market Size and Forecast, By Connectivity, 2021 - 2034 (USD Billion & MW)
- 7.1 Key trends
- 7.2 Standalone
- 7.3 On grid
Chapter 8 Market Size and Forecast, By Region, 2021 - 2034 (USD Billion & MW)
- 8.1 Key trends
- 8.2 North America
- 8.2.1 U.S.
- 8.2.2 Canada
- 8.3 Europe
- 8.3.1 Germany
- 8.3.2 Italy
- 8.3.3 Poland
- 8.3.4 Netherlands
- 8.3.5 Austria
- 8.3.6 UK
- 8.3.7 France
- 8.4 Asia Pacific
- 8.4.1 China
- 8.4.2 Australia
- 8.4.3 India
- 8.4.4 Japan
- 8.4.5 South Korea
- 8.5 Middle East & Africa
- 8.5.1 Israel
- 8.5.2 Saudi Arabia
- 8.5.3 UAE
- 8.5.4 South Africa
- 8.6 Latin America
- 8.6.1 Brazil
- 8.6.2 Mexico
- 8.6.3 Chile
Chapter 9 Company Profiles
- 9.1 Canadian Solar
- 9.2 Delta Electronics
- 9.3 Darfon Electronics
- 9.4 Eaton
- 9.5 Fimer Group
- 9.6 Ginlong Technologies
- 9.7 GoodWe
- 9.8 Growatt New Energy
- 9.9 Huawei Technologies
- 9.10 Schneider Electric
- 9.11 SMA Solar Technology
- 9.12 Sungrow
- 9.13 SolarEdge Technologies
- 9.14 Sineng Electric
- 9.15 Tabuchi Electric
- 発行日
- 発行
- Global Market Insights Inc.
- ページ情報
- 英文 123 Pages
- 納期
- 2~3営業日