
飲料香料システムの市場機会、成長促進要因、産業動向分析、2025年~2034年予測
Beverage Flavoring System Market Opportunity, Growth Drivers, Industry Trend Analysis, and Forecast 2025 - 2034- 発行日
- ページ情報
- 英文 245 Pages
- 納期
- 2~3営業日
- 商品コード
- 1755366
- カスタマイズ可能 お客様のご希望に応じて、既存データの加工や未掲載情報(例:国別セグメント)の追加などの対応が可能です。詳細はお問い合わせください。
- 翻訳ツール提供対象 PDF対応AI翻訳ツールの無料貸し出しサービスのご利用が可能です
概要
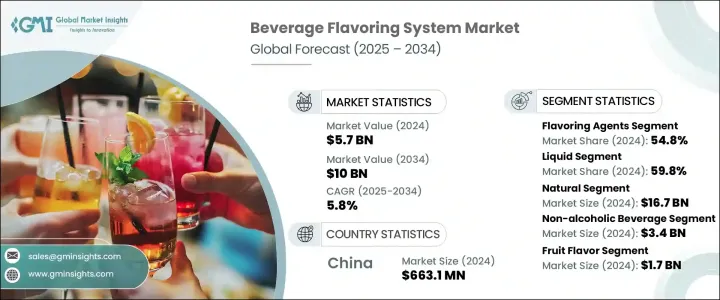
飲料香料システムの世界市場規模は2024年に57億米ドルとなり、CAGR 5.8%で成長し、2034年には100億米ドルに達すると予測されています。
この市場は、消費者の嗜好の進化、革新的な技術、飲料用途の多様化によってダイナミックな変化を遂げつつあります。飲料メーカーが製品の魅力を高め、差別化を図る中で、フレーバー・システムは、一貫した味、香り、視覚的インパクトを提供するための重要な要素として浮上しています。清涼飲料、機能性飲料、乳飲料など、飲料セクターのあらゆるカテゴリーで、市場の需要に応えるため、カスタマイズされたフレーバー・システムに大きく依存しています。
健康とウェルネスに関する消費者の幅広い意識を反映して、ナチュラルでクリーンラベルの香料ソリューションへのシフトが進んでいます。植物由来、非遺伝子組み換え、有機栽培の風味原料に対する嗜好の高まりは、メーカーに植物性注入物、エッセンシャルオイル、発酵由来の風味のような天然成分の採用を促しています。これらの要素は、現在の健康動向に合致しているだけでなく、より明確な表示をサポートし、今日の情報通の消費者の共感を呼んでいます。飲料香料システム市場は、絶え間ない技術革新、研究開発活動の活発化、世界・フレーバー・ハウス間の競争の激化によって牽引されています。これらのプレーヤーは、飲料ブランドと戦略的提携を結び、新しい配合技術を活用して、混雑したマーケットプレースで際立つユニークなフレーバープロファイルを創出しています。
| 市場範囲 | |
|---|---|
| 開始年 | 2024年 |
| 予測年 | 2025年~2034年 |
| 開始金額 | 57億米ドル |
| 予測金額 | 100億米ドル |
| CAGR | 5.8% |
成分タイプ別では、香料が2024年に54.8%の圧倒的な市場シェアでセグメントをリードし、2034年までのCAGRは5.7%と予測されます。業界における香料の優位性は、飲料の官能特性を形成する上で不可欠な役割を担っていることに起因しています。これらの薬剤は、特徴的な味覚体験を提供し、本物志向の消費者の需要に応え、製品のアイデンティティを高めるために不可欠です。斬新で自然な味を求める消費者が増え続ける中、香料は従来の飲料形態から新たな飲料形態まで幅広く使用されています。
形態別では、液体形態が2024年に59.8%と最大のシェアを占め、CAGR 5.7%と勢いを維持すると予想されています。液体フレーバー・システムの成功は、その統合のしやすさ、配合における均一な分布、費用対効果によるところが大きいです。その適応性により、メーカーは変化するフレーバー動向に迅速に対応し、生産プロセスを合理化し、運用コストを削減することができます。大規模製造であれ、少量生産であれ、リキッド・フレーバー・システムは比類のない一貫性と処理効率を提供します。
起源別にセグメント化すると、天然フレーバー分野は2024年に167億米ドルの大幅な評価額で際立っています。この優位性は、健康志向のクリーンラベル飲料の人気の高まりを反映しています。消費者が合成成分に対する警戒心を強める中、天然フレーバーはその透明性、信頼性、認識される健康上の利点から支持を集めています。飲料メーカー各社は、健康志向の消費者層にアピールするため、天然フレーバーを強調するよう製品を改良しています。コストと原料調達に関する課題にもかかわらず、天然香料はプレミアム飲料と機能性飲料のカテゴリーで特に支持されており、市場での主導的地位を強化しています。
飲料の種類別では、ノンアルコール飲料が最大の貢献者に浮上し、2024年の市場規模は34億米ドルとなりました。このセグメントの存在感が強いのは、1日の消費率が高いこと、製品の種類が豊富なこと、幅広い消費者層がいることによる。水分補給製品からエネルギー増強製剤まで、ノンアルコール・カテゴリーでは消費者の関心を維持するため、常に革新的な風味ソリューションが求められています。一方、アルコール飲料は、市場規模こそ小さいもの、プレミアム・フレーバー付きアルコール飲料への需要の高まりに後押しされ、顕著な成長を遂げています。
フレーバーの種類では、フルーツフレーバーがカテゴリーをリードし、2024年には17億米ドルを占める。これらのフレーバーは、ウェルネスとの自然な関連性、様々なタイプの飲料との幅広い適合性、コスト効率の高さから、引き続き優位を占めています。フルーツ・フレーバーの多用途性は、単独での用途と複雑なブレンドの両方を可能にし、ユニークで爽やかな味覚体験を提供することを目指すメーカーに好まれています。
地域別では、中国がアジア太平洋の飲料香料システム市場をリードしており、2024年の市場規模は6億6,310万米ドルで、2034年までのCAGRは5.6%と予測されています。同国の大規模な消費者基盤、都市部の拡大、フレーバー飲料や機能性飲料への嗜好の高まりがこの成長を後押ししています。強力な国内製造能力と有利な食品安全規制が、中国の地位をさらに強化しています。消費者の需要が健康志向で風味豊かな飲料にシフトし続ける中、中国はこの地域における技術革新と生産の中心的な拠点であり続けています。
世界のフレーバーシステムプロバイダーは、その技術的専門知識、多様な製品ライン、広範な流通網を活用して、増大する需要を取り込もうとしています。その競争力は、迅速な適応能力、技術革新への多額の投資、複数の地域で一貫した品質を提供する能力にあります。
目次
第1章 調査手法
- 市場の範囲と定義
- 調査デザイン
- 調査アプローチ
- データ収集方法
- データマイニングソース
- 世界
- 地域/国
- 基本推定と計算
- 基準年計算
- 市場予測の主な動向
- 1次調査と検証
- 一次情報
- 予測モデル
- 調査の前提と限界
第2章 エグゼクティブサマリー
第3章 業界考察
- エコシステム分析
- サプライヤーの情勢
- 利益率
- 各段階での付加価値
- バリューチェーンに影響を与える要因
- ディスラプション
- 業界への影響要因
- 促進要因
- 業界の潜在的リスク&課題
- 市場機会
- 成長可能性分析
- 規制情勢
- 北米
- 欧州
- アジア太平洋地域
- ラテンアメリカ
- 中東・アフリカ
- ポーター分析
- PESTEL分析
- 価格動向
- 地域別
- 製品別
- 将来の市場動向
- テクノロジーとイノベーションの情勢
- 現在の技術動向
- 新興技術
- 特許情勢
- 貿易統計(HSコード)(注:貿易統計は主要国のみ提供されます)
- 主要輸入国
- 主要輸出国
- 持続可能性と環境側面
- 持続可能な慣行
- 廃棄物削減戦略
- 生産におけるエネルギー効率
- 環境に優しい取り組み
- 新たな動向と将来の見通し
- 技術革新
- フレーバー開発におけるAIと機械学習
- 高度なカプセル化技術
- フレーバー生産におけるバイオテクノロジー
- 消費者の嗜好の進化
- クリーンラベル運動
- 機能性フレーバー
- 世界各国のエキゾチックなフレーバー
- 健康とウェルネスの動向
- 砂糖を減らす解決策
- 免疫力を高めるフレーバー
- アダプトゲンと向知性フレーバー
- パーソナライゼーションとカスタマイズ
- フレーバー業界におけるデジタル変革
- 代替飲料カテゴリーとの統合
- 植物由来飲料
- 低アルコール飲料/ノンアルコール飲料
- 機能性飲料
- 将来の市場潜在力
- 投資機会
- 技術革新
第4章 競合情勢
- イントロダクション
- 企業の市場シェア分析
- 地域別
- 北米
- 欧州
- アジア太平洋
- ラテンアメリカ
- 中東・アフリカ
- 地域別
- 企業マトリックス分析
- 主要市場企業の競合分析
- 競合ポジショニングマトリックス
- 主な発展
- 合併と買収
- パートナーシップとコラボレーション
- 新製品の発売
- 拡張計画
第5章 市場推計・予測:成分別、2021年~2034年
- 主な傾向
- 香料
- 天然香料
- フルーツフレーバー
- 植物風味
- スパイスとハーブの風味
- ナッツと種子の風味
- その他
- 人工香料
- フルーツミミック
- 甘い味
- 風味豊かな味
- その他
- 天然と同一のフレーバー
- 天然香料
- フレーバーキャリア
- プロピレングリコール
- エタノール
- 植物油
- その他
- 風味増強剤
- 酸味料
- 甘味料
- その他
- 風味調整剤
第6章 市場推計・予測:形態別、2021年~2034年
- 主な傾向
- 液体
- エマルジョン
- ソリューション
- サスペンション
- ドライ
- スプレー乾燥
- フリーズドライ
- カプセル化
- その他
第7章 市場推計・予測:由来別、2021年~2034年
- 主な傾向
- 天然
- 植物由来
- 動物由来
- 人工
- 天然同一
第8章 市場推計・予測:飲料タイプ別、2021年~2034年
- 主な傾向
- アルコール飲料
- ビール
- ワイン
- スピリッツ
- RTD(レディ・トゥ・ドリンク)アルコール飲料
- その他
- ノンアルコール飲料
- 炭酸飲料
- ジュースとネクター
- エナジードリンク
- スポーツドリンク
- RTD(レディ・トゥ・ドリンク)の紅茶とコーヒー
- フレーバーウォーター
- 乳製品ベースの飲料
- 植物由来飲料
- その他
第9章 市場推計・予測:フレーバータイプ別、2021年~2034年
- 主な傾向
- フルーツフレーバー
- ベリー
- 柑橘類
- トロピカル
- 核果
- その他
- チョコレートとバニラ
- コーヒーと紅茶
- スパイスとハーブ
- 花の香り
- ナッツと種子の風味
- ミントとメントール
- 甘い味
- 風味豊かな味
- その他
第10章 市場推計・予測:地域別、2021年~2034年
- 主要動向
- 北米
- 米国
- カナダ
- 欧州
- ドイツ
- 英国
- フランス
- イタリア
- スペイン
- その他の欧州
- アジア太平洋
- 中国
- インド
- 日本
- オーストラリア
- 韓国
- その他のアジア太平洋
- ラテンアメリカ
- ブラジル
- メキシコ
- アルゼンチン
- その他のラテンアメリカ
- 中東・アフリカ
- サウジアラビア
- 南アフリカ
- アラブ首長国連邦
- その他の中東・アフリカ
第11章 企業プロファイル
- Givaudan SA
- International Flavors &Fragrances Inc.(IFF)
- DSM
- Symrise AG
- Sensient Technologies Corporation
- Kerry Group plc
- Archer Daniels Midland Company(ADM)
- Tate &Lyle PLC
- Cargill, Incorporated
- MANE SA
- McCormick &Company, Inc.
- Takasago International Corporation
- T. Hasegawa Co., Ltd.
- Robertet Group
- Kalsec Inc.
目次
The Global Beverage Flavoring System Market was valued at USD 5.7 billion in 2024 and is estimated to grow at a CAGR of 5.8% to reach USD 10 billion by 2034. This market is undergoing a dynamic transformation fueled by evolving consumer preferences, innovative technologies, and the increasing diversity of beverage applications. As beverage producers strive to enhance product appeal and differentiate offerings, flavor systems have emerged as a critical component in delivering consistent taste, aroma, and visual impact. Every category within the beverage sector-whether it's soft drinks, functional beverages, or dairy-based drinks-relies heavily on tailored flavoring systems to meet market demands.
There is an ongoing shift towards natural and clean-label flavoring solutions, reflecting broader consumer awareness around health and wellness. The rising preference for plant-based, non-GMO, and organically sourced flavor ingredients is encouraging manufacturers to adopt natural components like botanical infusions, essential oils, and fermentation-derived flavors. These elements not only align with current health trends but also support clearer labeling, which further resonates with today's informed consumers. The beverage flavoring system market is driven by constant innovation, increased R&D activity, and heightened competition among global flavor houses. These players are forming strategic collaborations with beverage brands and leveraging new formulation technologies to create unique flavor profiles that stand out in a crowded marketplace.
| Market Scope | |
|---|---|
| Start Year | 2024 |
| Forecast Year | 2025-2034 |
| Start Value | $5.7 Billion |
| Forecast Value | $10 Billion |
| CAGR | 5.8% |
By ingredient type, flavoring agents led the segment with a commanding 54.8% market share in 2024 and are projected to grow at a CAGR of 5.7% through 2034. Their stronghold in the industry stems from their essential role in shaping the sensory characteristics of beverages. These agents are integral to delivering signature taste experiences, meeting consumer demand for authenticity, and elevating product identity. As the appetite for novel and natural taste options continues to grow, flavoring agents are seeing widespread application across both conventional and emerging beverage formats.
In terms of form, liquid forms accounted for the largest share at 59.8% in 2024 and are anticipated to maintain momentum with a 5.7% CAGR. The success of liquid flavor systems is largely due to their ease of integration, uniform distribution in formulations, and cost-effectiveness. Their adaptability allows manufacturers to respond quickly to changing flavor trends, streamline production processes, and reduce operational costs. Whether it's large-scale manufacturing or small-batch production, liquid flavor systems offer unmatched consistency and processing efficiency.
When segmented by origin, the natural flavor segment stood out with a significant valuation of USD 16.7 billion in 2024. This dominance reflects the increasing popularity of health-forward, clean-label beverages. As consumers grow more cautious about synthetic ingredients, natural flavors have gained favor for their transparency, authenticity, and perceived health benefits. Beverage producers are reformulating products to emphasize natural claims, appealing to the wellness-oriented segment. Despite challenges around cost and raw material sourcing, natural flavors are particularly favored in premium and functional beverage categories, reinforcing their leading market position.
Based on beverage type, non-alcoholic drinks emerged as the largest contributor, holding a market size of USD 3.4 billion in 2024. The strong presence of this segment is attributed to high daily consumption rates, product variety, and a broad consumer base. From hydration products to energy-enhancing formulations, the non-alcoholic category consistently demands innovative flavor solutions to maintain consumer interest. On the other hand, alcoholic beverages, though smaller in market size, are witnessing notable growth fueled by rising demand for premium, flavored alcoholic drinks.
Regarding flavor types, fruit flavors led the category, accounting for USD 1.7 billion in 2024. These flavors continue to dominate due to their natural association with wellness, wide compatibility with various beverage types, and cost-efficiency. The versatility of fruit flavors allows for both standalone applications and complex blends, making them a favorite among manufacturers aiming to deliver unique and refreshing taste experiences.
Regionally, China leads the Asia Pacific beverage flavoring system market with a market value of USD 663.1 million in 2024 and is projected to grow at a CAGR of 5.6% through 2034. The country's large consumer base, urban expansion, and increasing appetite for flavored and functional drinks are fueling this growth. Strong domestic manufacturing capabilities and favorable food safety regulations have further strengthened China's position. As consumer demand continues to shift toward health-conscious and flavor-rich beverage options, China remains a central hub for innovation and production in the region.
Global flavor system providers are leveraging their technical expertise, diverse product lines, and expansive distribution networks to tap into the growing demand. Their competitive edge lies in their ability to adapt quickly, invest heavily in innovation, and offer consistent quality across multiple regions.
Table of Contents
Chapter 1 Methodology
- 1.1 Market scope and definition
- 1.2 Research design
- 1.2.1 Research approach
- 1.2.2 Data collection methods
- 1.3 Data mining sources
- 1.3.1 Global
- 1.3.2 Regional/Country
- 1.4 Base estimates and calculations
- 1.4.1 Base year calculation
- 1.4.2 Key trends for market estimation
- 1.5 Primary research and validation
- 1.5.1 Primary sources
- 1.6 Forecast model
- 1.7 Research assumptions and limitations
Chapter 2 Executive Summary
- 2.1 Industry 3600 synopsis
- 2.2 Key market trends
- 2.2.1 Regional
- 2.2.2 Ingredient type
- 2.2.3 Form
- 2.2.4 Origin
- 2.2.5 Beverage type
- 2.2.6 Flavor type
- 2.3 TAM Analysis, 2025-2034
- 2.4 CXO perspectives: Strategic imperatives
- 2.4.1 Executive decision points
- 2.4.2 Critical success factors
- 2.5 Future Outlook and Strategic Recommendations
Chapter 3 Industry Insights
- 3.1 Industry ecosystem analysis
- 3.1.1 Supplier landscape
- 3.1.2 Profit margin
- 3.1.3 Value addition at each stage
- 3.1.4 Factor affecting the value chain
- 3.1.5 Disruptions
- 3.2 Industry impact forces
- 3.2.1 Growth drivers
- 3.2.2 Industry pitfalls and challenges
- 3.2.3 Market opportunities
- 3.3 Growth potential analysis
- 3.4 Regulatory landscape
- 3.4.1 North America
- 3.4.2 Europe
- 3.4.3 Asia Pacific
- 3.4.4 Latin America
- 3.4.5 Middle East & Africa
- 3.5 Porter's analysis
- 3.6 PESTEL analysis
- 3.6.1 Technology and innovation landscape
- 3.6.2 Current technological trends
- 3.6.3 Emerging technologies
- 3.7 Price trends
- 3.7.1 By region
- 3.7.2 By product
- 3.8 Future market trends
- 3.9 Technology and Innovation landscape
- 3.9.1 Current technological trends
- 3.9.2 Emerging technologies
- 3.10 Patent Landscape
- 3.11 Trade statistics (HS code) ( Note: the trade statistics will be provided for key countries only )
- 3.11.1 Major importing countries
- 3.11.2 Major exporting countries
- 3.12 Sustainability and environmental aspects
- 3.12.1 Sustainable practices
- 3.12.2 Waste reduction strategies
- 3.12.3 Energy efficiency in production
- 3.12.4 Eco-friendly initiatives
- 3.13 Emerging trends and future outlook
- 3.13.1 Technological innovations
- 3.13.1.1 Ai and machine learning in flavor development
- 3.13.1.2 Advanced encapsulation technologies
- 3.13.1.3 Biotechnology in flavor production
- 3.13.2 Consumer preference evolution
- 3.13.2.1 Clean label movement
- 3.13.2.2 Functional flavors
- 3.13.2.3 Global and exotic flavor profiles
- 3.13.3 Health and wellness trends
- 3.13.4 Sugar reduction solutions
- 3.13.5 Immunity-boosting flavors
- 3.13.6 Adaptogenic and nootropic flavors
- 3.13.7 Personalization and customization
- 3.13.8 Digital transformation in flavor industry
- 3.13.9 Integration with alternative beverage categories
- 3.13.9.1 Plant-based beverages
- 3.13.9.2 Low/no-alcohol beverages
- 3.13.9.3 Functional beverages
- 3.13.10 Future market potential
- 3.13.11 Investment opportunities
- 3.13.1 Technological innovations
Chapter 4 Competitive Landscape, 2024
- 4.1 Introduction
- 4.2 Company market share analysis
- 4.2.1 By region
- 4.2.1.1 North America
- 4.2.1.2 Europe
- 4.2.1.3 Asia Pacific
- 4.2.1.4 LATAM
- 4.2.1.5 MEA
- 4.2.1 By region
- 4.3 Company matrix analysis
- 4.4 Competitive analysis of major market players
- 4.5 Competitive positioning matrix
- 4.6 Key developments
- 4.6.1 Mergers & acquisitions
- 4.6.2 Partnerships & collaborations
- 4.6.3 New product launches
- 4.6.4 Expansion plans
Chapter 5 Market Estimates & Forecast, By Ingredient Type, 2021 - 2034 (USD Million) (Kilo Tons)
- 5.1 Key trend
- 5.2 Flavoring agents
- 5.2.1 Natural flavors
- 5.2.1.1 Fruit flavors
- 5.2.1.2 Botanical flavors
- 5.2.1.3 Spice and herb flavors
- 5.2.1.4 Nut and seed flavors
- 5.2.1.5 Others
- 5.2.2 Artificial flavors
- 5.2.2.1 Fruit mimics
- 5.2.2.2 Sweet flavors
- 5.2.2.3 Savory flavors
- 5.2.2.4 Others
- 5.2.3 Nature-identical flavors
- 5.2.1 Natural flavors
- 5.3 Flavor carriers
- 5.3.1 Propylene glycol
- 5.3.2 Ethanol
- 5.3.3 Vegetable oils
- 5.3.4 Others
- 5.4 Flavor enhancers
- 5.4.1 Acidulants
- 5.4.2 Sweeteners
- 5.4.3 Others
- 5.5 Flavor modifiers
Chapter 6 Market Estimates & Forecast, By Form, 2021 - 2034 (USD Million) (Kilo Tons)
- 6.1 Key trend
- 6.2 Liquid
- 6.2.1 Emulsions
- 6.2.2 Solutions
- 6.2.3 Suspensions
- 6.3 Dry
- 6.3.1 Spray-dried
- 6.3.2 Freeze-dried
- 6.3.3 Encapsulated
- 6.3.4 Others
Chapter 7 Market Estimates & Forecast, By Origin, 2021 - 2034 (USD Million) (Kilo Tons)
- 7.1 Key trend
- 7.2 Natural
- 7.2.1 Plant-based
- 7.2.2 Animal-derived
- 7.3 Artificial
- 7.4 Nature-identical
Chapter 8 Market Estimates & Forecast, By Beverage Type, 2021 - 2034 (USD Million) (Kilo Tons)
- 8.1 Key trend
- 8.2 Alcoholic beverages
- 8.2.1 Beer
- 8.2.2 Wine
- 8.2.3 Spirits
- 8.2.4 Ready-to-Drink (RTD) alcoholic beverages
- 8.2.5 Others
- 8.3 Non-alcoholic beverages
- 8.3.1 Carbonated soft drinks
- 8.3.2 Juices and nectars
- 8.3.3 Energy drinks
- 8.3.4 Sports drinks
- 8.3.5 Ready-to-Drink (RTD) tea and coffee
- 8.3.6 Flavored water
- 8.3.7 Dairy-based beverages
- 8.3.8 Plant-based beverages
- 8.3.9 Others
Chapter 9 Market Estimates & Forecast, By Flavor Type, 2021 - 2034 (USD Million) (Kilo Tons)
- 9.1 Key trend
- 9.2 Fruit flavors
- 9.2.1 Berries
- 9.2.2 Citrus
- 9.2.3 Tropical
- 9.2.4 Stone fruits
- 9.2.5 Others
- 9.3 Chocolate and vanilla
- 9.4 Coffee and tea
- 9.5 Spices and herbs
- 9.6 Floral flavors
- 9.7 Nut and seed flavors
- 9.8 Mint and menthol
- 9.9 Sweet flavors
- 9.10 Savory flavors
- 9.11 Others
Chapter 10 Market Estimates & Forecast, By Region, 2021 - 2034 (USD Million) (Kilo Tons)
- 10.1 Key trends
- 10.2 North America
- 10.2.1 U.S.
- 10.2.2 Canada
- 10.3 Europe
- 10.3.1 Germany
- 10.3.2 UK
- 10.3.3 France
- 10.3.4 Italy
- 10.3.5 Spain
- 10.3.6 Rest of Europe
- 10.4 Asia Pacific
- 10.4.1 China
- 10.4.2 India
- 10.4.3 Japan
- 10.4.4 Australia
- 10.4.5 South Korea
- 10.4.6 Rest of Asia Pacific
- 10.5 Latin America
- 10.5.1 Brazil
- 10.5.2 Mexico
- 10.5.3 Argentina
- 10.5.4 Rest of Latin America
- 10.6 Middle East & Africa
- 10.6.1 Saudi Arabia
- 10.6.2 South Africa
- 10.6.3 UAE
- 10.6.4 Rest of Middle East & Africa
Chapter 11 Company Profiles
- 11.1 Givaudan SA
- 11.2 International Flavors & Fragrances Inc. (IFF)
- 11.3 DSM
- 11.4 Symrise AG
- 11.5 Sensient Technologies Corporation
- 11.6 Kerry Group plc
- 11.7 Archer Daniels Midland Company (ADM)
- 11.8 Tate & Lyle PLC
- 11.9 Cargill, Incorporated
- 11.10 MANE SA
- 11.11 McCormick & Company, Inc.
- 11.12 Takasago International Corporation
- 11.13 T. Hasegawa Co., Ltd.
- 11.14 Robertet Group
- 11.15 Kalsec Inc.
- 発行日
- 発行
- Global Market Insights Inc.
- ページ情報
- 英文 245 Pages
- 納期
- 2~3営業日


