
Eブローカーの市場機会、成長促進要因、産業動向分析、2025~2034年予測
E-Brokerage Market Opportunity, Growth Drivers, Industry Trend Analysis, and Forecast 2025 - 2034- 発行日
- ページ情報
- 英文 180 Pages
- 納期
- 2~3営業日
- 商品コード
- 1755279
- カスタマイズ可能 お客様のご希望に応じて、既存データの加工や未掲載情報(例:国別セグメント)の追加などの対応が可能です。詳細はお問い合わせください。
- 翻訳ツール提供対象 PDF対応AI翻訳ツールの無料貸し出しサービスのご利用が可能です
概要
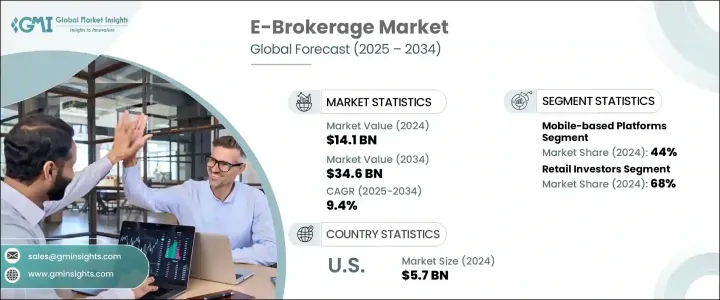
Eブローカーの世界市場規模は2024年に141億米ドルとなり、CAGR 9.4%で成長し、2034年には346億米ドルに達すると推定されます。
成長の原動力となっているのは、個人投資家の関与の高まり、低コストの投資モデルの受け入れ拡大、デジタル取引プラットフォームの大幅な進歩です。インターネットへのアクセスが拡大し、スマートフォンの普及が進んだことで、特に新興経済諸国ではデジタル取引の裾野が広がっています。モバイルへの接続性が高まったことで、より多くの個人が、直感的でアクセスしやすいオンラインプラットフォームを通じて資本市場に参入しています。このデジタルシフトは、伝統的な証券会社から、合理的でコスト効率の高い選択肢への移行に拍車をかけています。また、自己管理型投資や自動化された金融サービスの魅力も、投資家がポートフォリオの管理により多くのコントロールとカスタマイズを求めていることから、市場の加速を促しています。
手数料無料取引の採用は、従来のコスト障壁をなくし、手頃な価格と使いやすさを重視する新世代の投資家を引きつけ、Eブローカーの領域を再構築し続けています。かつて頻繁な取引や小規模な取引を妨げていた手数料を撤廃することで、こうしたプラットフォームは金融市場へのアクセスを民主化しました。このシフトは、低コストでテクニカル主導のソリューションを優先し、独立してポートフォリオを管理することを好む、若い初めて投資家に門戸を開いています。手数料無料モデルはまた、より高い取引活動やユーザーのエンゲージメントを促し、その結果、注文フローに対する支払い、証拠金貸付、プレミアム口座階層、サブスクリプションベースの金融ツールなどの代替チャネルを通じて収益を生み出しています。
| 市場範囲 | |
|---|---|
| 開始年 | 2024 |
| 予測年 | 2025-2034 |
| 開始金額 | 141億米ドル |
| 予測金額 | 346億米ドル |
| CAGR | 9.4% |
モバイル取引分野は2024年に44%のシェアを占め、2034年までのCAGRは9.8%と予測されます。これらのプラットフォームは、即時アクセス、リアルタイムの洞察、シームレスな取引機能で好まれています。音声アクティベーション、生体認証ログイン、統合分析、ユーザーフレンドリーなダッシュボードなどの強化された機能は、その魅力をさらに高めています。教育ツール、ゲーミフィケーション体験、ソーシャル取引機能の搭載も、ユーザー、特に若い投資家のエンゲージメント向上に寄与しています。
個人投資家セグメントは2024年に68%のシェアを占め、2034年までCAGR 9.8%を維持すると予測されます。この優位性は、使いやすいモバイルアプリケーションと従来の参入障壁の撤廃によって投資へのアクセスがより民主化されたことに起因します。端株、取引時間の延長、ETFや暗号通貨のようなデジタル資産の利用が可能になったことで、資金が限られた個人でも積極的な投資がしやすくなりました。デジタル・コミュニティやリアルタイムの学習リソースに支えられたファイナンシャルプランニングや投資機会に対する意識の高まりが、この分野の力強い成長を引き続き後押ししています。
北米のEブローカー市場は92%のシェアを占め、2024年には57億米ドルを創出しました。同分野における同国のリーダーシップは、インターネット利用率の高さ、モバイル金融アプリの普及、デジタル投資に精通した消費者層によって強化されています。市場分析とデータ追跡のための高度なツールと組み合わされた確立された規制構造が、継続的なプラットフォームの革新を支えています。暗号通貨やオプションのような資産への関心の高まりは、強固な統合の動きと相まって、競争が激化する環境下でのプラットフォームの進化、差別化、拡大を後押ししています。
Eブローカー業界の主要企業には、SoFi Invest、Interactive Brokers、Fidelity Investments、Robinhood、Ally Invest、Vanguard、Upstox、Groww、Charles Schwab Corporation、Merrill Edge(Bank of America)などがあります。市場の足場を固めるため、主要なEブローカー企業は技術革新、戦略的買収、ユーザー中心の機能強化に注力しています。多くの企業は、ロボアドバイザリーツール、AI主導の分析、リアルタイムのマーケットアラートなどの機能を統合することで、サービスの提供を拡大しています。また、インターネットやスマートフォンの利用が急増している新興市場をターゲットに、各プラットフォームは世界展開戦略にも投資しています。フィンテック企業との戦略的提携、オンボーディングプロセスの簡素化、新規投資家向けの教育コンテンツの展開も重要なアプローチです。
目次
第1章 調査手法
- 市場の範囲と定義
- 調査デザイン
- 調査アプローチ
- データ収集方法
- データマイニングソース
- 世界
- 地域/国
- 基本推定と計算
- 基準年計算
- 市場予測の主な動向
- 1次調査と検証
- 一次情報
- 予測モデル
- 調査の前提と限界
第2章 エグゼクティブサマリー
第3章 業界考察
- エコシステム分析
- サプライヤーの情勢
- 利益率
- コスト構造
- 各段階での付加価値
- バリューチェーンに影響を与える要因
- ディスラプション
- 業界への影響要因
- 促進要因
- インターネットとスマートフォンの普及率の向上
- 暗号通貨とデジタル資産の統合
- DIY投資とロボアドバイザーの需要増加
- 手数料無料取引への移行
- 業界の潜在的リスク&課題
- サイバーセキュリティとデータプライバシーの懸念
- 激しい競合と利益率のプレッシャー
- 市場機会
- AIと分析の統合
- Z世代とミレニアル世代の投資家の台頭
- 暗号資産および代替資産への拡大
- APIと組み込み仲介サービス
- 促進要因
- 成長可能性分析
- 規制情勢
- 北米
- 欧州
- アジア太平洋地域
- ラテンアメリカ
- 中東・アフリカ
- ポーター分析
- PESTEL分析
- テクノロジーとイノベーションの情勢
- 現在の技術動向
- 新興技術
- 特許分析
- 持続可能性と環境側面
- 持続可能な慣行
- 廃棄物削減戦略
- 生産におけるエネルギー効率
- 環境に優しい取り組み
- カーボンフットプリントの考慮
- ユースケース
- 最良のシナリオ
第4章 競合情勢
- イントロダクション
- 企業の市場シェア分析
- 北米
- 欧州
- アジア太平洋地域
- ラテンアメリカ航空
- 中東・アフリカ
- 主要市場企業の競合分析
- 競合ポジショニングマトリックス
- 戦略的展望マトリックス
- 主な発展
- 合併と買収
- パートナーシップとコラボレーション
- 新製品の発売
- 拡張計画と資金調達
第5章 市場推計・予測:サービスタイプ別、2021年~2034年
- 主要動向
- フルサービスの仲介
- ディスカウント証券会社
- ロボアドバイザー
第6章 市場推計・予測:プラットフォーム別、2021年~2034年
- 主要動向
- ウェブベースのプラットフォーム
- モバイルベースのプラットフォーム
- ハイブリッドプラットフォーム
第7章 市場推計・予測:投資家別、2021年~2034年
- 主要動向
- 個人投資家
- 機関投資家
第8章 市場推計・予測:資産クラス別、2021年~2034年
- 主要動向
- 株式取引
- デリバティブ取引
- 外国為替取引
- 投資信託とETF
- その他
第9章 市場推計・予測:所有権別、2021年~2034年
- 主要動向
- 非公開保有
- 公開保有
第10章 市場推計・予測:地域別、2021年~2034年
- 主要動向
- 北米
- 米国
- カナダ
- 欧州
- 英国
- ドイツ
- フランス
- イタリア
- スペイン
- ロシア
- 北欧諸国
- アジア太平洋地域
- 中国
- インド
- 日本
- 韓国
- オーストラリア・ニュージーランド
- 東南アジア
- ラテンアメリカ
- ブラジル
- メキシコ
- アルゼンチン
- 中東・アフリカ
- アラブ首長国連邦
- サウジアラビア
- 南アフリカ
第11章 企業プロファイル
- Ally Invest
- Charles Schwab
- E*TRADE(Morgan Stanley)
- eToro
- Exness
- Fidelity Investments
- Firstrade
- Futu Holdings(Moomoo)
- Groww
- Interactive Brokers
- Merrill Edge(Bank of America)
- Robinhood
- SoFi Invest
- Tastytrade
- Tiger Brokers
- TradeStation
- Upstox
- Vanguard
- Webull
- Zerodha
目次
The Global E-Brokerage Market was valued at USD 14.1 billion in 2024 and is estimated to grow at a CAGR of 9.4% to reach USD 34.6 billion by 2034. The growth is driven by the rising involvement of retail investors, growing acceptance of low-cost investment models, and significant advancements in digital trading platforms. Broader internet access and increased smartphone adoption are expanding the reach of digital trading, especially in developing economies. With greater mobile connectivity, more individuals are entering capital markets through intuitive and accessible online platforms. This digital shift is fueling a move away from traditional brokerages and toward streamlined, cost-effective alternatives. The appeal of self-managed investing and automated financial services is also driving market acceleration, as investors look for more control and customization in managing their portfolios.
The adoption of commission-free trading continues to reshape the e-brokerage space, eliminating traditional cost barriers and attracting a new generation of investors focused on affordability and ease of use. By removing fees that once discouraged frequent or small-scale trading, these platforms have democratized access to financial markets. This shift has opened the doors to younger, first-time investors who prioritize low-cost, tech-driven solutions and prefer managing their portfolios independently. Commission-free models also encourage higher trading activity and user engagement, which in turn generate revenue through alternative channels such as payment for order flow, margin lending, premium account tiers, and subscription-based financial tools.
| Market Scope | |
|---|---|
| Start Year | 2024 |
| Forecast Year | 2025-2034 |
| Start Value | $14.1 Billion |
| Forecast Value | $34.6 Billion |
| CAGR | 9.4% |
Mobile trading segment held 44% share in 2024 and projected to grow at a CAGR of 9.8% through 2034. These platforms are preferred for their instant accessibility, real-time insights, and seamless transaction capabilities. Enhanced features like voice activation, biometric login, integrated analytics, and user-friendly dashboards further enhance their appeal. The inclusion of educational tools, gamified experiences, and social trading functions is also contributing to increased engagement among users, particularly younger investors.
Retail investors segment held 68% share in 2024 and is projected to maintain a CAGR of 9.8% through 2034. This dominance stems from the broader democratization of investment access, enabled by easy-to-use mobile applications and the removal of traditional entry barriers. The availability of fractional shares, extended trading hours, and digital assets such as ETFs and cryptocurrencies has made it easier for individuals with limited capital to invest actively. Rising awareness of financial planning and investment opportunities, supported by digital communities and real-time learning resources, continues to drive strong growth in this segment.
North America E-Brokerage Market held 92% share and generated USD 5.7 billion in 2024. The country's leadership in the space is bolstered by high internet usage, widespread adoption of mobile finance apps, and a consumer base well-versed in digital investing. A well-established regulatory structure, combined with advanced tools for market analysis and data tracking, supports continuous platform innovation. The expanding interest in assets like cryptocurrencies and options, along with robust consolidation activity, is helping platforms evolve, differentiate, and scale within an increasingly competitive environment.
Leading names in the E-Brokerage Industry include SoFi Invest, Interactive Brokers, Fidelity Investments, Robinhood, Ally Invest, Vanguard, Upstox, Groww, Charles Schwab Corporation, and Merrill Edge (Bank of America). To strengthen their market foothold, major e-brokerage players are focusing on innovation, strategic acquisitions, and user-centric enhancements. Many firms are expanding their service offerings by integrating features such as robo-advisory tools, AI-driven analytics, and real-time market alerts. Platforms are also investing in global expansion strategies, targeting emerging markets where internet and smartphone use are rapidly rising. Strategic alliances with fintech firms, simplified onboarding processes, and the rollout of educational content for new investors are also critical approaches.
Table of Contents
Chapter 1 Methodology
- 1.1 Market scope and definition
- 1.2 Research design
- 1.2.1 Research approach
- 1.2.2 Data collection methods
- 1.3 Data mining sources
- 1.3.1 Global
- 1.3.2 Regional/Country
- 1.4 Base estimates and calculations
- 1.4.1 Base year calculation
- 1.4.2 Key trends for market estimation
- 1.5 Primary research and validation
- 1.5.1 Primary sources
- 1.6 Forecast model
- 1.7 Research assumptions and limitations
Chapter 2 Executive Summary
- 2.1 Industry 360° synopsis
- 2.2 Key market trends
- 2.2.1 Regional
- 2.2.2 Type of service
- 2.2.3 Platform
- 2.2.4 Investor
- 2.2.5 Asset class
- 2.2.6 Ownership
- 2.3 TAM Analysis, 2025-2034
- 2.4 CXO perspectives: strategic imperatives
- 2.4.1 Executive decision points
- 2.4.2 Critical success factors
- 2.5 Future outlook and strategic recommendations
Chapter 3 Industry Insights
- 3.1 Industry ecosystem analysis
- 3.1.1 Supplier landscape
- 3.1.2 Profit margin
- 3.1.3 Cost structure
- 3.1.4 Value addition at each stage
- 3.1.5 Factors affecting the value chain
- 3.1.6 Disruptions
- 3.2 Industry impact forces
- 3.2.1 Growth drivers
- 3.2.1.1 Increased internet and smartphone penetration
- 3.2.1.2 Integration of cryptocurrencies and digital assets
- 3.2.1.3 Growing demand for DIY investing and robo-advisory
- 3.2.1.4 Shift toward commission-free trading
- 3.2.2 Industry pitfalls and challenges
- 3.2.2.1 Cybersecurity and data privacy concerns
- 3.2.2.2 High competition and margin pressure
- 3.2.3 Market opportunities
- 3.2.3.1 Integration of AI and analytics
- 3.2.3.2 Rise of Gen Z and millennial investors
- 3.2.3.3 Expansion into crypto and alternative assets
- 3.2.3.4 API and embedded brokerage services
- 3.2.1 Growth drivers
- 3.3 Growth potential analysis
- 3.4 Regulatory landscape
- 3.4.1 North America
- 3.4.2 Europe
- 3.4.3 Asia Pacific
- 3.4.4 Latin America
- 3.4.5 Middle East & Africa
- 3.5 Porter's analysis
- 3.6 PESTEL analysis
- 3.7 Technology and innovation landscape
- 3.7.1 Current technological trends
- 3.7.2 Emerging technologies
- 3.8 Patent analysis
- 3.9 Sustainability and environmental aspects
- 3.9.1 Sustainable practices
- 3.9.2 Waste reduction strategies
- 3.9.3 Energy efficiency in production
- 3.9.4 Eco-friendly initiatives
- 3.9.5 Carbon footprint considerations
- 3.10 Use cases
- 3.11 Best-case scenario
Chapter 4 Competitive Landscape, 2024
- 4.1 Introduction
- 4.2 Company market share analysis
- 4.2.1 North America
- 4.2.2 Europe
- 4.2.3 Asia Pacific
- 4.2.4 LATAM
- 4.2.5 MEA
- 4.3 Competitive analysis of major market players
- 4.4 Competitive positioning matrix
- 4.5 Strategic outlook matrix
- 4.6 Key developments
- 4.6.1 Mergers & acquisitions
- 4.6.2 Partnerships & collaborations
- 4.6.3 New Product Launches
- 4.6.4 Expansion Plans and funding
Chapter 5 Market Estimates & Forecast, By Type of Service, 2021 - 2034 ($Bn)
- 5.1 Key trends
- 5.2 Full-service brokerage
- 5.3 Discount brokerage
- 5.4 Robo-advisors
Chapter 6 Market Estimates & Forecast, By Platform, 2021 - 2034 ($Bn)
- 6.1 Key trends
- 6.2 Web-based platforms
- 6.3 Mobile-based platforms
- 6.4 Hybrid platforms
Chapter 7 Market Estimates & Forecast, By Investor, 2021 - 2034 ($Bn)
- 7.1 Key trends
- 7.2 Retail investors
- 7.3 Institutional investors
Chapter 8 Market Estimates & Forecast, By Asset Class, 2021 - 2034 ($Bn)
- 8.1 Key trends
- 8.2 Equity trading
- 8.3 Derivatives trading
- 8.4 Forex trading
- 8.5 Mutual funds and ETFs
- 8.6 Others
Chapter 9 Market Estimates & Forecast, By Ownership, 2021 - 2034 ($Bn)
- 9.1 Key trends
- 9.2 Privately held
- 9.3 Publicly held
Chapter 10 Market Estimates & Forecast, By Region, 2021 - 2034 ($Bn)
- 10.1 Key trends
- 10.2 North America
- 10.2.1 U.S.
- 10.2.2 Canada
- 10.3 Europe
- 10.3.1 UK
- 10.3.2 Germany
- 10.3.3 France
- 10.3.4 Italy
- 10.3.5 Spain
- 10.3.6 Russia
- 10.3.7 Nordics
- 10.4 Asia Pacific
- 10.4.1 China
- 10.4.2 India
- 10.4.3 Japan
- 10.4.4 South Korea
- 10.4.5 ANZ
- 10.4.6 Southeast Asia
- 10.5 Latin America
- 10.5.1 Brazil
- 10.5.2 Mexico
- 10.5.3 Argentina
- 10.6 MEA
- 10.6.1 UAE
- 10.6.2 Saudi Arabia
- 10.6.3 South Africa
Chapter 11 Company Profiles
- 11.1 Ally Invest
- 11.2 Charles Schwab
- 11.3 E*TRADE (Morgan Stanley)
- 11.4 eToro
- 11.5 Exness
- 11.6 Fidelity Investments
- 11.7 Firstrade
- 11.8 Futu Holdings (Moomoo)
- 11.9 Groww
- 11.10 Interactive Brokers
- 11.11 Merrill Edge (Bank of America)
- 11.12 Robinhood
- 11.13 SoFi Invest
- 11.14 Tastytrade
- 11.15 Tiger Brokers
- 11.16 TradeStation
- 11.17 Upstox
- 11.18 Vanguard
- 11.19 Webull
- 11.20 Zerodha
- 発行日
- 発行
- Global Market Insights Inc.
- ページ情報
- 英文 180 Pages
- 納期
- 2~3営業日


