
非アルコール性脂肪肝炎バイオマーカー市場機会、成長促進要因、産業動向分析、2025年~2034年予測
Non-alcoholic Steatohepatitis Biomarkers Market Opportunity, Growth Drivers, Industry Trend Analysis, and Forecast 2025 - 2034- 発行日
- ページ情報
- 英文 120 Pages
- 納期
- 2~3営業日
- 商品コード
- 1755220
- カスタマイズ可能 お客様のご希望に応じて、既存データの加工や未掲載情報(例:国別セグメント)の追加などの対応が可能です。詳細はお問い合わせください。
- 翻訳ツール提供対象 PDF対応AI翻訳ツールの無料貸し出しサービスのご利用が可能です
概要
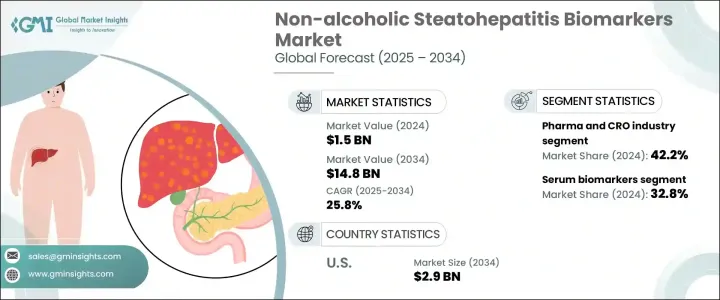
世界の非アルコール性脂肪肝炎バイオマーカー市場は、2024年に15億米ドルと評価され、CAGR 25.8%で成長し、2034年には148億米ドルに達すると推定されています。
NASHバイオマーカーは、非アルコール性脂肪性肝疾患(NAFLD)から進展する重篤な肝疾患であるNASHの存在と進行を評価するのに役立つ生物学的指標です。ヘルスケアプロバイダーは、早期発見と的を絞った介入をますます優先するようになっており、このようなバイオマーカーの需要はかなり高まっています。積極的な肝疾患スクリーニングの推進は、リスクのある集団を対象とした臨床的推奨の進化によってさらに強化されています。これには、NASHを発症しやすい肥満や2型糖尿病などの代謝異常のある人が含まれます。
肝臓関連の合併症に対する認識が高まるにつれ、ヘルスケアシステムは患者の転帰を改善するためにバイオマーカーに基づく診断戦略を統合しつつあります。これらのツールは、疾患の進行をモニターし、治療効果を評価し、新たな治療法の恩恵を最も受けやすい患者を特定する可能性を提供します。個別化医療におけるバイオマーカーの役割は、肝疾患の診断・管理方法に大きな変化をもたらしています。低侵襲的な方法が好まれるようになり、臨床研究における精密診断の採用が増加していることから、現代ヘルスケアにおけるNASHバイオマーカーの重要性がさらに高まっています。
| 市場範囲 | |
|---|---|
| 開始年 | 2024年 |
| 予測年 | 2025年~2034年 |
| 開始金額 | 15億米ドル |
| 予測金額 | 148億米ドル |
| CAGR | 25.8% |
市場はバイオマーカーの種類別に、酸化ストレスバイオマーカー、肝線維症バイオマーカー、血清バイオマーカー、アポトーシスバイオマーカー、その他に区分されます。このうち、血清バイオマーカーが2024年に32.8%を占め、売上高で最大のシェアを占めています。このセグメントの優位性は主に、血液サンプリングの簡便性、非侵襲的な手順、診断、モニタリング、予後に頻繁に使用されることによるものです。血清ベースのバイオマーカーは、肝細胞傷害や疾患の進行に関連するその他の細胞応答を検出することにより、肝臓の健康状態に関する重要な洞察を提供するものとして認識されています。臨床環境と研究環境の両方に適用されることで、その有用性が広まり、市場の牽引力となっています。
最終用途の観点から、市場は製薬・CRO(医薬品開発業務受託機関)業界、病院、診断研究所、学術研究機関に分けられます。製薬・CRO業界は、2024年には全体の売上高の42.2%を生み出し、主導的な地位を占めています。この優位性は、同業界が創薬、臨床試験の層別化、治療モニタリングのために有効なバイオマーカーに強く依存していることを反映しています。医薬品開発企業が治療薬候補の開発期間の短縮と精度の向上を目指す中、バイオマーカーは開発サイクル全体を通じて有効性と安全性を評価する上で不可欠なものとなっています。一方CROは、バイオマーカーのバリデーションや試験のための技術的・規制的専門知識を提供することで、こうした取り組みをサポートしています。CROの関与により、バイオマーカーの発見から臨床応用への移行が効率化され、標的治療の開発が強化され、市場の急成長に寄与しています。
地域的には、米国がNASHバイオマーカー分野の主要な成長エンジンとして浮上しています。米国市場だけでも2024年には3億880万米ドルと評価され、2034年には約29億米ドルに急増すると予測されています。肝疾患の負担が増加していること、高度な診断技術をサポートできる強固なヘルスケア・インフラが整備されていることなど、いくつかの要因がこの大きな軌道の要因となっています。高齢者は慢性肝疾患のリスクが高く、タイムリーな診断介入が必要となるためです。非侵襲的なソリューションへの注目と相まって、ヘルスケアにおける診断への投資が増加していることも、バイオマーカー技術の需要をさらに押し上げています。正確かつ早期発見ツールに対するニーズはかつてないほど高まっており、米国は急速な技術進歩と次世代検査プロトコルの統合により、この需要に応える最前線にあります。
NASHバイオマーカー市場の競合情勢は、依然として適度に断片化されています。バイオマーカー専業企業と診断ソリューション・プロバイダーが混在してこの分野を積極的に形成しており、大手企業は市場シェア全体の約40%を占めています。これらの企業は、新しい技術を取り入れ、精密医療能力を強化することを目的としたパートナーシップを形成することにより、この分野を前進させています。多重化プラットフォームやAI統合分析などのイノベーションは、臨床と研究の両方の場面でバイオマーカーデータを収集、解釈、適用する方法を変革しています。市場が進化を続ける中、技術的なアップグレードと異業種間の連携により、より効率的で拡張可能な、患者中心のバイオマーカーソリューションの採用が加速すると予想されます。
目次
第1章 調査手法と範囲
第2章 エグゼクティブサマリー
第3章 業界考察
- エコシステム分析
- 業界への影響要因
- 促進要因
- 非アルコール性脂肪肝炎(NASH)の有病率の上昇
- 診断技術の進歩
- 肝疾患に関する意識向上とスクリーニングの取り組み
- 業界の潜在的リスク&課題
- バイオマーカー検証の高コストと複雑さ
- 厳しい規制シナリオ
- 促進要因
- 成長可能性分析
- 規制情勢
- トランプ政権による関税への影響
- 貿易への影響
- 貿易量の混乱
- 国別の対応
- 業界への影響
- 供給側の影響(製造コスト)
- 主要原材料の価格変動
- サプライチェーンの再構築
- 生産コストへの影響
- 需要側の影響(消費者へのコスト)
- 最終市場への価格伝達
- 市場シェアの動向
- 消費者の反応パターン
- 供給側の影響(製造コスト)
- 影響を受ける主要企業
- 戦略的な業界対応
- サプライチェーンの再構成
- 価格設定と製品戦略
- 政策関与
- 展望と今後の検討事項
- 貿易への影響
- 技術的情勢
- 将来の市場動向
- ギャップ分析
- ポーター分析
- PESTEL分析
第4章 競合情勢
- イントロダクション
- 企業の市場シェア分析
- 企業マトリックス分析
- 主要市場企業の競合分析
- 競合ポジショニングマトリックス
- 戦略ダッシュボード
第5章 市場推計・予測:タイプ別、2021年~2034年
- 主要動向
- 血清バイオマーカー
- 肝線維症バイオマーカー
- アポトーシスバイオマーカー
- 酸化ストレスバイオマーカー
- その他のタイプ
第6章 市場推計・予測:最終用途別、2021年~2034年
- 主要動向
- 製薬およびCRO業界
- 病院
- 診断ラボ
- 学術研究機関
第7章 市場推計・予測:地域別、2021年~2034年
- 主要動向
- 北米
- 米国
- カナダ
- 欧州
- ドイツ
- 英国
- フランス
- スペイン
- イタリア
- オランダ
- アジア太平洋
- 中国
- インド
- 日本
- オーストラリア
- 韓国
- ラテンアメリカ
- ブラジル
- メキシコ
- アルゼンチン
- 中東・アフリカ
- サウジアラビア
- 南アフリカ
- アラブ首長国連邦
第8章 企業プロファイル
- BioPredictive
- GENFIT
- Glycotest
- Labcorp
- Nordic Bioscience
- Prometheus Laboratories
- Quest Diagnostics
- Siemens Healthineers
- SomaLogic
- Zora Biosciences
目次
The Global Non-alcoholic Steatohepatitis Biomarkers Market was valued at USD 1.5 billion in 2024 and is estimated to grow at a CAGR of 25.8% to reach USD 14.8 billion by 2034. NASH biomarkers are biological indicators that help evaluate the presence and progression of NASH, a severe liver condition that evolves from non-alcoholic fatty liver disease (NAFLD). As healthcare providers increasingly prioritize early detection and targeted interventions, the demand for such biomarkers has grown considerably. The push for proactive liver disease screening is further reinforced by evolving clinical recommendations targeting at-risk populations. This includes individuals with metabolic disorders such as obesity and type 2 diabetes, who are more likely to develop NASH.
As awareness of liver-related complications continues, healthcare systems are integrating biomarker-based diagnostic strategies to improve patient outcomes. These tools offer the potential to monitor disease progression, assess treatment efficacy, and identify patients most likely to benefit from emerging therapies. Their growing role in personalized medicine drives a significant shift in how liver diseases are diagnosed and managed. Increasing preference for minimally invasive methods and growing adoption of precision diagnostics in clinical research have further cemented the importance of NASH biomarkers in modern healthcare.
| Market Scope | |
|---|---|
| Start Year | 2024 |
| Forecast Year | 2025-2034 |
| Start Value | $1.5 Billion |
| Forecast Value | $14.8 Billion |
| CAGR | 25.8% |
The market is segmented by biomarker type into oxidative stress biomarkers, hepatic fibrosis biomarkers, serum biomarkers, apoptosis biomarkers, and others. Among these, serum biomarkers accounted for the largest share of revenue, contributing 32.8% in 2024. This segment's dominance is primarily due to the convenience of blood sampling, non-invasive procedures, and their frequent use in diagnosis, monitoring, and prognosis. Serum-based biomarkers are recognized for offering vital insights into liver health by detecting hepatocyte injury and other cellular responses linked to disease progression. Their application across both clinical settings and research environments adds to their widespread utility and market traction.
In terms of end use, the market is divided into the pharmaceutical and contract research organization (CRO) industry, hospitals, diagnostic laboratories, and academic research institutes. The pharmaceutical and CRO industry held the leading position in 2024, generating 42.2% of the overall revenue. This dominance reflects the industry's strong reliance on validated biomarkers for drug discovery, clinical trial stratification, and treatment monitoring. As drug developers seek to accelerate timelines and increase the precision of their therapeutic candidates, biomarkers have become essential in assessing efficacy and safety throughout the development cycle. CROs, on the other hand, support these efforts by offering technical and regulatory expertise for biomarker validation and testing. Their involvement has streamlined the transition from biomarker discovery to clinical application, bolstering the development of targeted treatments and contributing to faster market growth.
Geographically, the United States has emerged as a key growth engine within the NASH biomarkers space. The US market alone was valued at USD 308.8 million in 2024 and is anticipated to surge to approximately USD 2.9 billion by 2034. Several factors contribute to this significant trajectory, including a rising burden of liver-related conditions and a robust healthcare infrastructure capable of supporting advanced diagnostic technologies. The growing aging population is also a major driver, as older individuals face a higher risk of chronic liver diseases and require timely diagnostic interventions. Increasing healthcare investments in diagnostics, coupled with a focus on non-invasive solutions, are further driving demand for biomarker technologies. The need for accurate and early detection tools has never been greater, and the US is at the forefront of meeting this demand with rapid technological advancements and integration of next-generation testing protocols.
The competitive landscape of the NASH biomarkers market remains moderately fragmented. A mix of specialized biomarker firms and diagnostic solution providers is actively shaping the space, with leading players collectively capturing around 40% of the total market share. These companies are advancing the field by incorporating novel technologies and forming partnerships aimed at enhancing precision medicine capabilities. Innovations such as multiplexed platforms and AI-integrated analytics are transforming how biomarker data is collected, interpreted, and applied in both clinical and research settings. As the market continues to evolve, technological upgrades and cross-industry collaborations are expected to accelerate the adoption of more efficient, scalable, and patient-centered biomarker solutions.
Table of Contents
Chapter 1 Methodology and Scope
- 1.1 Market scope and definitions
- 1.2 Research design
- 1.2.1 Research approach
- 1.2.2 Data collection methods
- 1.3 Base estimates and calculations
- 1.3.1 Base year calculation
- 1.3.2 Key trends for market estimation
- 1.4 Forecast model
- 1.5 Primary research and validation
- 1.5.1 Primary sources
- 1.5.2 Data mining sources
Chapter 2 Executive Summary
- 2.1 Industry 3600 synopsis
Chapter 3 Industry Insights
- 3.1 Industry ecosystem analysis
- 3.2 Industry impact forces
- 3.2.1 Growth drivers
- 3.2.1.1 Rising prevalence of non-alcoholic steatohepatitis (NASH)
- 3.2.1.2 Advancements in diagnostic technologies
- 3.2.1.3 Increased awareness and screening initiatives for liver diseases
- 3.2.2 Industry pitfalls and challenges
- 3.2.2.1 High cost and complexity of biomarker validation
- 3.2.2.2 Stringent regulatory scenario
- 3.2.1 Growth drivers
- 3.3 Growth potential analysis
- 3.4 Regulatory landscape
- 3.5 Trump administration tariffs
- 3.5.1 Impact on trade
- 3.5.1.1 Trade volume disruptions
- 3.5.1.2 Country-wise response
- 3.5.2 Impact on the industry
- 3.5.2.1 Supply-side impact (cost of manufacturing)
- 3.5.2.1.1 Price volatility in key materials
- 3.5.2.1.2 Supply chain restructuring
- 3.5.2.1.3 Production cost implications
- 3.5.2.2 Demand-side impact (cost to consumers)
- 3.5.2.2.1 Price transmission to end markets
- 3.5.2.2.2 Market share dynamics
- 3.5.2.2.3 Consumer response patterns
- 3.5.2.1 Supply-side impact (cost of manufacturing)
- 3.5.3 Key companies impacted
- 3.5.4 Strategic industry responses
- 3.5.4.1 Supply chain reconfiguration
- 3.5.4.2 Pricing and product strategies
- 3.5.4.3 Policy engagement
- 3.5.5 Outlook and future considerations
- 3.5.1 Impact on trade
- 3.6 Technological landscape
- 3.7 Future market trends
- 3.8 Gap analysis
- 3.9 Porter's analysis
- 3.10 PESTEL analysis
Chapter 4 Competitive Landscape, 2024
- 4.1 Introduction
- 4.2 Company market share analysis
- 4.3 Company matrix analysis
- 4.4 Competitive analysis of major market players
- 4.5 Competitive positioning matrix
- 4.6 Strategy dashboard
Chapter 5 Market Estimates and Forecast, By Type, 2021 - 2034 ($ Mn)
- 5.1 Key trends
- 5.2 Serum biomarkers
- 5.3 Hepatic fibrosis biomarkers
- 5.4 Apoptosis biomarkers
- 5.5 Oxidative stress biomarkers
- 5.6 Other types
Chapter 6 Market Estimates and Forecast, By End Use, 2021 - 2034 ($ Mn)
- 6.1 Key trends
- 6.2 Pharma and CRO industry
- 6.3 Hospitals
- 6.4 Diagnostic labs
- 6.5 Academic research institutes
Chapter 7 Market Estimates and Forecast, By Region, 2021 - 2034 ($ Mn)
- 7.1 Key trends
- 7.2 North America
- 7.2.1 U.S.
- 7.2.2 Canada
- 7.3 Europe
- 7.3.1 Germany
- 7.3.2 UK
- 7.3.3 France
- 7.3.4 Spain
- 7.3.5 Italy
- 7.3.6 Netherlands
- 7.4 Asia Pacific
- 7.4.1 China
- 7.4.2 India
- 7.4.3 Japan
- 7.4.4 Australia
- 7.4.5 South Korea
- 7.5 Latin America
- 7.5.1 Brazil
- 7.5.2 Mexico
- 7.5.3 Argentina
- 7.6 Middle East and Africa
- 7.6.1 Saudi Arabia
- 7.6.2 South Africa
- 7.6.3 UAE
Chapter 8 Company Profiles
- 8.1 BioPredictive
- 8.2 GENFIT
- 8.3 Glycotest
- 8.4 Labcorp
- 8.5 Nordic Bioscience
- 8.6 Prometheus Laboratories
- 8.7 Quest Diagnostics
- 8.8 Siemens Healthineers
- 8.9 SomaLogic
- 8.10 Zora Biosciences
- 発行日
- 発行
- Global Market Insights Inc.
- ページ情報
- 英文 120 Pages
- 納期
- 2~3営業日


