
|
市場調査レポート
商品コード
1755211
クリーンラベル食品添加物市場:市場機会、成長促進要因、産業動向分析、将来予測(2025~2034年)Clean Labelled Food Additives Market Opportunity, Growth Drivers, Industry Trend Analysis, and Forecast 2025 - 2034 |
||||||
カスタマイズ可能
|
|||||||
| クリーンラベル食品添加物市場:市場機会、成長促進要因、産業動向分析、将来予測(2025~2034年) |
|
出版日: 2025年05月29日
発行: Global Market Insights Inc.
ページ情報: 英文 225 Pages
納期: 2~3営業日
|

全表示
- 概要
- 目次
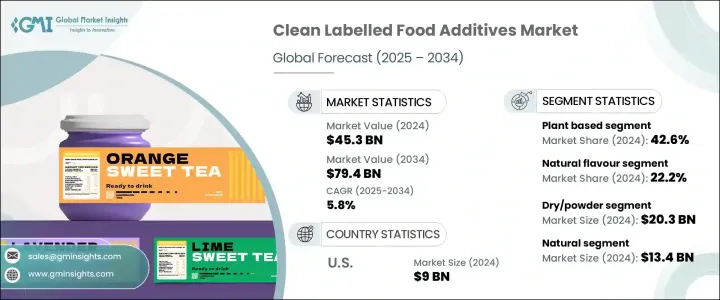
世界のクリーンラベル食品添加物市場は、2024年には453億米ドルとなり、CAGR 5.8%で成長し、2034年には794億米ドルに達すると推定されています。
食品の透明性、天然由来、最小限の加工に対する消費者の意識の高まりが、この市場の形成に重要な役割を果たしています。認識しやすく分かりやすい成分への需要が高まる中、食品メーカーは性能や保存期間に妥協しないクリーンラベルのソリューションを選ぶようになっています。植物、微生物、ミネラル、動物に由来するこれらの添加物は、加工食品の味、外観、品質を維持しながら、合成の代替品として広く使用されています。
その機能は、鮮度の保持、風味の向上、食感の改善、乳化のサポート、天然の色や甘味の提供にまで及んでいます。原材料調達におけるシンプルさと天然由来へのこのシフトは、人工添加物に対する消費者の懐疑心の高まりと、健康的で倫理的な選択に沿った食品への嗜好によって支えられています。その結果、クリーンラベルの剤形が、主要カテゴリーの食品ブランドにとって不可欠な戦略となっており、消費者の信頼を維持し、最小限の加工で体に良い食品を求める市場の需要に応えることを可能にしています。
| 市場範囲 | |
|---|---|
| 開始年 | 2024年 |
| 予測期間 | 2025~2034年 |
| 当初の市場規模 | 453億米ドル |
| 市場規模予測 | 794億米ドル |
| CAGR | 5.8% |
主要原料のうち、天然香料は2024年に22.2%のシェアを占め、2034年までのCAGRは5.8%と予測されます。これらの原料は、果物、ハーブ、スパイス、その他の植物由来であるため、本物志向の消費者にアピールします。人工的な成分に頼ることなく、乳製品、焼き菓子、飲料、スナック菓子の味を向上させる汎用性が、クリーンラベル製品開発における注目度の高まりを支えています。
原料供給源別に見ると、植物由来の添加物は2024年に42.6%のシェアで市場をリードし、2034年までのCAGRは6%と予想されます。持続可能性、動物福祉、植物志向の食生活に対する関心の高まりが、果物、野菜、穀物、豆類由来のクリーンラベル原料の需要を促進しています。これらの原料は、合成化合物の天然代替物を提供することでクリーンラベルの期待に応え、その結果、ブランドは倫理的・環境的意識を反映した製品を処方することができます。
形態別では、乾燥または粉末セグメントが2024年に203億米ドルを超える収益を上げました。保存期間が長く、保管が容易で、自動化された製造工程に適合することから、焼き菓子、スナック菓子、ドリンクミックスに理想的な選択肢となっています。広く使用されているのは、製造業者と消費者に利便性と安定性を提供するためです。一方、液体添加物は、特にソースや乳製品など、ブレンドのしやすさや風味の一貫性が重視される用途で人気を集めています。
認証の観点から見ると、ナチュラル・セグメントは2024年に134億米ドルに達し、健康、透明性、最小限の加工という強い関連性によって市場を独占しています。消費者は「ナチュラル」ラベルを信頼する傾向があり、それが安全性と成分の完全性を表していると信じています。これに続いて、合成化学物質や遺伝子組み換えに対する懸念から、オーガニックや非遺伝子組み換えのラベルに対する需要が高まっています。クリーン・ラベル認証製品は、まだ台頭途上ですが、最高レベルの保証を提供するものと見られており、規制市場や高級市場で台頭する可能性が高いです。
最終用途カテゴリーの中では、ベーカリーおよび菓子類が最大の市場シェアを占め、2024年の寄与率は24.3%で、2034年までのCAGRは6.2%と予想されます。パン、ケーキ、クッキーのような焼き菓子では、クリーンで植物由来の原料が好まれるため、この分野の技術革新が引き続き推進されています。食品メーカーは、より健康的な選択肢を求める顧客の需要を満たすために、人工甘味料、着色料、保存料をクリーン・ラベル・オプションで代用しています。
飲料分野も、天然飲料や機能性飲料の人気の高まりにより、着実な成長を遂げています。クリーンラベル添加物は乳製品や冷凍食品、特にヨーグルトやフローズンデザートに使用されています。ソース、調味料、スナック菓子、調理済み食品も、健康志向の買い物客にアピールするため、クリーンな配合へとシフトしています。食肉、鶏肉、魚介類の各カテゴリーでは、食品の安全性を維持しながらクリーン・ラベルの基準に合わせるため、合成保存料や着色料を徐々に減らしています。
機能性の面では、風味と色の強化が2024年に136億米ドルでこのセグメントをリードしています。より鮮やかで魅力的な、自然な風味の食品を求める動きは、特に外見が購入の意思決定に大きく影響するセグメントにおいて高まり続けています。植物ベースの抽出物、ハーブ、果実が人工的な着色料や香料に取って代わるのが一般的で、ブランドがより健康的で視覚的に魅力的な食品を求める需要に沿うのに役立っています。
消費者プロファイル別に市場を区分すると、2024年には従来型製品が市場全体の30.9%を占め、2034年までCAGR 5.7%で拡大すると予測されます。ブランド各社がパン、ソース、スナック菓子などの定番商品を毎日のクリーンな食生活の期待に応えられるよう改良に取り組んでいるため、これらの商品はクリーン・ラベル統合の焦点となっています。プレミアム、ウェルネス、子供向け製品が引き続きクリーンラベルの特徴を強調する一方で、主流商品にこうした原材料が含まれることは、クリーンラベルがもはやニッチな概念ではなく、新しいスタンダードであることを示しています。
地域別では、米国が北米のクリーンラベル食品添加物市場をリードし、2024年には90億米ドルに達し、2034年までのCAGRは5.6%と予想されています。このリーダーシップは、消費者の意識の高まり、規制当局の支援、幅広いクリーンラベル製品の提供に起因しています。アメリカの消費者は特に原材料に気を配り、人工添加物を含まない製品を求めるようになっています。メーカーは、ほぼすべての食品カテゴリーにクリーン・ラベルの原則を取り入れることで対応しています。
世界のクリーンラベル食品添加物分野の主要企業には、カーギル、イングレディオン、ADM、ケリー・グループ、テート&ライルなどがあります。これらの企業は、強力な世界・フットプリント、多様な製品ポートフォリオ、強固な流通システムを有しており、世界的に高まるクリーンラベル・ソリューションの需要に対する重要なサプライヤーとして位置づけられています。
目次
第1章 分析手法と範囲
第2章 エグゼクティブサマリー
第3章 業界考察
- エコシステム分析
- 業界への影響要因
- 成長可能性分析
- 規制情勢
- トランプ政権による関税
- 貿易への影響
- 業界への影響
- 供給側の影響(原材料)
- 需要側の影響(販売価格)
- 影響を受ける主要企業
- 戦略的な業界対応
- サプライチェーンの再構成
- 価格設定と製品戦略
- 政策関与
- 展望と今後の検討事項
- 将来の市場動向
- ポーターのファイブフォース分析
- PESTEL分析
第3章 業界考察
- エコシステム分析
- サプライヤーの情勢
- 利益率
- 各段階での付加価値
- バリューチェーンに影響を与える要因
- ディスラプション
- 業界への影響要因
- 促進要因
- 業界の潜在的リスクと課題
- 市場機会
- 成長可能性分析
- 規制情勢
- 北米
- 欧州
- アジア太平洋
- ラテンアメリカ
- 中東・アフリカ
- ポーター分析
- PESTEL分析
- 価格動向
- 地域別
- 製品別
- 将来の市場動向
- テクノロジーとイノベーションの情勢
- 現在の技術動向
- 新興技術
- 特許情勢
- 貿易統計(HSコード)
- 主要輸入国
- 主要輸出国
- 持続可能性と環境側面
- 持続可能な慣行
- 廃棄物削減戦略
- 生産におけるエネルギー効率
- 環境に優しい取り組み
- 製造プロセスの概要
- 原材料の調達と調合
- 抽出・処理方法
- 精製と標準化
- 品質管理とテスト
- 包装と保管
- 生産コスト分析
- 原材料費
- 処理コスト
- 人件費
- 梱包コスト
- 製造間接費
- コスト最適化戦略
- 製造施設分析
- 主要な製造拠点
- 生産能力の評価
- 施設拡張計画
- サプライチェーンの課題と解決策
- 原材料調達の課題
- 品質の一貫性の問題
- 物流と輸送
- 在庫管理
- 製造プロセスにおける持続可能性
- エネルギー効率対策
- 節水対策
- 廃棄物の削減と管理
- 二酸化炭素排出量削減戦略
- 世界の規制枠組み
- 地域規制枠組み
- 北米
- FDAの規制とガイドライン
- USDAオーガニック基準
- 州レベルの規制
- 欧州
- EFSAガイドライン
- EUの食品添加物規制
- EUの有機規制
- アジア太平洋
- 中国の食品添加物規制
- 日本の食品添加物規格
- その他の地域規制
- 北米
- 地域規制枠組み
- 世界のその他の地域
- クリーンラベルの定義と基準
- 業界定義の標準
- 小売業者が定義した基準
- クリーンラベルに対する消費者の認識
- 認証・ラベル表示の要件
- オーガニック認証
- 非遺伝子組み換え認証
- ナチュラルクレーム認証
- アレルギー表示
- コンプライアンスの課題と戦略
- 将来の規制動向とその影響
- 環境、社会、ガバナンス分析
- 環境影響評価
- カーボンフットプリント分析
- 水の使用と管理
- 土地利用と生物多様性への影響
- 廃棄物の発生と管理
- 環境影響評価
- 社会的責任の実践
- 労働慣行と労働条件
- コミュニティの関与と支援
- 健康と栄養への影響
- 倫理的な調達慣行
- ガバナンスと倫理的配慮
- コーポレートガバナンス構造
- 透明性と報告
- 倫理的なビジネス慣行
- ステークホルダーエンゲージメント
- 主要企業のESG業績ベンチマーク
- ESGリスク評価と軽減戦略
- クリーンラベル食品添加物業界における今後のESG動向
- 消費者行動と市場動向の分析
- 消費者の嗜好と購買パターン
- クリーンラベルの認識と理解
- プレミアムを支払う意思
- 食材回避行動
- ラベルの読み方
- クリーンラベル消費者の人口統計分析
- 年齢層分析
- 所得水準分析
- 地理的分布
- ライフスタイルと心理的セグメンテーション
- クリーンラベル食品添加物に対する消費者の認識
- 認識されている健康上の利点
- 認識されている環境上の利点
- 知覚される品質と価値
- 信頼と信用の要因
- 新たな消費者動向
- 植物性食品とビーガン食品の好み
- アレルゲンフリーとフリーフロムの動向
- 機能性食品と強化食品の好み
- 持続可能性と倫理的消費
- デジタル変革が消費者エンゲージメントに与える影響
- 消費者フィードバック分析とその影響
- 消費者の嗜好と購買パターン
- 技術的情勢とイノベーション分析
- 現在の技術動向
- 新興技術
- 高度な抽出技術
- 発酵とバイオテクノロジー
- ナノテクノロジーの応用
- 高圧・非熱技術
- 製品イノベーションの動向
- 多機能成分
- 従来の添加物の代替品
- 新しい植物由来成分
- アップサイクルされた材料
- 処方と応用の革新
- 賞味期限延長ソリューション
- 風味を高める技術
- テクスチャリングソリューション
- 色安定性の革新
- 包装および配送システムの革新
- 持続可能な包装
- スマートパッケージ
- ポーションコントロールパッケージ
- 賞味期限を延長したパッケージ
- 研究開発活動とイノベーションハブ
- 地域ごとの技術導入動向
- 将来の技術ロードマップ(2025~2034年)
- 価格分析と経済的要因
- 価格動向
- 過去の価格動向
- 現在の価格シナリオ
- 価格予測
- 価格に影響を与える要因
- 原材料費
- 処理コスト
- コンプライアンスコスト
- 市場競争
- 消費者の支払い意欲
- 価格戦略
- プレミアムvs.マスマーケット
- 付加価値価格設定
- バンドル価格
- 地域による価格差
- 価格と価値の関係分析
- 経済指標
- GDP成長率と消費者支出
- インフレと通貨変動
- 農産物価格
- エネルギーコスト
- 価格動向
- サプライヤーの情勢
- 利益率分析
- 主なニュースと取り組み
- 規制情勢
- 影響要因
- 促進要因
- クリーンラベル製品に対する消費者の嗜好の高まり
- 拡大する食品・飲料業界
- クリーンラベル原料を必要とする植物由来およびオーガニック食品の拡大
- 業界の潜在的リスク&課題
- クリーンラベル食品添加物の高コスト
- 人工保存料を使用せずに味、食感、保存期間を維持することの課題
- 促進要因
- 成長可能性分析
- ポーター分析
- PESTEL分析
第4章 競合情勢
- イントロダクション
- 企業の市場シェア分析
- 地域別
- 北米
- 欧州
- アジア太平洋
- ラテンアメリカ
- 中東・アフリカ
- 企業マトリックス分析
- 主要市場企業の競合分析
- 競合ポジショニングマトリックス
- 主な発展
- 企業合併・買収 (M&A)
- 事業提携・協力
- 新製品の発売
- 拡張計画
第5章 市場規模・予測:成分の種類別(2021~2034年)
- 主要動向
- 天然着色料
- 天然香料
- 天然防腐剤
- 天然甘味料
- ハイドロコロイド・テクスチャライザー
- 機能性天然デンプン
- 天然乳化剤
- その他
第6章 市場規模・予測:原料別(2021~2034年)
- 主要動向
- 植物由来
- 動物由来
- 微生物/発酵
- ミネラル由来
第7章 市場規模・予測:形状別(2021~2034年)
- 主な傾向
- 乾燥/粉末
- 液体
- その他
第8章 市場規模・予測:認証別(2021~2034年)
- 主な傾向
- オーガニック
- 非遺伝子組み換え
- 天然
- クリーンラベル認証
- その他
第9章 市場規模・予測:最終用途別(2021~2034年)
- 主な傾向
- ベーカリー・菓子類
- 飲料
- 乳製品・冷凍食品
- 加工食品
- ソース・調味料
- スナック・インスタント食品
- 食肉・鶏肉・魚介類
- その他
第10章 市場規模・予測:機能別(2021~2034年)
- 主な傾向
- 保存
- テクスチャの変更
- 風味/色の強化
- 乳化
- 甘味料
- その他
第11章 市場規模・予測:消費者別(2021~2034年)
- 主な傾向
- 従来品
- プレミアム製品
- 健康・ウェルネス製品
- 子供用製品
- その他
第12章 市場推計・予測:地域別(2021~2034年)
- 主要動向
- 北米
- 米国
- カナダ
- 欧州
- ドイツ
- 英国
- フランス
- スペイン
- イタリア
- アジア太平洋
- 中国
- インド
- 日本
- オーストラリア
- 韓国
- ラテンアメリカ
- ブラジル
- メキシコ
- アルゼンチン
- 中東・アフリカ
- サウジアラビア
- 南アフリカ
- アラブ首長国連邦
第13章 企業プロファイル
- ADM
- Cargill
- Corbion Inc.
- DSM
- Frutarom
- Ingredion
- International Flavors &Fragrances Inc.
- Kemin Industries, Inc.
- Kerry Group
- Sensient Technologies
- Tate &Lyle
The Global Clean Labelled Food Additives Market was valued at USD 45.3 billion in 2024 and is estimated to grow at a CAGR of 5.8% to reach USD 79.4 billion by 2034. The growing awareness among consumers about food transparency, natural origins, and minimal processing is playing a significant role in shaping this market. With the increasing demand for recognizable, easy-to-understand ingredients, food manufacturers are opting for clean label solutions that don't compromise on performance or shelf life. These additives, derived from plants, microbes, minerals, and animals, are being widely used to replace synthetic counterparts while maintaining the taste, appearance, and quality of processed foods.
Their functions extend to preserving freshness, enhancing flavors, improving texture, supporting emulsification, and delivering natural colors and sweetness. This shift toward simplicity and natural origins in ingredient sourcing is supported by rising consumer skepticism toward artificial additives and a preference for food that aligns with healthy and ethical choices. As a result, clean label formulations have become a vital strategy for food brands across major categories, allowing them to retain consumer trust and respond to market demand for minimally processed, better-for-you foods.
| Market Scope | |
|---|---|
| Start Year | 2024 |
| Forecast Year | 2025-2034 |
| Start Value | $45.3 Billion |
| Forecast Value | $79.4 Billion |
| CAGR | 5.8% |
Among the key ingredients, natural flavors commanded a 22.2% share of the market in 2024 and are projected to expand at a CAGR of 5.8% through 2034. These ingredients appeal to consumers seeking authenticity, as they are derived from fruits, herbs, spices, and other plant-based sources. Their versatility in enhancing the taste of dairy products, baked goods, beverages, and snacks without relying on artificial components supports their growing prominence in clean label product development.
When viewed by ingredient source, plant-based additives led the market with a 42.6% share in 2024 and are expected to grow at a CAGR of 6% through 2034. Rising interest in sustainability, animal welfare, and plant-forward diets has fueled the demand for clean label ingredients derived from fruits, vegetables, grains, and legumes. These ingredients meet clean label expectations by offering natural alternatives to synthetic compounds, thus enabling brands to formulate products that reflect ethical and environmental consciousness.
Based on form, the dry or powder segment generated revenues exceeding USD 20.3 billion in 2024. Their longer shelf life, ease of storage, and compatibility with automated manufacturing processes make them an ideal choice for baked goods, snacks, and drink mixes. Their widespread use stems from the convenience and stability they offer to manufacturers and consumers alike. Meanwhile, liquid additives are gaining traction, particularly in applications such as sauces and dairy products, where ease of blending and consistency in flavor delivery are valued.
From a certification standpoint, the natural segment reached USD 13.4 billion in 2024, dominating the market due to its strong association with health, transparency, and minimal processing. Consumers tend to trust the "natural" label, believing it represents safety and ingredient integrity. This is followed by a growing demand for organic and non-GMO labels, driven by concerns over synthetic chemicals and genetic modification. Although still emerging, clean label certified products are seen as offering the highest level of assurance and are likely to gain ground in regulated or high-end markets.
Among end-use categories, bakery and confectionery products accounted for the largest market share, contributing 24.3% in 2024 and expected to grow at a CAGR of 6.2% through 2034. The preference for clean, plant-based ingredients in baked treats like bread, cakes, and cookies continues to drive innovation in this segment. Food producers are substituting artificial sweeteners, colors, and preservatives with clean label options to satisfy customer demand for healthier choices.
The beverage segment is also witnessing steady growth due to the increasing popularity of natural and functional drinks. Clean label additives are being used in dairy and frozen foods, particularly in yogurts and frozen desserts, as consumers demand transparency in everyday items. Sauces, condiments, snacks, and ready meals are also shifting toward clean formulations to appeal to health-focused shoppers. The meat, poultry, and seafood categories are gradually reducing synthetic preservatives and coloring agents to align with clean label standards while maintaining food safety.
In terms of functionality, flavor and color enhancement led the segment with USD 13.6 billion in 2024. The drive for more vibrant, appealing, and naturally flavored foods continues to rise, especially in segments where appearance heavily influences purchase decisions. Plant-based extracts, herbs, and fruits commonly replace artificial colors and flavors, helping brands align with the demand for healthier, visually attractive foods.
The market segmented by consumer profile shows that conventional products accounted for 30.9% of the total market in 2024 and are forecast to expand at a CAGR of 5.7% through 2034. These products have become a focal point for clean label integration as brands work to reformulate staple items like bread, sauces, and snacks to meet everyday clean eating expectations. While premium, wellness, and children's products continue to highlight clean label features, the inclusion of such ingredients in mainstream goods shows that clean label is no longer a niche concept-it's the new standard.
In regional terms, the U.S. led the North American clean labelled food additives market, reaching USD 9 billion in 2024, and is expected to grow at a CAGR of 5.6% through 2034. This leadership stems from heightened consumer awareness, regulatory support, and extensive clean label product offerings. American consumers are especially mindful of ingredients and increasingly demand products free from artificial additives. Manufacturers are responding by incorporating clean label principles across nearly every food category.
Leading players in the global clean labelled food additives space include Cargill, Ingredion, ADM, Kerry Group, and Tate & Lyle. These companies have strong global footprints, diverse product portfolios, and robust distribution systems, positioning them as key suppliers for the increasing demand for clean label solutions worldwide.
Table of Contents
Chapter 1 Methodology & Scope
- 1.1 Market scope & definition
- 1.2 Base estimates & calculations
- 1.3 Forecast calculation
- 1.4 Data sources
- 1.4.1 Primary
- 1.4.2 Secondary
- 1.4.2.1 Paid sources
- 1.4.2.2 Public sources
- 1.5 Primary research and validation
- 1.5.1 Primary sources
- 1.5.2 Data mining sources
Chapter 2 Executive Summary
- 2.1 Industry 360° synopsis
- 2.2 Key market trends
- 2.2.1 Regional
- 2.2.2 Ingredient type
- 2.2.3 Form
- 2.2.4 Origin
- 2.2.5 Beverage type
- 2.2.6 Flavor type
- 2.3 TAM Analysis, 2025-2034
- 2.4 CXO perspectives: Strategic imperatives
- 2.4.1 Executive decision points
- 2.4.2 Critical success factors
- 2.5 Future Outlook and Strategic Recommendations
Chapter 3 Industry Insights
- 3.1 Industry ecosystem analysis
- 3.1.1 Supplier Landscape
- 3.1.2 Profit Margin
- 3.1.3 Value addition at each stage
- 3.1.4 Factor affecting the value chain
- 3.1.5 Disruptions
- 3.2 Industry impact forces
- 3.2.1 Growth drivers
- 3.2.2 Industry pitfalls and challenges
- 3.2.3 Market opportunities
- 3.3 Growth potential analysis
- 3.4 Regulatory landscape
- 3.4.1 North America
- 3.4.2 Europe
- 3.4.3 Asia Pacific
- 3.4.4 Latin America
- 3.4.5 Middle East & Africa
- 3.5 Porter's analysis
- 3.6 PESTEL analysis
- 3.6.1 Technology and Innovation landscape
- 3.6.2 Current technological trends
- 3.6.3 Emerging technologies
- 3.7 Price trends
- 3.7.1 By region
- 3.7.2 By product
- 3.8 Future market trends
- 3.9 Technology and Innovation landscape
- 3.9.1 Current technological trends
- 3.9.2 Emerging technologies
- 3.10 Patent Landscape
- 3.11 Trade statistics (HS code)
- 3.11.1 Major importing countries
- 3.11.2 Major exporting countries
- 3.12 Sustainability and environmental aspects
- 3.12.1 Sustainable practices
- 3.12.2 Waste reduction strategies
- 3.12.3 Energy efficiency in production
- 3.12.4 Eco-friendly initiatives
- 3.13 Manufacturing process overview
- 3.13.1 Raw material procurement and preparation
- 3.13.2 Extraction and processing methods
- 3.13.3 Purification and standardization
- 3.13.4 Quality control and testing
- 3.13.5 Packaging and storage
- 3.14 Production cost analysis
- 3.14.1 Raw material costs
- 3.14.2 Processing costs
- 3.14.3 Labor costs
- 3.14.4 Packaging costs
- 3.14.5 Manufacturing overheads
- 3.14.6 Cost optimization strategies
- 3.15 Manufacturing facilities analysis
- 3.15.1 Key manufacturing locations
- 3.15.2 Production capacity assessment
- 3.15.3 Facility expansion plans
- 3.16 Supply chain challenges and solutions
- 3.16.1 Raw material sourcing challenges
- 3.16.2 Quality consistency issues
- 3.16.3 Logistics and transportation
- 3.16.4 Inventory management
- 3.17 Sustainability in manufacturing processes
- 3.17.1 Energy efficiency measures
- 3.17.2 Water conservation practices
- 3.17.3 Waste reduction and management
- 3.17.4 Carbon footprint reduction strategies
- 3.18 Global regulatory framework
- 3.18.1 Regional regulatory frameworks
- 3.18.1.1 North america
- 3.18.1.1.1 Fda regulations and guidelines
- 3.18.1.1.2 Usda organic standards
- 3.18.1.1.3 State-level regulations
- 3.18.1.2 Europe
- 3.18.1.2.1 Efsa guidelines
- 3.18.1.2.2 Eu food additives regulation
- 3.18.1.2.3 Eu organic regulations
- 3.18.1.3 Asia-pacific
- 3.18.1.3.1 China food additive regulations
- 3.18.1.3.2 Japan food additive standards
- 3.18.1.3.3 Other regional regulations
- 3.18.1.1 North america
- 3.18.1 Regional regulatory frameworks
- 3.19 Rest of the world
- 3.20 Clean label definitions and standards
- 3.20.1 Industry-defined standards
- 3.20.2 Retailer-defined standards
- 3.20.3 Consumer perception of clean label
- 3.21 Certification and labeling requirements
- 3.21.1 Organic certification
- 3.21.2 Non-gmo verification
- 3.21.3 Natural claims certification
- 3.21.4 Allergen labeling
- 3.22 Compliance challenges and strategies
- 3.23 Future regulatory trends and implications
- 3.24 Environmental, social, and governance analysis
- 3.24.1 Environmental impact assessment
- 3.24.1.1 Carbon footprint analysis
- 3.24.1.2 Water usage and management
- 3.24.1.3 Land use and biodiversity impact
- 3.24.1.4 Waste generation and management
- 3.24.1 Environmental impact assessment
- 3.25 Social responsibility practices
- 3.25.1.1 Labor practices and working conditions
- 3.25.1.2 Community engagement and support
- 3.25.1.3 Health and nutrition impact
- 3.25.1.4 Ethical sourcing practices
- 3.26 Governance and ethical considerations
- 3.26.1.1 Corporate governance structures
- 3.26.1.2 Transparency and reporting
- 3.26.1.3 Ethical business practices
- 3.26.1.4 Stakeholder engagement
- 3.27 Esg performance benchmarking of key players
- 3.28 Esg risk assessment and mitigation strategies
- 3.29 Future esg trends in the clean labelled food additives industry
- 3.30 Consumer behavior and market trends analysis
- 3.30.1 Consumer preferences and purchasing patterns
- 3.30.1.1 Clean label awareness and understanding
- 3.30.1.2 Willingness to pay premium
- 3.30.1.3 Ingredient avoidance behaviors
- 3.30.1.4 Label reading habits
- 3.30.2 Demographic analysis of clean label consumers
- 3.30.2.1 Age group analysis
- 3.30.2.2 Income level analysis
- 3.30.2.3 Geographic distribution
- 3.30.2.4 Lifestyle and psychographic segmentation
- 3.30.3 Consumer perception of clean labelled food additives
- 3.30.3.1 Perceived health benefits
- 3.30.3.2 Perceived environmental benefits
- 3.30.3.3 Perceived quality and value
- 3.30.3.4 Trust and credibility factors
- 3.30.4 Emerging consumer trends
- 3.30.4.1 Plant-based and vegan preferences
- 3.30.4.2 Allergen-free and free-from trends
- 3.30.4.3 Functional and fortified food preferences
- 3.30.4.4 Sustainability and ethical consumption
- 3.30.5 Impact of digital transformation on consumer engagement
- 3.30.6 Consumer feedback analysis and implications
- 3.30.1 Consumer preferences and purchasing patterns
- 3.31 Technological landscape and innovation analysis
- 3.31.1 Current technological trends
- 3.31.2 Emerging technologies
- 3.31.2.1 Advanced extraction technologies
- 3.31.2.2 Fermentation and biotechnology
- 3.31.2.3 Nanotechnology applications
- 3.31.2.4 High-pressure and non-thermal tech
- 3.31.3 Product innovation trends
- 3.31.3.1 Multi-functional ingredients
- 3.31.3.2 Alternatives to traditional additives
- 3.31.3.3 Novel plant-based ingredients
- 3.31.3.4 Upcycled ingredients
- 3.31.4 Formulation and application innovations
- 3.31.4.1 Shelf-life extension solutions
- 3.31.4.2 Flavor enhancement techniques
- 3.31.4.3 Texturizing solutions
- 3.31.4.4 Color stability innovations
- 3.31.5 Packaging and delivery system innovations
- 3.31.5.1 Sustainable packaging
- 3.31.5.2 Smart packaging
- 3.31.5.3 Portion control packaging
- 3.31.5.4 Extended shelf-life packaging
- 3.31.6 R&d activities and innovation hubs
- 3.31.7 Technology adoption trends across regions
- 3.31.8 Future technology roadmap (2025-2034)
- 3.32 Pricing analysis and economic factors
- 3.32.1 Pricing trends
- 3.32.1.1 Historical price trends
- 3.32.1.2 Current pricing scenario
- 3.32.1.3 Price forecast
- 3.32.2 Factors affecting pricing
- 3.32.2.1 Raw material costs
- 3.32.2.2 Processing costs
- 3.32.2.3 Compliance costs
- 3.32.2.4 Market competition
- 3.32.2.5 Consumer willingness to pay
- 3.32.3 Pricing strategies
- 3.32.3.1 Premium vs. Mass market
- 3.32.3.2 Value-added pricing
- 3.32.3.3 Bundle pricing
- 3.32.4 Regional price variations
- 3.32.5 Price-value relationship analysis
- 3.32.6 Economic indicators
- 3.32.6.1 Gdp growth and consumer spending
- 3.32.6.2 Inflation and currency fluctuations
- 3.32.6.3 Agricultural commodity prices
- 3.32.6.4 Energy cost
- 3.32.1 Pricing trends
- 3.33 Supplier landscape
- 3.34 Profit margin analysis
- 3.35 Key news & initiatives
- 3.36 Regulatory landscape
- 3.37 Impact forces
- 3.37.1 Growth drivers
- 3.37.1.1 The rising consumer preference for clean-label products
- 3.37.1.2 Expanding food & beverage industry
- 3.37.1.3 Expansion of plant-based and organic food products requiring clean-label ingredient
- 3.37.2 Industry pitfalls & challenges
- 3.37.2.1 High cost of clean labelled food additives
- 3.37.2.2 Challenges in maintaining taste, texture, and shelf life without artificial preservatives
- 3.37.1 Growth drivers
- 3.38 Growth potential analysis
- 3.39 Porter's analysis
- 3.40 PESTEL analysis
Chapter 4 Competitive Landscape, 2024
- 4.1 Introduction
- 4.2 Company market share analysis
- 4.2.1 By region
- 4.2.2 North America
- 4.2.3 Europe
- 4.2.4 Asia Pacific
- 4.2.5 LATAM
- 4.2.6 MEA
- 4.3 Company matrix analysis
- 4.4 Competitive analysis of major market players
- 4.5 Competitive positioning matrix
- 4.6 Key developments
- 4.6.1 Mergers & acquisitions
- 4.6.2 Partnerships & collaborations
- 4.6.3 New Product Launches
- 4.6.4 Expansion Plans
Chapter 5 Market Size and Forecast, By Ingredient Type 2021 - 2034 (USD Billion, Kilo Tons)
- 5.1 Key trends
- 5.2 Natural colors
- 5.3 Natural flavors
- 5.4 Natural preservatives
- 5.5 Natural sweeteners
- 5.6 Hydrocolloids and texturizers
- 5.7 Functional native starches
- 5.8 Natural emulsifiers
- 5.9 Other
Chapter 6 Market Size and Forecast, By Source, 2021 - 2034 (USD Billion, Kilo Tons)
- 6.1 Key trends
- 6.2 Plant-based
- 6.3 Animal-based
- 6.4 Microbial/fermentation
- 6.5 Mineral-based
Chapter 7 Market Size and Forecast, By Form, 2021 - 2034 (USD Billion, Kilo Tons)
- 7.1 Key trend
- 7.2 Dry/powder
- 7.3 Liquid
- 7.4 Others
Chapter 8 Market Size and Forecast, By Certification, 2021 - 2034 (USD Billion, Kilo Tons)
- 8.1 Key trend
- 8.2 Organic
- 8.3 Non-GMO
- 8.4 Natural
- 8.5 Clean label certified
- 8.6 Others
Chapter 9 Market Size and Forecast, By End Use, 2021 - 2034 (USD Billion, Kilo Tons)
- 9.1 Key trend
- 9.2 Bakery & confectionery
- 9.3 Beverages
- 9.4 Dairy & frozen
- 9.5 Processed foods
- 9.6 Sauces & condiments
- 9.7 Snacks & convenience
- 9.8 Meat, poultry & Seafood
- 9.9 Others
Chapter 10 Market Size and Forecast, By Functionality, 2021 - 2034 (USD Billion, Kilo Tons)
- 10.1 Key trend
- 10.2 Preservation
- 10.3 Texture modification
- 10.4 Flavor/color enhancement
- 10.5 Emulsification
- 10.6 Sweetening
- 10.7 Others
Chapter 11 Market Size and Forecast, By Consumer, 2021 - 2034 (USD Billion, Kilo Tons)
- 11.1 Key trend
- 11.2 Conventional product
- 11.3 Premium product
- 11.4 Health & wellness product
- 11.5 Children’s products
- 11.6 Others
Chapter 12 Market Estimates and Forecast, By Region, 2021 - 2034 (USD Billion) (Kilo Tons)
- 12.1 Key trends
- 12.2 North America
- 12.2.1 U.S.
- 12.2.2 Canada
- 12.3 Europe
- 12.3.1 Germany
- 12.3.2 UK
- 12.3.3 France
- 12.3.4 Spain
- 12.3.5 Italy
- 12.4 Asia Pacific
- 12.4.1 China
- 12.4.2 India
- 12.4.3 Japan
- 12.4.4 Australia
- 12.4.5 South Korea
- 12.5 Latin America
- 12.5.1 Brazil
- 12.5.2 Mexico
- 12.5.3 Argentina
- 12.6 Middle East and Africa
- 12.6.1 Saudi Arabia
- 12.6.2 South Africa
- 12.6.3 UAE
Chapter 13 Company Profiles
- 13.1 ADM
- 13.2 Cargill
- 13.3 Corbion Inc.
- 13.4 DSM
- 13.5 Frutarom
- 13.6 Ingredion
- 13.7 International Flavors & Fragrances Inc.
- 13.8 Kemin Industries, Inc.
- 13.9 Kerry Group
- 13.10 Sensient Technologies
- 13.11 Tate & Lyle
