
再生可能エネルギー証書市場の市場機会、成長促進要因、産業動向分析、2025~2034年予測
Renewable Energy Certificate (REC) Market Opportunity, Growth Drivers, Industry Trend Analysis, and Forecast 2025 - 2034- 発行日
- ページ情報
- 英文 138 Pages
- 納期
- 2~3営業日
- 商品コード
- 1740867
- カスタマイズ可能 お客様のご希望に応じて、既存データの加工や未掲載情報(例:国別セグメント)の追加などの対応が可能です。詳細はお問い合わせください。
- 翻訳ツール提供対象 PDF対応AI翻訳ツールの無料貸し出しサービスのご利用が可能です
概要
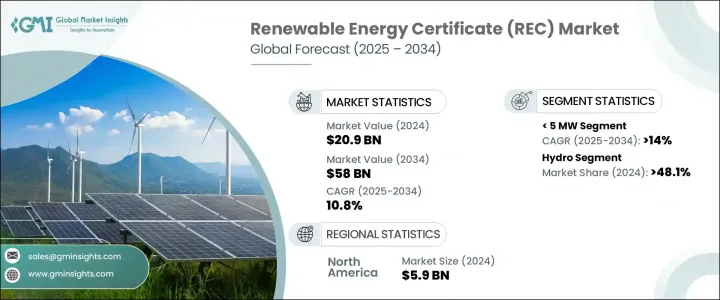
世界の再生可能エネルギー証書市場は、2024年に209億米ドルと評価され、持続可能なエネルギーに対する世界の需要の高まりと、企業や消費者の環境に対する責任意識の高まりを背景に、CAGR10.8%で成長し、2034年には580億米ドルに達すると推定されています。
この著しい成長軌道は、技術革新、支援政策、よりクリーンなエネルギー源への世界のエネルギー戦略のシフトの組み合わせによって後押しされています。
先端技術の統合は、特に透明性の向上と不正行為の可能性の低減において、市場運営を顕著に改善しました。ブロックチェーンは、安全で追跡可能なREC取引を可能にすることで重要な役割を果たしており、これは証明書の真正性と信頼性を維持するために不可欠です。さらに、国際認証プロトコルなどの標準化された枠組みは、異なる地理的市場間でのRECの発行と取引を合理化し、国境を越えた取引をよりスムーズで効率的なものにしています。
| 市場範囲 | |
|---|---|
| 開始年 | 2024 |
| 予測年 | 2025-2034 |
| 開始金額 | 209億米ドル |
| 予測金額 | 580億米ドル |
| CAGR | 10.8% |
RECは、多くの国々で支持を集め続けており、より広範な持続可能性目標の一環としてRECを採用する企業や個人が増えています。これらの証書は、風力、太陽光、水力、バイオマスなどの再生可能エネルギー源から一定量の電力を発電したことを公式に証明する役割を果たします。カーボンニュートラルの目標達成を目指す企業にとって、再生可能エネルギー発電は、直接発電することなく、再生可能エネルギーをサポートするための実用的で検証可能な手段を提供します。
市場セグメンテーションでは、容量は5MW、5MW超15MW以下、15MW超30MW以下、30MW超に分類されます。このうち、5MWの分野が最も急成長が見込まれ、2034年までのCAGRは14%以上と予測されています。この成長の主な要因は、技術コストの低下と設置効率の世界の向上により、小規模太陽光発電所の導入が一般的になりつつあるためです。
発電源の観点から、市場はバイオエネルギー、太陽光、風力、水力、廃棄物、その他のカテゴリーに分類されます。2024年には水力発電が市場をリードし、REC取引全体の48.1%以上を占めました。その主導的地位は、インセンティブや政策枠組みを通じて水力発電の導入を奨励する、政府の有利な支援によるものです。水力エネルギーの高い効率性と信頼性は、エネルギー供給の一貫性を犠牲にすることなく再生可能エネルギー容量を拡大したい国々にとって、魅力的な選択肢となっています。
北米は引き続き世界のREC産業における重要なプレーヤーであり、市場規模は2022年に50億米ドル、2023年に54億米ドル、2024年に59億米ドルと評価されています。この地域は、クリーンエネルギーへの移行と野心的な二酸化炭素削減目標の達成に重点を置いているため、RECは持続可能性インフラの不可欠な一部となっています。北米におけるREC需要の増加は、コンプライアンス義務、企業の自発的なコミットメント、進歩的なエネルギー調達慣行によって形成されています。
RECは、企業やユーティリティ企業が環境に関する義務や社内の持続可能性目標に沿うための重要なメカニズムとして機能しています。RECを取得することで、企業は再生可能エネルギー発電への支持を示し、物理的なエネルギー消費の設定を変えることなく温室効果ガス排出量の削減に貢献することができます。この柔軟性により、RECは、環境・社会・ガバナンス(ESG)プロファイルを強化しようとする企業にとって、特に魅力的なものとなっています。
市場のリーダーシップは、市場シェアの30%以上を占める一握りの企業に集中しています。これらの企業には、デジタル・プラットフォーム、国際的パートナーシップ、統合エネルギー取引ネットワークに多額の投資を行ってきた大手企業が含まれます。こうした企業の優位性は、戦略的関係、長期契約、継続的な技術進歩によって強化されています。これらの企業の多くは、市場の透明性を高め、顧客のRECポートフォリオ管理をサポートすることを目的とした、革新的なツールやデータ・プラットフォームも導入しています。
目次
第1章 調査手法と範囲
第2章 エグゼクティブサマリー
第3章 業界考察
- エコシステム分析
- トランプ政権の関税分析
- 貿易への影響
- 貿易量の混乱
- 報復措置
- 業界への影響
- 供給側の影響(原材料)
- 主要原材料の価格変動
- サプライチェーンの再構築
- 生産コストへの影響
- 需要側の影響(販売価格)
- 最終市場への価格伝達
- 市場シェアの動向
- 消費者の反応パターン
- 供給側の影響(原材料)
- 影響を受ける主要企業
- 戦略的な業界対応
- サプライチェーンの再構成
- 価格設定と製品戦略
- 政策関与
- 展望と今後の検討事項
- 貿易への影響
- 規制情勢
- 業界への影響要因
- 促進要因
- 業界の潜在的リスク&課題
- 成長可能性分析
- ポーター分析
- PESTEL分析
第4章 競合情勢
- イントロダクション
- 戦略的ダッシュボード
- 戦略的取り組み
- 企業の市場シェア
- 競合ベンチマーキング
- イノベーションと持続可能性の情勢
第5章 市場規模・予測:容量別、2021-2034
- 主要動向
- 5MW未満
- 5MW~15MW以上
- 15MW~30MW以上
- 30MW以上
第6章 市場規模・予測:タイプ別、2021-2034
- 主要動向
- ボランタリー
- コンプライアンス
第7章 市場規模・予測:ソース別、2021-2034
- 主要動向
- バイオエネルギー
- 水力発電
- 太陽
- 風
- 無駄
- その他
第8章 市場規模・予測:地域別、2021-2034
- 主要動向
- 北米
- 欧州
- アジア太平洋地域
- 世界のその他の地域
第9章 企業プロファイル
- 3Degrees
- Ecohz
- Shell
- Statkraft
- Xpansiv
- ENGIE
- Enel Green Power
- STX Group
- TerraPass
- BEF
- Targray
- Ameresco
- Sterling Planet
- Constellation
目次
The Global Renewable Energy Certificate Market was valued at USD 20.9 billion in 2024 and is estimated to grow at a CAGR of 10.8% to reach USD 58 billion by 2034, driven by growing global demand for sustainable energy and increasing awareness of environmental responsibility among corporations and consumers. This significant growth trajectory is fueled by a combination of technological innovations, supportive policies, and a shift in global energy strategies toward cleaner sources.
The integration of advanced technologies has notably improved market operations, particularly in enhancing transparency and reducing the chances of fraudulent activities. Blockchain is playing a key role by enabling secure, traceable REC transactions, which is critical for maintaining the authenticity and trustworthiness of certificates. Additionally, standardized frameworks such as international certification protocols have helped streamline the issuance and trading of RECs across different geographic markets, making cross-border trade smoother and more efficient.
| Market Scope | |
|---|---|
| Start Year | 2024 |
| Forecast Year | 2025-2034 |
| Start Value | $20.9 Billion |
| Forecast Value | $58 Billion |
| CAGR | 10.8% |
RECs continue to gain traction in numerous countries, with a growing number of businesses and individuals embracing them as part of broader sustainability goals. These certificates serve as official proof of the generation of a specific amount of electricity from renewable sources such as wind, solar, hydro, or biomass. For companies aiming to meet carbon neutrality goals, RECs provide a practical and verifiable path to support renewable energy without the need to generate it directly.
In terms of capacity segmentation, the market is categorized into installations of 5 MW, greater than 5 MW up to 15 MW, over 15 MW up to 30 MW, and those exceeding 30 MW. Among these, the 5 MW segment is expected to witness the fastest growth, with a projected CAGR of more than 14% through 2034. This growth is largely attributed to the increasing deployment of small-scale solar farms, which are becoming more common as technological costs decline and installation efficiency improves globally.
From a source perspective, the market is classified into categories such as bioenergy, solar, wind, hydro, waste, and others. Hydropower led the market in 2024, accounting for over 48.1% of total REC transactions. Its leading position is driven by favorable governmental support, which encourages hydro adoption through incentives and policy frameworks. Hydro energy's high efficiency and reliability make it an appealing option for nations looking to expand renewable capacity without sacrificing consistency in energy supply.
North America continues to be a significant player in the global REC industry, with the market valued at USD 5 billion in 2022, USD 5.4 billion in 2023, and USD 5.9 billion in 2024. The region's focus on transitioning toward clean energy and meeting ambitious carbon reduction targets has made RECs an integral part of its sustainability infrastructure. Increasing demand for RECs in North America is being shaped by compliance mandates, voluntary corporate commitments, and progressive energy procurement practices.
RECs serve as a critical mechanism for businesses and utilities to align with environmental mandates and internal sustainability goals. By acquiring RECs, organizations demonstrate their support for renewable power generation and contribute to reducing greenhouse gas emissions without altering their physical energy consumption setup. This flexibility has made RECs particularly attractive to enterprises seeking to enhance their environmental, social, and governance (ESG) profiles.
Market leadership is concentrated among a handful of firms that collectively hold over 30% of the market share. These include major players who have made substantial investments in digital platforms, international partnerships, and integrated energy trading networks. Their dominance is reinforced by strategic relationships, long-term contracts, and ongoing technological advancements. Many of these companies have also introduced innovative tools and data platforms aimed at increasing market transparency and supporting REC portfolio management for their clients.
Table of Contents
Chapter 1 Methodology & Scope
- 1.1 Market scope & definitions
- 1.2 Market estimates & forecast parameters
- 1.3 Forecast calculation
- 1.4 Data sources
- 1.4.1 Primary
- 1.4.2 Secondary
- 1.4.2.1 Paid
- 1.4.2.2 Public
Chapter 2 Executive Summary
- 2.1 Industry synopsis, 2021 - 2034
Chapter 3 Industry Insights
- 3.1 Industry ecosystem analysis
- 3.2 Trump administration tariffs analysis
- 3.2.1 Impact on trade
- 3.2.1.1 Trade volume disruptions
- 3.2.1.2 Retaliatory measures
- 3.2.2 Impact on the industry
- 3.2.2.1 Supply-side impact (raw materials)
- 3.2.2.1.1 Price volatility in key materials
- 3.2.2.1.2 Supply chain restructuring
- 3.2.2.1.3 Production cost implications
- 3.2.2.2 Demand-side impact (selling price)
- 3.2.2.2.1 Price transmission to end markets
- 3.2.2.2.2 Market share dynamics
- 3.2.2.2.3 Consumer response patterns
- 3.2.2.1 Supply-side impact (raw materials)
- 3.2.3 Key companies impacted
- 3.2.4 Strategic industry responses
- 3.2.4.1.1 Supply chain reconfiguration
- 3.2.4.1.2 Pricing and product strategies
- 3.2.4.1.3 Policy engagement
- 3.2.5 Outlook and future considerations
- 3.2.1 Impact on trade
- 3.3 Regulatory landscape
- 3.4 Industry impact forces
- 3.4.1 Growth drivers
- 3.4.2 Industry pitfalls & challenges
- 3.5 Growth potential analysis
- 3.6 Porter's analysis
- 3.6.1 Bargaining power of suppliers
- 3.6.2 Bargaining power of buyers
- 3.6.3 Threat of new entrants
- 3.6.4 Threat of substitutes
- 3.7 PESTEL analysis
Chapter 4 Competitive Landscape, 2024
- 4.1 Introduction
- 4.2 Strategic dashboard
- 4.3 Strategic initiative
- 4.4 Company market share
- 4.5 Competitive benchmarking
- 4.6 Innovation & sustainability landscape
Chapter 5 Market Size and Forecast, By Capacity, 2021 - 2034 (USD Billion)
- 5.1 Key trends
- 5.2 < 5 MW
- 5.3 > 5 MW - 15 MW
- 5.4 > 15 MW - 30 MW
- 5.5 > 30 MW
Chapter 6 Market Size and Forecast, By Type, 2021 - 2034 (USD Billion)
- 6.1 Key trends
- 6.2 Voluntary
- 6.3 Compliance
Chapter 7 Market Size and Forecast, By Source, 2021 - 2034 (USD Billion)
- 7.1 Key trends
- 7.2 Bioenergy
- 7.3 Hydro
- 7.4 Solar
- 7.5 Wind
- 7.6 Waste
- 7.7 Others
Chapter 8 Market Size and Forecast, By Region, 2021 - 2034 (USD Billion)
- 8.1 Key trends
- 8.2 North America
- 8.3 Europe
- 8.4 Asia Pacific
- 8.5 Rest of world
Chapter 9 Company Profiles
- 9.1 3Degrees
- 9.2 Ecohz
- 9.3 Shell
- 9.4 Statkraft
- 9.5 Xpansiv
- 9.6 ENGIE
- 9.7 Enel Green Power
- 9.8 STX Group
- 9.9 TerraPass
- 9.10 BEF
- 9.11 Targray
- 9.12 Ameresco
- 9.13 Sterling Planet
- 9.14 Constellation
- 発行日
- 発行
- Global Market Insights Inc.
- ページ情報
- 英文 138 Pages
- 納期
- 2~3営業日


