
寿司用魚介類市場の市場機会、成長促進要因、産業動向分析、2025年~2034年予測
Sushi Grade Seafood Market Opportunity, Growth Drivers, Industry Trend Analysis, and Forecast 2025 - 2034- 発行日
- ページ情報
- 英文 220 Pages
- 納期
- 2~3営業日
- 商品コード
- 1740814
- カスタマイズ可能 お客様のご希望に応じて、既存データの加工や未掲載情報(例:国別セグメント)の追加などの対応が可能です。詳細はお問い合わせください。
- 翻訳ツール提供対象 PDF対応AI翻訳ツールの無料貸し出しサービスのご利用が可能です
概要
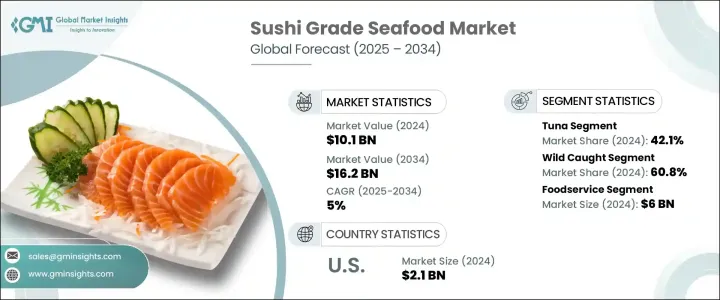
世界の寿司用魚介類市場は、2024年に101億米ドルと評価され、CAGR 5%で成長し、2034年には162億米ドルに達すると予測されています。
この目覚しい成長軌道は、高級で高品質なシーフードに対する世界の食欲の高まりを反映しており、特に寿司は多様な層や地域で人気を集め続けています。日本料理への関心の高まりは、健康志向の高まりや高級な食事体験への欲求と相まって、寿司用グレードの水産物への需要を大幅に急増させています。これらの製品は単なる料理トレンドではなく、栄養価が高く、クリーンラベルのタンパク質を求める健康志向の消費者にとってのライフスタイルの選択肢となっています。寿司用の魚介類は、品質、安全性、鮮度において厳格な基準が設けられており、健康を損なうことなく生食に適しています。厳格なコールドチェーン物流と温度管理により、寄生虫や病原菌によるリスクを排除し、海から食卓まで安全で新鮮な魚介類が保たれます。
世界市場では、消費習慣と購買チャネルの双方に変化が起きています。消費者が寿司や生の魚介類の調理について知識を深めるにつれ、多くの消費者が自信を持って家庭で調理するようになっています。小売業者やオンライン・シーフード・プラットフォームはこの動向を利用し、プロの基準を満たした寿司用の魚を厳選して提供しています。高級レストランから家庭の台所まで、寿司用の魚介類は今や現代消費者の食生活の主食であり、特に高タンパク、低脂肪、栄養豊富な食品を求める人々の間で定番となっています。ソーシャルメディアとデジタルの食文化が需要をさらに煽り、寿司は食べ物のブログ、インフルエンサーのコンテンツ、健康的なライフスタイルの動向などに大きく登場しています。家庭用ミールキットや定額制のシーフード宅配サービスも市場を拡大し、消費者は自宅にいながらにしてレストラン品質の寿司を楽しむことができるようになりました。
| 市場規模 | |
|---|---|
| 開始年 | 2024 |
| 予測年 | 2025-2034 |
| 開始金額 | 101億米ドル |
| 予測金額 | 162億米ドル |
| CAGR | 5% |
米国では、寿司用魚介類は依然として傑出したカテゴリーであり、2024年には21億米ドルを生み出し、2034年までのCAGRは5%と予測されます。米国市場は根強い外食文化の恩恵を受けているが、消費者が家庭で寿司を調理することに慣れ、小売販売も勢いを増しています。沿岸部の都市が引き続き消費をリードしているが、物流の改善と全国的な流通網のおかげで、すしの人気は内陸部にも拡大しつつあります。オンライン・シーフード小売業者や専門食料品店は、トレーサビリティと認証が完備された新鮮で高品質なシーフードを提供し、環境と健康に配慮するバイヤーにアピールしています。
アジアは、豊かな食の伝統を持つ国々に牽引され、生産大国および主要消費市場としての優位性を維持しています。しかし、欧州は急速に追い上げており、寿司レストランや高級スーパーマーケットの数が増え、より幅広い消費者層に寿司グレードの商品を提供しています。英国、ドイツ、フランスなどの国々では、所得の上昇と食の嗜好の変化を背景に、このセグメントが2桁成長を示しています。
製品タイプ別では、市場はマグロ、エビ、サーモン、その他に区分されます。マグロは2024年に42.1%と最大の市場シェアを占める。ビロードのような食感、豊かな風味、高級な位置づけで知られるマグロは、特に高級レストランで、寿司愛好家に好まれる選択肢であり続けています。クロマグロのような高脂肪種が一流の寿司メニューを独占している一方で、持続可能で倫理的に調達されたオプションに対する需要の高まりが、生産者を認証された環境配慮型の調達方法に向かわせています。
その一方で、持続可能で倫理的な調達方法に対する需要の高まりから、生産者は環境に配慮した認証された調達方法を求めるようになっています。調達方法に関しては、天然魚介類が60.8%のシェアを占め、市場をリードしています。しかし、世界の規制が強化され、天然資源がひっ迫するにつれて、安定した品質と供給需要に応えるため、養殖の選択肢が増えつつあります。養殖システムはより高度になり、安全基準、トレーサビリティ、持続可能性の目標に沿った高品質のマグロ、サーモン、エビを提供しています。
Tassal Group、Grupo Nueva Pescanova、Cermaq、Proximar Seafood、Bakkafrostといった業界のリーダー企業は、その地位を確固たるものにするために戦略的なステップを踏んでいます。これらの企業は、持続可能な養殖技術に多額の投資を行い、デジタル販売プラットフォームを拡大し、環境に優しくトレーサブルなサプライチェーンを開発しています。また、市場プレゼンスを拡大し、新たな消費者層にリーチするため、製品認証を追求し、高級小売店やホスピタリティ・ブランドと戦略的パートナーシップを結んでいる企業も多いです。
目次
第1章 調査手法と範囲
第2章 エグゼクティブサマリー
第3章 業界考察
- エコシステム分析
- バリューチェーンに影響を与える要因
- 利益率分析
- ディスラプション
- 将来の展望
- 製造業者
- 販売代理店
- トランプ政権による関税への影響
- 貿易への影響
- 貿易量の混乱
- 報復措置
- 業界への影響
- 供給側の影響(原材料)
- 主要原材料の価格変動
- サプライチェーンの再構築
- 生産コストへの影響
- 需要側の影響(販売価格)
- 最終市場への価格伝達
- 市場シェアの動向
- 消費者の反応パターン
- 供給側の影響(原材料)
- 影響を受ける主要企業
- 戦略的な業界対応
- サプライチェーンの再構成
- 価格設定と製品戦略
- 政策関与
- 展望と今後の検討事項
- 貿易への影響
- 貿易統計(HSコード)
- 主要輸出国、2021-2024
- 主要輸入国、2021-2024
注:上記の貿易統計は主要国についてのみ提供されます
- サプライヤーの情勢
- 利益率分析
- 主なニュースと取り組み
- 規制情勢
- 影響要因
- 促進要因
- 世界中で寿司への需要が高まり、高級シーフードの需要が高まっています
- 寿司用魚介類は、健康と低脂肪食に一致します
- eコマースとDIYキットにより、誰でも寿司を楽しめるようになりました
- 業界の潜在的リスク&課題
- 厳格な品質管理により、運用の複雑さが増します
- 環境制限と調達問題により、サプライチェーンに負担がかかります
- 促進要因
- 成長可能性分析
- ポーター分析
- PESTEL分析
第4章 競合情勢
- イントロダクション
- 企業の市場シェア分析
- 競合ポジショニングマトリックス
- 戦略的展望マトリックス
第5章 市場規模・予測:タイプ別、2021 –2034
- 主要動向
- マグロ
- 鮭
- エビ
- その他(タコ、イカなど)
第6章 市場規模・予測:調達別、2021 –2034
- 主要動向
- 野生捕獲
- 養殖
- その他
第7章 市場規模・予測:流通チャネル別、2021 –2034
- 主要動向
- フードサービス
- 小売り
- 直接販売
第8章 市場推計・予測:地域別、2021 –2034
- 主要動向
- 北米
- 米国
- カナダ
- 欧州
- ドイツ
- 英国
- フランス
- スペイン
- イタリア
- オランダ
- アジア太平洋地域
- 中国
- インド
- 日本
- オーストラリア
- 韓国
- ラテンアメリカ
- ブラジル
- メキシコ
- アルゼンチン
- 中東・アフリカ
- サウジアラビア
- 南アフリカ
- アラブ首長国連邦
第9章 企業プロファイル
- Bakkafrost
- Blue Ocean Mariculture
- Cermaq
- Faroe Islands Salmon Producers
- Grupo Nueva Pescanova
- Ming Hong International
- Mt. Cook Alpine Salmon
- Proximar Seafood
- Seatopia
- Tassal Group
目次
The Global Sushi Grade Seafood Market was valued at USD 10.1 billion in 2024 and is projected to grow at a CAGR of 5% to reach USD 16.2 billion by 2034. This impressive growth trajectory reflects the rising global appetite for premium, high-quality seafood, particularly as sushi continues to gain popularity across diverse demographics and regions. The growing interest in Japanese cuisine, combined with increasing health consciousness and a desire for upscale dining experiences, is driving a significant surge in demand for sushi-grade seafood. These products are not just a culinary trend-they are a lifestyle choice for health-focused consumers seeking nutritious, clean-label proteins. Sushi-grade seafood is held to strict quality, safety, and freshness standards, making it suitable for raw consumption without compromising health. Strict cold chain logistics and temperature controls eliminate risks from parasites and pathogens, ensuring the seafood remains safe and fresh from sea to table.
The global market is experiencing a shift in both consumption habits and purchasing channels. As consumers become more knowledgeable about sushi and raw seafood preparation, many are turning to home preparation with confidence. Retailers and online seafood platforms are capitalizing on this trend, offering curated selections of sushi-grade fish that meet professional standards. From fine dining to home kitchens, sushi-grade seafood is now a staple in the modern consumer's diet, especially among those seeking high-protein, low-fat, and nutrient-rich food options. Social media and digital food culture have further fueled the demand, with sushi appearing prominently in food blogs, influencer content, and healthy lifestyle trends. The accessibility of home meal kits and subscription-based seafood delivery services has also expanded the market, allowing consumers to enjoy restaurant-quality sushi from the comfort of home.
| Market Scope | |
|---|---|
| Start Year | 2024 |
| Forecast Year | 2025-2034 |
| Start Value | $10.1 Billion |
| Forecast Value | $16.2 Billion |
| CAGR | 5% |
In the United States, sushi-grade seafood remains a standout category, generating USD 2.1 billion in 2024 with a steady 5% CAGR projected through 2034. The US market benefits from a strong dining-out culture, but retail sales are gaining momentum as consumers become more comfortable preparing sushi at home. Coastal cities continue to lead in consumption, but sushi's popularity is expanding into inland regions thanks to better logistics and nationwide distribution networks. Online seafood retailers and specialty grocers are key players in this evolution, offering fresh, high-quality seafood with full traceability and certification, appealing to environmentally and health-conscious buyers.
Asia maintains its dominance as a production powerhouse and major consumer market, led by countries with rich culinary traditions. However, Europe is quickly catching up, with an increasing number of sushi restaurants and high-end supermarkets introducing sushi-grade offerings to a broader consumer base. Countries like the UK, Germany, and France are seeing double-digit growth in this segment, driven by rising incomes and changing food preferences.
By product type, the market is segmented into tuna, shrimp, salmon, and others. Tuna holds the largest market share at 42.1% in 2024. Known for its velvety texture, rich flavor, and premium positioning, tuna remains the preferred choice for sushi lovers, especially in fine dining establishments. High-fat varieties like bluefin tuna dominate top-tier sushi menus, while the growing demand for sustainable and ethically sourced options is pushing producers toward certified, eco-conscious sourcing practices.
When it comes to sourcing methods, wild-caught seafood leads the market with a 60.8% share, driven by consumer perceptions of superior taste and higher nutritional value. However, as global regulations tighten and natural resources face strain, farm-raised options are stepping in to meet consistent quality and supply demands. Aquaculture systems are becoming more advanced, offering high-quality tuna, salmon, and shrimp that align with safety standards, traceability, and sustainability goals.
Industry leaders such as Tassal Group, Grupo Nueva Pescanova, Cermaq, Proximar Seafood, and Bakkafrost are taking strategic steps to solidify their positions. These companies are heavily investing in sustainable aquaculture technologies, expanding digital sales platforms, and developing eco-friendly, traceable supply chains. Many are also pursuing product certifications and forming strategic partnerships with premium retail and hospitality brands to broaden their market presence and reach new consumer segments.
Table of Contents
Chapter 1 Methodology & Scope
- 1.1 Market scope & definition
- 1.2 Base estimates & calculations
- 1.3 Forecast calculation
- 1.4 Data sources
- 1.4.1 Primary
- 1.4.2 Secondary
- 1.4.2.1 Paid sources
- 1.4.2.2 Public sources
- 1.5 Primary research and validation
- 1.5.1 Primary sources
- 1.5.2 Data mining sources
Chapter 2 Executive Summary
- 2.1 Industry synopsis, 2021-2034
Chapter 3 Industry Insights
- 3.1 Industry ecosystem analysis
- 3.1.1 Factor affecting the value chain
- 3.1.2 Profit margin analysis
- 3.1.3 Disruptions
- 3.1.4 Future outlook
- 3.1.5 Manufacturers
- 3.1.6 Distributors
- 3.2 Trump administration tariffs
- 3.2.1 Impact on trade
- 3.2.1.1 Trade volume disruptions
- 3.2.1.2 Retaliatory measures
- 3.2.2 Impact on the industry
- 3.2.2.1 Supply-side impact (raw materials)
- 3.2.2.1.1 Price volatility in key materials
- 3.2.2.1.2 Supply chain restructuring
- 3.2.2.1.3 Production cost implications
- 3.2.2.2 Demand-side impact (selling price)
- 3.2.2.2.1 Price transmission to end markets
- 3.2.2.2.2 Market share dynamics
- 3.2.2.2.3 Consumer response patterns
- 3.2.2.1 Supply-side impact (raw materials)
- 3.2.3 Key companies impacted
- 3.2.4 Strategic industry responses
- 3.2.4.1 Supply chain reconfiguration
- 3.2.4.2 Pricing and product strategies
- 3.2.4.3 Policy engagement
- 3.2.5 Outlook and future considerations
- 3.2.1 Impact on trade
- 3.3 Trade statistics (HS Code)
- 3.3.1 Major exporting countries, 2021-2024 (Kilo Tons)
- 3.3.2 Major importing countries, 2021-2024 (Kilo Tons)
Note: the above trade statistics will be provided for key countries only.
- 3.4 Supplier landscape
- 3.5 Profit margin analysis
- 3.6 Key news & initiatives
- 3.7 Regulatory landscape
- 3.8 Impact forces
- 3.8.1 Growth drivers
- 3.8.1.1 Global appetite for sushi fuels demand for premium seafood.
- 3.8.1.2 Sushi grade seafood aligns with wellness and low-fat diets.
- 3.8.1.3 E-commerce and DIY kits make sushi accessible to all.
- 3.8.2 Industry pitfalls & challenges
- 3.8.2.1 Stringent quality controls drive up operational complexity.
- 3.8.2.2 Environmental limits and sourcing issues strain supply chains.
- 3.8.1 Growth drivers
- 3.9 Growth potential analysis
- 3.10 Porter's analysis
- 3.11 PESTEL analysis
Chapter 4 Competitive Landscape, 2024
- 4.1 Introduction
- 4.2 Company market share analysis
- 4.3 Competitive positioning matrix
- 4.4 Strategic outlook matrix
Chapter 5 Market Size and Forecast, By Type, 2021 – 2034 (USD Billion, Kilo Tons)
- 5.1 Key trends
- 5.2 Tuna
- 5.3 Salmon
- 5.4 Shrimp
- 5.5 Others (octopus, squid, etc.)
Chapter 6 Market Size and Forecast, By Sourcing, 2021 – 2034 (USD Billion, Kilo Tons)
- 6.1 Key trends
- 6.2 Wild caught
- 6.3 Farmed
- 6.4 Others
Chapter 7 Market Size and Forecast, By Distribution Channel, 2021 – 2034 (USD Billion, Kilo Tons)
- 7.1 Key trends
- 7.2 Foodservice
- 7.3 Retail
- 7.4 Direct sales
Chapter 8 Market Estimates and Forecast, By Region, 2021 – 2034 (USD Billion) (Kilo Tons)
- 8.1 Key trends
- 8.2 North America
- 8.2.1 U.S.
- 8.2.2 Canada
- 8.3 Europe
- 8.3.1 Germany
- 8.3.2 UK
- 8.3.3 France
- 8.3.4 Spain
- 8.3.5 Italy
- 8.3.6 Netherlands
- 8.4 Asia Pacific
- 8.4.1 China
- 8.4.2 India
- 8.4.3 Japan
- 8.4.4 Australia
- 8.4.5 South Korea
- 8.5 Latin America
- 8.5.1 Brazil
- 8.5.2 Mexico
- 8.5.3 Argentina
- 8.6 Middle East and Africa
- 8.6.1 Saudi Arabia
- 8.6.2 South Africa
- 8.6.3 UAE
Chapter 9 Company Profiles
- 9.1 Bakkafrost
- 9.2 Blue Ocean Mariculture
- 9.3 Cermaq
- 9.4 Faroe Islands Salmon Producers
- 9.5 Grupo Nueva Pescanova
- 9.6 Ming Hong International
- 9.7 Mt. Cook Alpine Salmon
- 9.8 Proximar Seafood
- 9.9 Seatopia
- 9.10 Tassal Group
- 発行日
- 発行
- Global Market Insights Inc.
- ページ情報
- 英文 220 Pages
- 納期
- 2~3営業日