
|
市場調査レポート
商品コード
1716681
電気集じん機市場の機会、成長促進要因、産業動向分析、2025年~2034年の予測Electrostatic Precipitator Market Opportunity, Growth Drivers, Industry Trend Analysis, and Forecast 2025 - 2034 |
||||||
カスタマイズ可能
|
|||||||
| 電気集じん機市場の機会、成長促進要因、産業動向分析、2025年~2034年の予測 |
|
出版日: 2025年03月26日
発行: Global Market Insights Inc.
ページ情報: 英文 153 Pages
納期: 2~3営業日
|

全表示
- 概要
- 目次
電気集じん機の世界市場は2024年に91億米ドルを生み出し、2025年から2034年にかけてCAGR 6.1%で成長すると予測されています。
この成長の主な原動力は、新興国の急速な工業化であり、製鉄、化学生産、石炭火力発電などの産業が拡大を続けています。これらの産業が成長するにつれて、効率的な排出ガス制御システムの需要はますます重要になっています。世界各国の政府は厳しい環境規制を実施しており、産業界は大気汚染を効果的に管理するための高度な技術を導入する必要があります。産業排出物から粒子状物質を効率的に除去する能力で知られる電気集じん機は、産業界がこうした厳しい基準を遵守しようと努力する中で支持を集めています。さらに、環境の持続可能性と有害排出物削減の重要性に対する意識の高まりが、信頼性の高い大気汚染防止技術への投資を産業界に促しています。
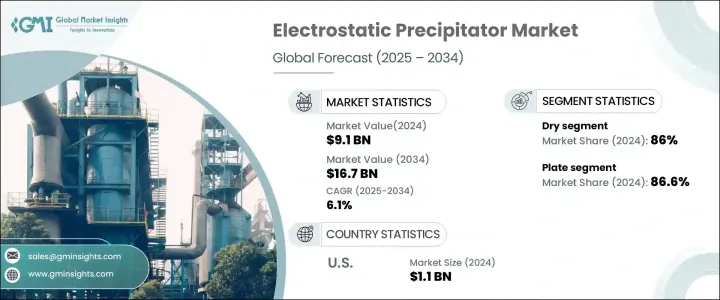
持続可能な産業慣行への注目の高まりと、大気質への懸念に対する一般市民の意識の高まりが、電気集じん機の需要をさらに高めています。さまざまな業界の企業が、進化する環境基準を満たし、二酸化炭素排出量を最小限に抑えるために、汚染防止システムを近代化する必要性を認識しています。新興経済圏、特にアジア太平洋地域では、産業活動の拡大や各国政府による大気質規制の強化に伴い、電気集じん機の需要が急増しています。さらに、エネルギー効率や粒子除去能力の向上など、電気集塵技術の進歩が、業務効率と環境コンプライアンスの両立を目指す産業にとって、これらのシステムの魅力を高めています。
| 市場範囲 | |
|---|---|
| 開始年 | 2024 |
| 予測年 | 2025-2034 |
| 開始金額 | 91億米ドル |
| 予測金額 | 167億米ドル |
| CAGR | 6.1% |
乾式電気集じん機は、排ガスから粒子状物質を効率的に除去する必要がある産業での人気を反映して、2024年の市場シェアの86%を占めました。これらのシステムは、厳しい環境規制の遵守が不可欠なセメントや鉄鋼生産などの分野で特に好まれています。乾式電気集じん機は、運転コストを低く抑えながら微粒子を高効率で捕集できるため、信頼性の高い排出制御ソリューションを求める産業にとって好ましい選択肢となっています。
設計によって、市場はプレート式と管状セグメントに分けられ、プレート式電気集じん機が2024年に86.6%のシェアを占める。プレート式電気集じん機は、最小限のエネルギー消費で乾湿両方の粒子を捕捉できるため、産業用途で広く使用されています。運転コストが低く効率が高いため、信頼性の高い汚染防止技術を必要とする産業にとって理想的なソリューションとなっています。
米国の電気集じん機市場は、汚染防止技術への継続的な投資と大気質規制強化の実施により、2024年に11億米ドルを創出しました。大気質に対する社会的関心が高まるにつれて、電気集じん機の採用はさらに増加し、今後数年間の持続的な市場成長に寄与すると予想されます。より清浄な空気に対する需要の高まりと、環境コンプライアンス基準を満たす産業界の必要性が、米国の電気集じん機市場の拡大を支える主な要因です。
目次
第1章 調査手法と調査範囲
第2章 エグゼクティブサマリー
第3章 業界洞察
- 業界エコシステム
- 規制状況
- 業界への影響要因
- 促進要因
- 業界の潜在的リスク&課題
- 成長可能性分析
- ポーター分析
- PESTEL分析
第4章 競合情勢
- イントロダクション
- 戦略ダッシュボード
- イノベーションとテクノロジーの展望
第5章 市場規模・予測:システム別、2021年~2034年
- 主要動向
- 乾式
- 湿式
第6章 市場規模・予測:設計別、2021年~2034年
- 主要動向
- プレート
- チューブラー
第7章 市場規模・予測:発光産業別、2021年~2034年
- 主要動向
- 発電
- 化学・石油化学
- セメント
- 金属加工・鉱業
- 製造業
- 海洋
- その他
第8章 市場規模・予測:地域別、2021年~2034年
- 主要動向
- 北米
- 米国
- カナダ
- メキシコ
- 欧州
- ドイツ
- 英国
- フランス
- スペイン
- イタリア
- オランダ
- アジア太平洋
- 中国
- インド
- 日本
- 韓国
- インドネシア
- オーストラリア
- 中東・アフリカ
- サウジアラビア
- アラブ首長国連邦
- 南アフリカ
- ナイジェリア
- アンゴラ
- ラテンアメリカ
- ブラジル
- アルゼンチン
- チリ
- ペルー
第9章 企業プロファイル
- Babcock and Wilcox Enterprises
- DURR Group
- DUCON
- FLSmidth
- Fuel Tech
- GEA Group
- GEECO Enercon
- KC Cottrell India
- Monroe Environmental
- Mitsubishi Heavy Industries.
- Sumitomo Heavy Industries
- Trion
- Valmet
- Wood
The Global Electrostatic Precipitator Market generated USD 9.1 billion in 2024 and is projected to grow at a CAGR of 6.1% between 2025 and 2034. This growth is primarily driven by the rapid industrialization of emerging economies, where industries such as steel manufacturing, chemical production, and coal-based power generation continue to expand. As these industries grow, the demand for efficient emissions control systems becomes increasingly critical. Governments worldwide are enforcing strict environmental regulations that require industries to implement advanced technologies to manage air pollution effectively. Electrostatic precipitators, known for their ability to efficiently remove particulate matter from industrial emissions, are gaining traction as industries strive to comply with these stringent standards. Additionally, growing awareness about environmental sustainability and the importance of reducing harmful emissions is pushing industries to invest in reliable air pollution control technologies.
The increasing focus on sustainable industrial practices, along with heightened public awareness of air quality concerns, is further amplifying the demand for electrostatic precipitators. Companies across various industries are recognizing the need to modernize their pollution control systems to meet evolving environmental standards and minimize their carbon footprint. Emerging economies, particularly in Asia-Pacific, are witnessing a surge in demand for electrostatic precipitators as industrial operations expand and governments enforce more rigorous air quality regulations. Moreover, advancements in ESP technology, including improvements in energy efficiency and particle removal capacity, are enhancing the appeal of these systems for industries aiming to balance operational efficiency with environmental compliance.
| Market Scope | |
|---|---|
| Start Year | 2024 |
| Forecast Year | 2025-2034 |
| Start Value | $9.1 Billion |
| Forecast Value | $16.7 Billion |
| CAGR | 6.1% |
The dry electrostatic precipitator segment accounted for 86% of the market share in 2024, reflecting its popularity in industries that require efficient removal of particulate matter from flue gases. These systems are particularly favored in sectors such as cement and steel production, where maintaining compliance with strict environmental regulations is essential. Dry electrostatic precipitators offer high efficiency in capturing fine particles while keeping operational costs low, making them a preferred choice for industries seeking reliable emissions control solutions.
By design, the market is divided into plate and tubular segments, with plate electrostatic precipitators capturing an 86.6% share in 2024. Plate ESPs are widely used in industrial applications due to their ability to capture both dry and wet particles with minimal energy consumption. Their low operating costs and high efficiency make them an ideal solution for industries that need dependable pollution control technologies.
The US electrostatic precipitator market generated USD 1.1 billion in 2024, driven by continued investments in pollution control technologies and the implementation of stricter air quality regulations. As public concern about air quality intensifies, the adoption of electrostatic precipitators is expected to increase further, contributing to sustained market growth in the coming years. The rising demand for cleaner air and the need for industries to meet environmental compliance standards are key factors supporting the expansion of the US electrostatic precipitator market.
Table of Contents
Chapter 1 Methodology & Scope
- 1.1 Research design
- 1.2 Base estimates & calculations
- 1.3 Forecast model
- 1.4 Primary research & validation
- 1.4.1 Primary sources
- 1.4.2 Data mining sources
- 1.5 Market definitions
Chapter 2 Executive Summary
- 2.1 Industry synopsis, 2021 – 2034
Chapter 3 Industry Insights
- 3.1 Industry ecosystem
- 3.2 Regulatory landscape
- 3.3 Industry impact forces
- 3.3.1 Growth drivers
- 3.3.2 Industry pitfalls & challenges
- 3.4 Growth potential analysis
- 3.5 Porter's analysis
- 3.5.1 Bargaining power of suppliers
- 3.5.2 Bargaining power of buyers
- 3.5.3 Threat of new entrants
- 3.5.4 Threat of substitutes
- 3.6 PESTEL analysis
Chapter 4 Competitive Landscape, 2024
- 4.1 Introduction
- 4.2 Strategic dashboard
- 4.3 Innovation & technology landscape
Chapter 5 Market Size and Forecast, By System, 2021 – 2034 (USD Billion)
- 5.1 Key trends
- 5.2 Dry
- 5.3 Wet
Chapter 6 Market Size and Forecast, By Design, 2021 – 2034 (USD Billion)
- 6.1 Key trends
- 6.2 Plate
- 6.3 Tubular
Chapter 7 Market Size and Forecast, By Emitting Industry, 2021 – 2034 (USD Billion)
- 7.1 Key trends
- 7.2 Power generation
- 7.3 Chemicals and petrochemicals
- 7.4 Cement
- 7.5 Metal processing & mining
- 7.6 Manufacturing
- 7.7 Marine
- 7.8 Others
Chapter 8 Market Size and Forecast, By Region, 2021 – 2034 (USD Billion)
- 8.1 Key trends
- 8.2 North America
- 8.2.1 U.S.
- 8.2.2 Canada
- 8.2.3 Mexico
- 8.3 Europe
- 8.3.1 Germany
- 8.3.2 UK
- 8.3.3 France
- 8.3.4 Spain
- 8.3.5 Italy
- 8.3.6 Netherlands
- 8.4 Asia Pacific
- 8.4.1 China
- 8.4.2 India
- 8.4.3 Japan
- 8.4.4 South Korea
- 8.4.5 Indonesia
- 8.4.6 Australia
- 8.5 Middle East & Africa
- 8.5.1 Saudi Arabia
- 8.5.2 UAE
- 8.5.3 South Africa
- 8.5.4 Nigeria
- 8.5.5 Angola
- 8.6 Latin America
- 8.6.1 Brazil
- 8.6.2 Argentina
- 8.6.3 Chile
- 8.6.4 Peru
Chapter 9 Company Profiles
- 9.1 Babcock and Wilcox Enterprises
- 9.2 DURR Group
- 9.3 DUCON
- 9.4 FLSmidth
- 9.5 Fuel Tech
- 9.6 GEA Group
- 9.7 GEECO Enercon
- 9.8 KC Cottrell India
- 9.9 Monroe Environmental
- 9.10 Mitsubishi Heavy Industries.
- 9.11 Sumitomo Heavy Industries
- 9.12 Trion
- 9.13 Valmet
- 9.14 Wood
