|
|
市場調査レポート
商品コード
1716548
光ファイバープリフォーム市場の機会、成長促進要因、産業動向分析、2025年~2034年の予測Fiber Optic Preform Market Opportunity, Growth Drivers, Industry Trend Analysis, and Forecast 2025 - 2034 |
||||||
|
|||||||
カスタマイズ可能
|
|||||||

| 光ファイバープリフォーム市場の機会、成長促進要因、産業動向分析、2025年~2034年の予測 |
|
出版日: 2025年03月24日
発行: Global Market Insights Inc.
ページ情報: 英文 174 Pages
納期: 2~3営業日
|

全表示
- 概要
- 目次
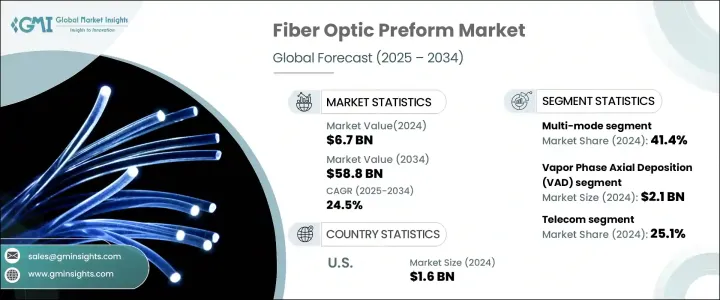
世界の光ファイバープリフォーム市場は、2024年に67億米ドルを生み出し、2025-2034年にCAGR 24.5%で拡大すると予測されています。
この顕著な成長は、5Gネットワークの展開や、より高速で信頼性の高いデータ伝送に対する需要の高まりによって、高速インターネットの採用が増加していることが背景にあります。最新のデジタルインフラが企業と家庭の両方に不可欠になるにつれ、光ファイバ母材はネットワーク容量と性能の強化に極めて重要な役割を果たします。これらのプリフォームは、シームレスな通信、クラウドコンピューティング、人工知能(AI)やモノのインターネット(IoT)などの高度な技術を可能にする光ファイバーケーブルの作成に不可欠です。
世界各国がデジタル接続の改善に注力しているため、政府の取り組みや光ファイバーインフラへの多額の投資は、市場の拡大をさらに加速させています。さらに、ハイパースケールおよびエッジベースのデータセンターの急増は、増大するデータトラフィックをサポートする高度な光ファイバーソリューションの必要性を浮き彫りにしています。ビデオストリーミング、オンラインゲーム、クラウドサービスなど、データ集約型アプリケーションの急増に対応できる大容量ネットワークへの嗜好が高まっていることも、市場の上昇軌道をさらに強めています。
| 市場規模 | |
|---|---|
| 開始年 | 2024 |
| 予測年 | 2025-2034 |
| 開始金額 | 67億米ドル |
| 予測金額 | 588億米ドル |
| CAGR | 24.5% |
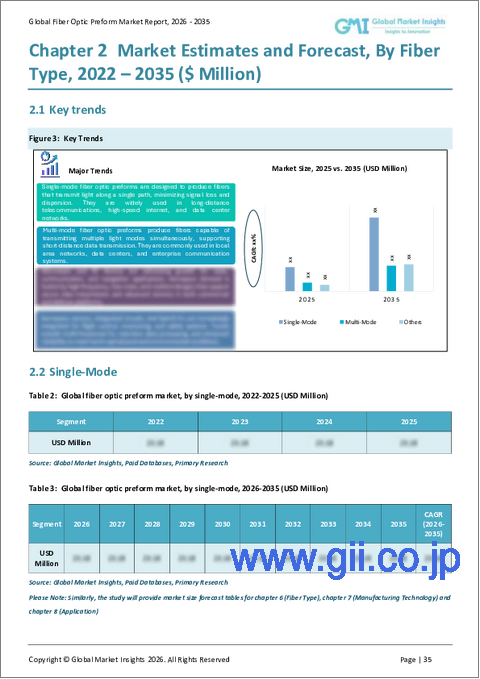
市場は製品タイプ別にシングルモード、マルチモード、その他のカテゴリーに区分されます。2024年には、マルチモードセグメントが市場シェアの41.4%を占める。マルチモードファイバーは短距離通信に適しており、100G、400G、800Gなどの先進イーサネット技術をサポートしています。シングルモード・ファイバーに比べ、短距離用途でのコスト効率が高いため、ローカルエリアネットワーク(LAN)やストレージエリアネットワーク(SAN)を導入する企業にとって好ましい選択肢となっています。また、マルチモードファイバーは、短い距離で高いデータ転送レートを効率的に処理できることでも知られており、企業ネットワークには欠かせないものとなっています。
光ファイバープリフォーム市場は、プロセス別にMCVD(Modified Chemical Vapor Deposition)、VAD(Vapor Phase Axial Deposition)、OVD(Outside Vapor Deposition)、PCVD(Plasma Activated Chemical Vapor Deposition)に分けられます。VADプロセスは2024年に21億米ドルを生み出しました。VADは、安定した品質で長い連続プリフォームを製造できることから、大量生産環境で広く採用されています。この方法によって、メーカーは高精度を維持しながら光ファイバケーブルを大量生産することができ、光ファイバソリューションに対する世界の需要の高まりに対応することができます。
米国の光ファイバプリフォーム市場は、大容量ネットワークに対する需要の高まりとデジタルインフラへの投資の増加を反映して、2024年に16億米ドルを生み出しました。クラウドコンピューティングとAIの急成長でデータセンタが拡大し、信頼性の高い光ファイバソリューションに対する需要が高まっています。大手通信会社は、より高速で信頼性の高い接続に対するニーズの高まりに対応するため、光ファイバーインフラに多額の投資を行っています。消費者と企業の両方がデータ伝送能力の向上を求めているため、光ファイバー用プリフォームは依然として国のデジタルインフラ強化に不可欠な要素となっています。
目次
第1章 調査手法と調査範囲
第2章 エグゼクティブサマリー
第3章 業界洞察
- エコシステム分析
- バリューチェーンに影響を与える要因
- 利益率分析
- ディスラプション
- 将来の展望
- メーカー
- 流通業者
- サプライヤーの状況
- 利益率分析
- 主要ニュース
- 規制状況
- 影響要因
- 促進要因
- 5Gネットワークの急速な普及
- 有利な政府のイニシアティブと投資
- 高速インターネット需要の増加
- 海底ケーブル配備の拡大
- 光ファイバー技術の進歩の高まり
- 業界の潜在的リスク&課題
- 高い生産コスト
- 変動する原材料価格
- 促進要因
- 成長可能性分析
- ポーター分析
- PESTEL分析
第4章 競合情勢
- イントロダクション
- 企業シェア分析
- 競合のポジショニング・マトリックス
- 戦略展望マトリックス
第5章 市場推計・予測:製品タイプ別、2021年~2034年
- 主要動向
- シングルモード
- マルチモード
- その他
第6章 市場推計・予測:プロセス別、2021年~2034年
- 主要動向
- 気相軸蒸着法(VAD)
- 修正化学気相成長法(MCVD)
- 外部蒸着(OVD)
- プラズマ活性化化学気相成長法(PCVD)
第7章 市場推計・予測:最終用途産業別、2021年~2034年
- 主要動向
- テレコム
- 石油・ガス
- 軍事・航空宇宙
- BFSI
- 医療
- 鉄道
- その他
第8章 市場推計・予測:地域別、2021年~2034年
- 主要動向
- 北米
- 米国
- カナダ
- 欧州
- 英国
- ドイツ
- フランス
- イタリア
- スペイン
- ロシア
- アジア太平洋
- 中国
- インド
- 日本
- 韓国
- オーストラリア
- ラテンアメリカ
- ブラジル
- メキシコ
- 中東・アフリカ
- 南アフリカ
- サウジアラビア
- アラブ首長国連邦
第9章 企業プロファイル
- Corning Incorporated
- Fasten Group
- FCJ OPTO TECH
- Fujikura Ltd.
- Futong Group
- Hengtong Group
- Heraeus Holding GmbH
- Jiangsu Zhongtian Technology Co., Ltd.
- OFS Fitel, LLC
- Prysmian Group
- Rosendahl Nextrom GmbH
- Shin-Etsu Chemical Co., Ltd
- Sterlite Technologies Limited
- Sumitomo Electric Industries, Ltd
- Yangtze Optical Fibre(YOFC)
The Global Fiber Optic Preform Market generated USD 6.7 billion in 2024 and is expected to expand at a CAGR of 24.5% during 2025-2034. This remarkable growth is fueled by the increasing adoption of high-speed internet, driven by the rollout of 5G networks and rising demand for faster and more reliable data transmission. As modern digital infrastructure becomes essential for both businesses and households, fiber optic preforms play a pivotal role in enhancing network capacity and performance. These preforms are vital in creating fiber optic cables that enable seamless communication, cloud computing, and advanced technologies such as artificial intelligence (AI) and the Internet of Things (IoT).
Government initiatives and substantial investments in fiber infrastructure further accelerate market expansion, as countries worldwide focus on improving digital connectivity. Additionally, the proliferation of data centers, both hyperscale and edge-based, highlights the need for advanced fiber optic solutions to support the growing volume of data traffic. The increasing preference for high-capacity networks that can handle the surge in data-intensive applications, including video streaming, online gaming, and cloud services, further strengthens the market's upward trajectory.
| Market Scope | |
|---|---|
| Start Year | 2024 |
| Forecast Year | 2025-2034 |
| Start Value | $6.7 Billion |
| Forecast Value | $58.8 Billion |
| CAGR | 24.5% |
The market is segmented by product type into single-mode, multi-mode, and other categories. In 2024, the multi-mode segment held 41.4% of the market share. Multi-mode fibers are well-suited for short-distance communication, supporting advanced Ethernet technologies such as 100G, 400G, and 800G. Their cost-effectiveness in short-range applications, compared to single-mode fibers, makes them the preferred choice for businesses implementing Local Area Networks (LAN) and Storage Area Networks (SAN). Multi-mode fibers are also known for their ability to handle high data transmission rates efficiently over shorter distances, making them indispensable for enterprise networks.
By process, the fiber optic preform market is divided into Modified Chemical Vapor Deposition (MCVD), Vapor Phase Axial Deposition (VAD), Outside Vapor Deposition (OVD), and Plasma Activated Chemical Vapor Deposition (PCVD). The VAD process generated USD 2.1 billion in 2024. VAD is widely adopted in mass production environments due to its ability to produce long, continuous preforms with consistent quality. This method enables manufacturers to produce fiber optic cables in large quantities while maintaining high precision, meeting the increasing global demand for fiber optic solutions.
The U.S. fiber optic preform market generated USD 1.6 billion in 2024, reflecting the rising demand for high-capacity networks and increased investment in digital infrastructure. The rapid growth of cloud computing and AI has led to the expansion of data centers, creating a higher demand for reliable fiber optic solutions. Major telecommunications companies are investing heavily in fiber infrastructure to meet the growing need for faster and more reliable connectivity. As both consumers and businesses seek improved data transmission capabilities, fiber optic preforms remain an integral component in strengthening the country's digital infrastructure.
Table of Contents
Chapter 1 Methodology & Scope
- 1.1 Market scope & definitions
- 1.2 Base estimates & calculations
- 1.3 Forecast calculations
- 1.4 Data sources
- 1.4.1 Primary
- 1.4.2 Secondary
- 1.4.2.1 Paid sources
- 1.4.2.2 Public sources
Chapter 2 Executive Summary
- 2.1 Industry synopsis, 2021-2034
Chapter 3 Industry Insights
- 3.1 Industry ecosystem analysis
- 3.1.1 Factor affecting the value chain
- 3.1.2 Profit margin analysis
- 3.1.3 Disruptions
- 3.1.4 Future outlook
- 3.1.5 Manufacturers
- 3.1.6 Distributors
- 3.2 Supplier landscape
- 3.3 Profit margin analysis
- 3.4 Key news & initiatives
- 3.5 Regulatory landscape
- 3.6 Impact forces
- 3.6.1 Growth drivers
- 3.6.1.1 Rapid proliferation of 5G networks
- 3.6.1.2 Favorable government initiatives and investments
- 3.6.1.3 Increase in demand for high-speed internet
- 3.6.1.4 Growing deployment of submarine cable
- 3.6.1.5 Rise in advancements in fiber optic technology
- 3.6.2 Industry pitfalls & challenges
- 3.6.2.1 High production costs
- 3.6.2.2 Fluctuating raw material prices
- 3.6.1 Growth drivers
- 3.7 Growth potential analysis
- 3.8 Porter's analysis
- 3.9 PESTEL analysis
Chapter 4 Competitive Landscape, 2024
- 4.1 Introduction
- 4.2 Company market share analysis
- 4.3 Competitive positioning matrix
- 4.4 Strategic outlook matrix
Chapter 5 Market Estimates & Forecast, By Product Type, 2021-2034 (USD Billion)
- 5.1 Key trends
- 5.2 Single-Mode
- 5.3 Multi-Mode
- 5.4 Others
Chapter 6 Market Estimates & Forecast, By Process, 2021-2034 (USD Billion)
- 6.1 Key trends
- 6.2 Vapor Phase Axial Deposition (VAD)
- 6.3 Modified Chemical Vapor Deposition (MCVD)
- 6.4 Outside Vapor Deposition (OVD)
- 6.5 Plasma Activated Chemical Vapor Deposition (PCVD)
Chapter 7 Market Estimates & Forecast, By End Use Industry, 2021-2034 (USD Billion)
- 7.1 Key trends
- 7.2 Telecom
- 7.3 Oil & gas
- 7.4 Military & aerospace
- 7.5 BFSI
- 7.6 Medical
- 7.7 Railway
- 7.8 Others
Chapter 8 Market Estimates & Forecast, By Region, 2021-2034 (USD Billion)
- 8.1 Key trends
- 8.2 North America
- 8.2.1 U.S.
- 8.2.2 Canada
- 8.3 Europe
- 8.3.1 UK
- 8.3.2 Germany
- 8.3.3 France
- 8.3.4 Italy
- 8.3.5 Spain
- 8.3.6 Russia
- 8.4 Asia Pacific
- 8.4.1 China
- 8.4.2 India
- 8.4.3 Japan
- 8.4.4 South Korea
- 8.4.5 Australia
- 8.5 Latin America
- 8.5.1 Brazil
- 8.5.2 Mexico
- 8.6 MEA
- 8.6.1 South Africa
- 8.6.2 Saudi Arabia
- 8.6.3 UAE
Chapter 9 Company Profiles
- 9.1 Corning Incorporated
- 9.2 Fasten Group
- 9.3 FCJ OPTO TECH
- 9.4 Fujikura Ltd.
- 9.5 Futong Group
- 9.6 Hengtong Group
- 9.7 Heraeus Holding GmbH
- 9.8 Jiangsu Zhongtian Technology Co., Ltd.
- 9.9 OFS Fitel, LLC
- 9.10 Prysmian Group
- 9.11 Rosendahl Nextrom GmbH
- 9.12 Shin-Etsu Chemical Co., Ltd
- 9.13 Sterlite Technologies Limited
- 9.14 Sumitomo Electric Industries, Ltd
- 9.15 Yangtze Optical Fibre (YOFC)
