
パワーデバイスアナライザの市場機会、成長促進要因、産業動向分析、2025年~2034年の予測
Power Device Analyzer Market Opportunity, Growth Drivers, Industry Trend Analysis, and Forecast 2025 - 2034- 発行日
- ページ情報
- 英文 125 Pages
- 納期
- 2~3営業日
- 商品コード
- 1716531
- カスタマイズ可能 お客様のご希望に応じて、既存データの加工や未掲載情報(例:国別セグメント)の追加などの対応が可能です。詳細はお問い合わせください。
- 翻訳ツール提供対象 PDF対応AI翻訳ツールの無料貸し出しサービスのご利用が可能です
概要
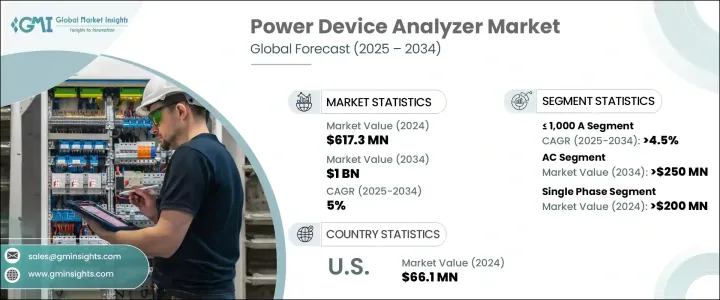
パワーデバイスアナライザの世界市場は、2024年に6億1,730万米ドルに達し、2025年から2034年までのCAGRは5%になると予測されています。
産業界がエネルギー使用の最適化と無駄の削減を模索する中、電力システムを解析する高度なツールに対する需要が急速に高まっています。この急増は、エネルギー効率と持続可能性が重要になっているさまざまな産業分野で特に顕著です。太陽光や風力などの再生可能エネルギー源の電力システムへの統合も、こうした機器の必要性を高めています。また、政府の政策や再生可能エネルギーインフラへの投資も、電力計測システムの普及に重要な役割を果たしています。
送電網の安定性の維持、変動する電力入力の管理、システム効率の向上が重視されるようになっており、これらすべてがパワーデバイスアナライザ市場の拡大をさらに後押ししています。これらのツールは、パワーデバイスが最適に機能し、規制基準を満たしていることを確認する上で極めて重要です。産業界では、自動化や電化プロセスの導入が進んでおり、信頼性の高いシステム性能を確保し、非効率を軽減するために、精密な電力測定システムへの需要が高まっています。さらに、送電網の安定性とエネルギー効率の改善を目的とした政府の規制強化が、パワーアナライザ市場を押し上げています。
| 市場範囲 | |
|---|---|
| 開始年 | 2024年 |
| 予測年 | 2025年~2034年 |
| 開始金額 | 6億1,730万米ドル |
| 予測金額 | 10億米ドル |
| CAGR | 5% |
自動車、ヘルスケア、通信の各分野では、電力品質と信頼性を維持することが重要であるため、これらのアナライザの需要が高まっています。さらに、再生可能エネルギーへの移行が進む中、パワーデバイスアナライザは、これらのシステムで使用されるエネルギーデバイスの監視と効率改善に不可欠な役割を果たしています。
市場は現在、定格1,000A未満のデバイスと定格1,000A超のデバイスに区分されています。1,000A未満のデバイスは2034年までに4.5%を超えるCAGRで成長すると予想されています。この成長の背景には、エネルギー効率への注目の高まりがあり、エネルギー基準への適合を確実にするための正確な電力試験への需要に拍車をかけています。さらに、電気自動車の普及台数の増加や、さまざまな産業用途でのパワーエレクトロニクスの使用の増加も、この市場を後押ししています。
この業界はまた、単相と三相のパワーデバイスアナライザで位相別にセグメント化されています。単相市場の2024年の市場規模は2億米ドル超で、主に自動車、再生可能エネルギー、コンシューマーエレクトロニクスなどの産業が需要を牽引しています。
米国では、2022年のパワーデバイスアナライザ市場規模は6,070万米ドルで、2024年には6,610万米ドルに拡大しました。風力、太陽光、エネルギー貯蔵システムなどのクリーンエネルギーソリューションへのシフトにより、最適な送電網の安定性と効率を確保するための精密な電力測定ツールの必要性が高まっているため、2034年には1億米ドルを超えると予想されます。
目次
第1章 調査手法と調査範囲
第2章 エグゼクティブサマリー
第3章 業界洞察
- 業界エコシステム分析
- 規制状況
- 業界への影響要因
- 成長促進要因
- 業界の潜在的リスク・課題
- 成長ポテンシャル分析
- ポーター分析
- PESTEL分析
第4章 競合情勢
- イントロダクション
- 戦略的展望
- イノベーションと持続可能性の展望
第5章 市場規模・予測:2021年~2034年・電流別
- 主要動向
- 1,000 A未満
- 1,000 A超
第6章 市場規模・予測:製品別、2021年~2034年
- 主要動向
- ACとDCの両方
- 交流
- 直流
第7章 市場規模・予測:フェーズ別、2021年~2034年
- 主要動向
- 単相
- 三相
第8章 市場規模・予測:用途別、2021年~2034年
- 主要動向
- 自動車
- コンシューマーエレクトロニクス
- エネルギー
- 通信
- ヘルスケア
- その他
第9章 市場規模・予測:地域別、2021年~2034年
- 主要動向
- 北米
- 米国
- カナダ
- メキシコ
- 欧州
- ドイツ
- フランス
- ロシア
- 英国
- イタリア
- スペイン
- オランダ
- オーストリア
- アジア太平洋
- 中国
- 日本
- 韓国
- インド
- オーストラリア
- ニュージーランド
- 中東・アフリカ
- サウジアラビア
- アラブ首長国連邦
- カタール
- エジプト
- 南アフリカ
- ナイジェリア
- ラテンアメリカ
- ブラジル
- アルゼンチン
第10章 企業プロファイル
- ADVANTEST CORPORATION
- Arbiter Systems
- B&K Precision Corporation
- Carlo Gavazzi
- Chroma ATE
- Circutor
- Delta Electronics
- Dewesoft
- DEWETRON
- Fluke Corporation
- HIOKI E.E. CORPORATION
- IWATSU ELECTRIC
- Keysight Technologies
- Magtrol
- NATIONAL INSTRUMENTS
- Rohde &Schwarz
- TEKTRONIX
- Texas Instruments
- Vitrek
- Yokogawa Test & Measurement Corporation
目次
The Global Power Device Analyzer Market reached USD 617.3 million in 2024 and is estimated to depict a CAGR of 5% from 2025 to 2034. As industries seek to optimize energy use and reduce wastage, the demand for advanced tools to analyze power systems is rising rapidly. This surge is particularly noticeable across various industrial sectors where energy efficiency and sustainability are becoming critical. The integration of renewable energy sources, such as solar and wind, into power systems is also driving the need for these devices. Alongside, government policies and investments in renewable energy infrastructure are playing a crucial role in pushing the adoption of power measurement systems.
There is a growing emphasis on maintaining grid stability, managing fluctuating power inputs, and enhancing system efficiency, all of which further support the expansion of the power device analyzer market. These tools are crucial in ensuring power devices are functioning optimally and meeting regulatory standards. Industries are increasingly adopting automation and electrification processes, which is creating a greater demand for precision power measurement systems to ensure reliable system performance and mitigate inefficiencies. Additionally, stricter government mandates aimed at improving grid stability and energy efficiency are boosting the market for power analyzers.
| Market Scope | |
|---|---|
| Start Year | 2024 |
| Forecast Year | 2025-2034 |
| Start Value | $617.3 Million |
| Forecast Value | $1 Billion |
| CAGR | 5% |
The automotive, healthcare, and telecommunications sectors are driving the demand for these analyzers, as maintaining power quality and reliability is critical in these industries. Moreover, as the transition to renewable energy sources continues, power device analyzers play an essential role in monitoring and improving the efficiency of energy devices used in these systems.
The market is currently segmented into devices rated <= 1,000 A and those rated > 1,000 A. The <= 1,000 A devices are expected to experience a CAGR of over 4.5% through 2034. This growth is attributed to the increasing focus on energy efficiency, which is spurring demand for accurate power testing to ensure compliance with energy norms. Moreover, the rise in electric vehicle adoption and the increasing use of power electronics in various industrial applications are also fueling this market.
The industry is also segmented by phase, with single-phase and three-phase power device analyzers. The single-phase market was valued at over USD 200 million in 2024, with its demand primarily driven by industries like automotive, renewable energy, and consumer electronics.
In the U.S., the market for power device analyzers was valued at USD 60.7 million in 2022, increasing to USD 66.1 million in 2024. By 2034, it is expected to exceed USD 100 million, as the shift to clean energy solutions like wind, solar, and energy storage systems intensifies the need for precise power measurement tools to ensure optimal grid stability and efficiency.
Table of Contents
Chapter 1 Methodology & Scope
- 1.1 Market scope & definitions
- 1.2 Market estimates & forecast parameters
- 1.3 Forecast calculation
- 1.4 Data sources
- 1.4.1 Primary
- 1.4.2 Secondary
- 1.4.2.1 Paid
- 1.4.2.2 Public
Chapter 2 Executive Summary
- 2.1 Industry synopsis, 2021 - 2034
Chapter 3 Industry Insights
- 3.1 Industry ecosystem analysis
- 3.2 Regulatory landscape
- 3.3 Industry impact forces
- 3.3.1 Growth drivers
- 3.3.2 Industry pitfalls & challenges
- 3.4 Growth potential analysis
- 3.5 Porter's analysis
- 3.5.1 Bargaining power of suppliers
- 3.5.2 Bargaining power of buyers
- 3.5.3 Threat of new entrants
- 3.5.4 Threat of substitutes
- 3.6 PESTEL analysis
Chapter 4 Competitive Landscape, 2024
- 4.1 Introduction
- 4.2 Strategic outlook
- 4.3 Innovation & sustainability landscape
Chapter 5 Market Size and Forecast, By Current, 2021 – 2034 (Units & USD Million)
- 5.1 Key trends
- 5.2 ≤ 1,000 A
- 5.3 > 1,000 A
Chapter 6 Market Size and Forecast, By Product, 2021 – 2034 (Units & USD Million)
- 6.1 Key trends
- 6.2 Both AC & DC
- 6.3 AC
- 6.4 DC
Chapter 7 Market Size and Forecast, By Phase, 2021 – 2034 (Units & USD Million)
- 7.1 Key trends
- 7.2 Single phase
- 7.3 Three phase
Chapter 8 Market Size and Forecast, By Application, 2021 – 2034 (Units & USD Million)
- 8.1 Key trends
- 8.2 Automotive
- 8.3 Consumer electronics
- 8.4 Energy
- 8.5 Telecom
- 8.6 Healthcare
- 8.7 Others
Chapter 9 Market Size and Forecast, By Region, 2021 – 2034 (Units & USD Million)
- 9.1 Key trends
- 9.2 North America
- 9.2.1 U.S.
- 9.2.2 Canada
- 9.2.3 Mexico
- 9.3 Europe
- 9.3.1 Germany
- 9.3.2 France
- 9.3.3 Russia
- 9.3.4 UK
- 9.3.5 Italy
- 9.3.6 Spain
- 9.3.7 Netherlands
- 9.3.8 Austria
- 9.4 Asia Pacific
- 9.4.1 China
- 9.4.2 Japan
- 9.4.3 South Korea
- 9.4.4 India
- 9.4.5 Australia
- 9.4.6 New Zealand
- 9.5 Middle East & Africa
- 9.5.1 Saudi Arabia
- 9.5.2 UAE
- 9.5.3 Qatar
- 9.5.4 Egypt
- 9.5.5 South Africa
- 9.5.6 Nigeria
- 9.6 Latin America
- 9.6.1 Brazil
- 9.6.2 Argentina
Chapter 10 Company Profiles
- 10.1 ADVANTEST CORPORATION
- 10.2 Arbiter Systems
- 10.3 B&K Precision Corporation
- 10.4 Carlo Gavazzi
- 10.5 Chroma ATE
- 10.6 Circutor
- 10.7 Delta Electronics
- 10.8 Dewesoft
- 10.9 DEWETRON
- 10.10 Fluke Corporation
- 10.11 HIOKI E.E. CORPORATION
- 10.12 IWATSU ELECTRIC
- 10.13 Keysight Technologies
- 10.14 Magtrol
- 10.15 NATIONAL INSTRUMENTS
- 10.16 Rohde & Schwarz
- 10.17 TEKTRONIX
- 10.18 Texas Instruments
- 10.19 Vitrek
- 10.20 Yokogawa Test & Measurement Corporation
- 発行日
- 発行
- Global Market Insights Inc.
- ページ情報
- 英文 125 Pages
- 納期
- 2~3営業日


