
|
市場調査レポート
商品コード
1716496
水力発電タービン市場の機会、成長促進要因、産業動向分析、2025年~2034年の予測Hydropower Turbine Market Opportunity, Growth Drivers, Industry Trend Analysis, and Forecast 2025 - 2034 |
||||||
カスタマイズ可能
|
|||||||
| 水力発電タービン市場の機会、成長促進要因、産業動向分析、2025年~2034年の予測 |
|
出版日: 2025年03月24日
発行: Global Market Insights Inc.
ページ情報: 英文 105 Pages
納期: 2~3営業日
|

全表示
- 概要
- 目次
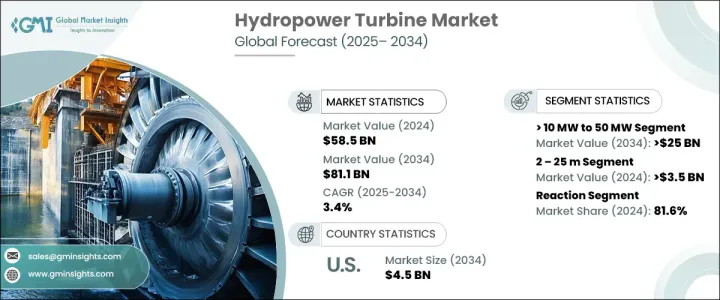
世界の水力発電タービン市場は、2024年に585億米ドルを生み出し、2025年から2034年にかけてCAGR 3.4%で成長すると予測されています。
信頼性が高く持続可能な電力源に対する世界の需要の高まりが、この拡大に拍車をかけています。水力発電は、クリーンなエネルギーを大規模に発電できることで知られ、発展途上国と先進国の双方で高まる電力需要を満たすための好ましいソリューションになりつつあります。二酸化炭素排出量の削減が重視されるようになり、再生可能エネルギーの導入を促進する政府の政策も相まって、市場はさらに拡大しています。水力発電は比類のない信頼性と柔軟性を提供するため、風力や太陽エネルギーのような他の再生可能エネルギーを補完する理想的なエネルギー源となっています。
さらに、タービン技術の進歩により、運転効率が大幅に向上し、メンテナンスコストが削減され、水力発電プロジェクトの全体的な持続可能性が高まっています。これは、老朽化したインフラの近代化とともに、市場を前進させています。政府や民間団体は、環境への影響を最小限に抑えつつ、増大するエネルギー需要を満たすために、水力発電所の改良に多額の投資を行っています。農村部や非電化地域での小型・小規模水力発電システムの採用増加も市場成長に寄与しており、従来の電力網へのアクセスが限られた地域で分散型電力ソリューションを提供しています。
| 市場範囲 | |
|---|---|
| 開始年 | 2024 |
| 予測年 | 2025-2034 |
| 開始金額 | 585億米ドル |
| 予測金額 | 811億米ドル |
| CAGR | 3.4% |
市場はタービン容量で区分され、1 MW以下、1 MW~ 10 MW、10 MW~ 50 MW、50 MW超が主要カテゴリーです。10 MW~ 50 MWのセグメントは、2034年までに250億米ドルを生み出すと予想されています。これらのタービンは、大規模な出力が得られるため、人口密度の高い都市部や工業地帯での需要の高い用途に最適です。さまざまな負荷条件下で送電網を安定化させ、安定した電力を供給することで、大規模なエネルギー需要を満たすのに不可欠な存在となっています。この分野は、電力会社や政府が送電網の信頼性を高め、産業拡大を支援することに注力しているため、力強い成長を遂げています。
もう一つの主要セグメントは、タービンのタイプに基づくもので、インパルス・タービンとリアクション・タービンに分類されます。2024年には、反応タービン・セグメントが市場シェアの81.6%を占めました。反応タービンは、特に水流量が変動する地域における中規模から大規模のプロジェクトで高い効率を発揮します。環境に優しい設計により、生態系への影響を最小限に抑え、持続可能なエネルギー生成をサポートします。政府と公共事業が、旧式で効率の低いタービンを先進的なモデルに置き換えようとしているため、反動水車の需要は拡大する見込みです。より高い水圧に対応し、さまざまな運転条件に適応できる反動水車は、水力発電開発者にとって好ましい選択肢です。
米国の水力発電タービン市場は、2024年に44億米ドルと評価されました。同国では、分散型エネルギー資源と小規模・零細水力発電プロジェクトの開発にますます注目が集まっています。再生可能エネルギーインフラの拡大と河川外水力発電プロジェクトの促進を目的とした政府の優遇措置が、この成長を後押ししています。さらに、官民間の協力的な取り組みが技術革新を促進し、水力発電システムの展開を強化しています。こうした取り組みにより、米国は水力発電技術を発展させる重要なプレーヤーとして位置づけられ、世界市場に大きく貢献しています。
目次
第1章 調査手法と調査範囲
第2章 エグゼクティブサマリー
第3章 業界洞察
- エコシステム分析
- 規制状況
- 業界への影響要因
- 促進要因
- 業界の潜在的リスク&課題
- 成長ポテンシャル分析
- ポーター分析
- PESTEL分析
第4章 競合情勢
- イントロダクション
- 戦略的展望
- イノベーションと持続可能性の展望
第5章 市場規模・予測:容量別、2021年~2034年
- 主要動向
- 1 MW以下
- 1 MW~ 10 MW
- 10 MW~ 50 MW
- 50 MW超
第6章 市場規模・予測:ヘッド別、2021年~2034年
- 主要動向
- 2-25 m
- 25-70 m
- 70 m超
第7章 市場規模・予測:製品別、2021年~2034年
- 主要動向
- インパルス
- リアクション
第8章 市場規模・予測:地域別、2021年~2034年
- 主要動向
- 北米
- 米国
- カナダ
- メキシコ
- 欧州
- フランス
- オーストリア
- ノルウェー
- ロシア
- イタリア
- スイス
- トルコ
- スウェーデン
- アジア太平洋
- 中国
- インド
- ベトナム
- ブータン
- インドネシア
- ネパール
- スリランカ
- 中東・アフリカ
- エチオピア
- イラン
- イスラエル
- ナイジェリア
- ザンビア
- ラテンアメリカ
- ブラジル
- ペルー
- アルゼンチン
第9章 企業プロファイル
- ANDRITZ
- B fouress
- Dobriyal Brothers
- GE Vernova
- Gilkes
- GUGLER Water Turbines
- Jyoti
- Litostroj Power
- Mitsubishi Heavy Industries
- Natel Energy
- Pentaflo Hydro
- Siemens Energy
- Toshiba
- Turbiwatt
- Voith
The Global Hydropower Turbine Market generated USD 58.5 billion in 2024 and is projected to grow at a CAGR of 3.4% between 2025 and 2034. The growing global demand for reliable and sustainable electricity sources is fueling this expansion. Hydropower, known for its ability to generate clean energy on a large scale, is becoming a preferred solution to meet the rising electricity needs of both developing and developed nations. The increasing emphasis on reducing carbon emissions, coupled with government policies promoting renewable energy adoption, is further strengthening the market. Hydropower offers unparalleled reliability and flexibility, making it an ideal complement to other renewable sources like wind and solar energy.
Additionally, advancements in turbine technology are significantly improving operational efficiency, reducing maintenance costs, and enhancing the overall sustainability of hydropower projects. This, along with the modernization of aging infrastructure, is propelling the market forward. Governments and private entities are investing heavily in upgrading hydropower plants to meet growing energy demands while ensuring minimal environmental impact. The increasing adoption of small and micro hydropower systems in rural and off-grid regions is also contributing to market growth, offering decentralized power solutions in areas with limited access to traditional power grids.
| Market Scope | |
|---|---|
| Start Year | 2024 |
| Forecast Year | 2025-2034 |
| Start Value | $58.5 Billion |
| Forecast Value | $81.1 Billion |
| CAGR | 3.4% |
The market is segmented based on turbine capacity, with key categories including <= 1 MW, > 1 MW to 10 MW, > 10 MW to 50 MW, and > 50 MW. The > 10 MW to 50 MW segment is expected to generate USD 25 billion by 2034. These turbines are preferred for their ability to provide large-scale power output, making them ideal for high-demand applications in densely populated urban areas and industrial zones. Their role in grid stabilization and consistent power delivery under varying load conditions makes them indispensable for meeting large-scale energy requirements. This segment is experiencing strong growth as utilities and governments focus on enhancing grid reliability and supporting industrial expansion.
Another key segment is based on turbine type, categorized into impulse and reaction turbines. In 2024, the reaction turbine segment accounted for 81.6% of the market share. Reaction turbines are highly efficient for medium to large-scale projects, especially in regions with variable water flow rates. Their eco-friendly design minimizes ecological disruption and supports sustainable energy generation. As governments and utilities seek to replace older, less efficient turbines with advanced models, the demand for reaction turbines is poised to grow. Their ability to handle higher water pressures and adapt to different operating conditions makes them a preferred choice for hydropower developers.
The U.S. Hydropower Turbine Market was valued at USD 4.4 billion in 2024. The country is witnessing an increasing focus on distributed energy resources and the development of small and micro hydropower projects. Government incentives aimed at expanding renewable energy infrastructure and promoting off-river hydropower projects are driving this growth. Additionally, collaborative efforts between public and private sectors are fostering technological innovation and enhancing the deployment of hydropower systems. These initiatives are positioning the U.S. as a key player in advancing hydropower technology and contributing significantly to the global market.
Table of Contents
Chapter 1 Methodology & Scope
- 1.1 Market scope & definitions
- 1.2 Market estimates & forecast parameters
- 1.3 Forecast calculation
- 1.4 Data sources
- 1.4.1 Primary
- 1.4.2 Secondary
- 1.4.2.1 Paid
- 1.4.2.2 Public
Chapter 2 Executive Summary
- 2.1 Industry synopsis, 2021 - 2034
Chapter 3 Industry Insights
- 3.1 Industry ecosystem analysis
- 3.2 Regulatory landscape
- 3.3 Industry impact forces
- 3.3.1 Growth drivers
- 3.3.2 Industry pitfalls & challenges
- 3.4 Growth potential analysis
- 3.5 Porter's analysis
- 3.5.1 Bargaining power of suppliers
- 3.5.2 Bargaining power of buyers
- 3.5.3 Threat of new entrants
- 3.5.4 Threat of substitutes
- 3.6 PESTEL analysis
Chapter 4 Competitive Landscape, 2024
- 4.1 Introduction
- 4.2 Strategic outlook
- 4.3 Innovation & sustainability landscape
Chapter 5 Market Size and Forecast, By Capacity, 2021 - 2034 (MW & USD Million)
- 5.1 Key trends
- 5.2 ≤ 1 MW
- 5.3 > 1 MW to 10 MW
- 5.4 > 10 MW to 50 MW
- 5.5 > 50 MW
Chapter 6 Market Size and Forecast, By Head, 2021 - 2034 (MW & USD Million)
- 6.1 Key trends
- 6.2 2 – 25 m
- 6.3 > 25 – 70 m
- 6.4 > 70 m
Chapter 7 Market Size and Forecast, By Product, 2021 - 2034 (MW & USD Million)
- 7.1 Key trends
- 7.2 Impulse
- 7.3 Reaction
Chapter 8 Market Size and Forecast, By Region, 2021 - 2034 (MW & USD Million)
- 8.1 Key trends
- 8.2 North America
- 8.2.1 U.S.
- 8.2.2 Canada
- 8.2.3 Mexico
- 8.3 Europe
- 8.3.1 France
- 8.3.2 Austria
- 8.3.3 Norway
- 8.3.4 Russia
- 8.3.5 Italy
- 8.3.6 Switzerland
- 8.3.7 Turkey
- 8.3.8 Sweden
- 8.4 Asia Pacific
- 8.4.1 China
- 8.4.2 India
- 8.4.3 Vietnam
- 8.4.4 Bhutan
- 8.4.5 Indonesia
- 8.4.6 Nepal
- 8.4.7 Sri Lanka
- 8.5 Middle East & Africa
- 8.5.1 Ethiopia
- 8.5.2 Iran
- 8.5.3 Israel
- 8.5.4 Nigeria
- 8.5.5 Zambia
- 8.6 Latin America
- 8.6.1 Brazil
- 8.6.2 Peru
- 8.6.3 Argentina
Chapter 9 Company Profiles
- 9.1 ANDRITZ
- 9.2 B fouress
- 9.3 Dobriyal Brothers
- 9.4 GE Vernova
- 9.5 Gilkes
- 9.6 GUGLER Water Turbines
- 9.7 Jyoti
- 9.8 Litostroj Power
- 9.9 Mitsubishi Heavy Industries
- 9.10 Natel Energy
- 9.11 Pentaflo Hydro
- 9.12 Siemens Energy
- 9.13 Toshiba
- 9.14 Turbiwatt
- 9.15 Voith

