
|
市場調査レポート
商品コード
1708236
自律走行バスソフトウェア市場の機会、成長促進要因、産業動向分析、2025年~2034年の予測Autonomous Bus Software Market Opportunity, Growth Drivers, Industry Trend Analysis, and Forecast 2025 - 2034 |
||||||
カスタマイズ可能
|
|||||||
| 自律走行バスソフトウェア市場の機会、成長促進要因、産業動向分析、2025年~2034年の予測 |
|
出版日: 2025年03月31日
発行: Global Market Insights Inc.
ページ情報: 英文 139 Pages
納期: 2~3営業日
|

全表示
- 概要
- 目次
自律走行バスソフトウェアの世界市場は、2024年に8億5,510万米ドルと評価され、2025年から2034年にかけて24.2%のCAGRが予想され、大幅な成長を示すと予測されています。
この堅調な市場拡大は、主にシェアードモビリティとオンデマンド交通サービスへの需要の急増によってもたらされます。消費者が柔軟で費用対効果の高い旅行ソリューションを求める傾向が強まるなか、自律走行バスが完璧な対応策として浮上しています。これらのバスは、固定経路に依存する従来の公共交通システムとは異なり、経路を調整することで乗客の需要の変化に適応します。この適応性により、乗客はより便利で手頃な交通手段を確実に利用できるようになり、自律走行バスは都市移動の理想的な選択肢として位置づけられます。
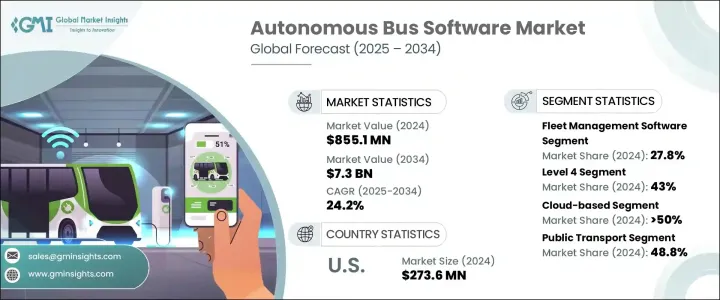
自律走行バスソフトウェアの市場は、車両管理、自律走行、交通管理、乗客管理、安全・セキュリティ、バス路線設計などの機能に基づいて分類されます。2024年には、車両管理ソフトウェア・セグメントが27.8%の市場シェアを占めました。このソフトウェアは、自動運転バスの運行効率を高める上で不可欠です。リアルタイムの遠隔監視、IoTベースのメンテナンス予測、燃料消費追跡、ルート最適化を通じて、車両管理システムはバス事業者の生産性向上、ダウンタイムの最小化、円滑な運行を可能にします。
| 市場範囲 | |
|---|---|
| 開始年 | 2024 |
| 予測年 | 2025-2034 |
| 開始金額 | 8億5,510万米ドル |
| 予測金額 | 73億米ドル |
| CAGR | 24.2% |
さらに、自律走行バスソフトウェア市場は、自動化レベル、レベル3、レベル4、レベル5で区分されます。レベル4の自律走行バスは、2024年の市場シェアの43%を占めています。これらのバスは、ビジネス街やスマートシティなど、あらかじめ定義されたエリア内で完全に自律走行します。高度な人工知能(AI)、機械学習、予測分析を活用して、さまざまな道路状況や交通パターンをナビゲートするため、都市環境に非常に適しています。AI技術の継続的な改良により、レベル4自律走行バスの採用は、特に人口密度の高い大都市圏で急増すると予想されます。
北米の自律走行バスソフトウェア市場は、2024年に世界市場シェアの38%を占めました。同地域の自律走行技術への投資は、政府の支援政策と相まって、自動運転バスの開発と配備を加速させています。すでにいくつかの都市がパイロット・プロジェクトを開始し、有望な成果を上げており、自律走行バス・システムの普及に弾みがつくと期待されています。こうしたバスが公共交通機関への統合を進めるにつれ、排出ガスの削減、交通渋滞の緩和、都市モビリティの全体的な効率向上が期待され、より持続可能でスマートな交通システムを目指す広範な動向と一致することになります。
目次
第1章 調査手法と調査範囲
第2章 エグゼクティブサマリー
第3章 業界洞察
- エコシステム分析
- サプライヤーの状況
- OEM
- ソフトウェアプロバイダー
- クラウドサービスプロバイダー
- システムインテグレーター
- 最終用途
- 利益率分析
- テクノロジーとイノベーションの展望
- 特許分析
- 主要ニュースとイニシアチブ
- 規制状況
- 影響要因
- 促進要因
- 共有モビリティとオンデマンド交通に対する需要の高まり
- 安全性と交通管理の向上
- 一般市民の意識と受容の高まり
- 自律走行車への関心の高まり
- 業界の潜在的リスク&課題
- 規制と法的課題
- 高い開発・運用コスト
- 促進要因
- 成長可能性分析
- ポーター分析
- PESTEL分析
第4章 競合情勢
- イントロダクション
- 企業シェア分析
- 競合のポジショニング・マトリックス
- 戦略展望マトリックス
第5章 市場推計・予測:機能別、2021年~2034年
- 主要動向
- フリート管理ソフトウェア
- 自律走行
- 交通管理
- 乗客管理
- 安全とセキュリティ
- バス路線設計
第6章 市場推計・予測:自動化レベル別、2021年~2034年
- 主要動向
- レベル3
- レベル4
- レベル5
第7章 市場推計・予測:展開モデル別、2021年~2034年
- 主要動向
- オンプレミス
- クラウドベース
- ハイブリッド
第8章 市場推計・予測:用途別、2021年~2034年
- 主要動向
- 公共交通機関
- キャンパス・企業シャトル
- 空港シャトル
- その他
第9章 市場推計・予測:最終用途別、2021年~2034年
- 主要動向
- 公共交通機関
- 民間輸送事業者
- 企業フリート
第10章 市場推計・予測:地域別、2021年~2034年
- 主要動向
- 北米
- 米国
- カナダ
- 欧州
- 英国
- ドイツ
- フランス
- スペイン
- イタリア
- ロシア
- 北欧
- アジア太平洋
- 中国
- インド
- 日本
- 韓国
- ニュージーランド
- 東南アジア
- ラテンアメリカ
- ブラジル
- メキシコ
- アルゼンチン
- 中東・アフリカ
- UAE
- 南アフリカ
- サウジアラビア
第11章 企業プロファイル
- Aurora
- Baidu Apollo
- EasyMile
- Imagry
- ioki
- Karsan
- LILEE Systems
- May Mobility
- Mobileye
- Navya
- NVIDIA
- Oxa
- T-Hive
- Via Transportation
- Volvo Bus
The Global Autonomous Bus Software Market was valued at USD 855.1 million in 2024 and is projected to witness substantial growth, with an expected CAGR of 24.2% from 2025 to 2034. This robust market expansion is primarily driven by the surging demand for shared mobility and on-demand transportation services. As consumers increasingly seek flexible, cost-effective travel solutions, autonomous buses emerge as a perfect response. These buses adapt to shifting passenger demands by adjusting routes, unlike traditional public transit systems that rely on fixed paths. This adaptability ensures that passengers receive more convenient and affordable transportation options, positioning autonomous buses as an ideal choice for urban mobility.
The market for autonomous bus software is categorized based on functionality, which includes fleet management, autonomous driving, traffic management, passenger management, safety and security, and bus route design. In 2024, the fleet management software segment accounted for a 27.8% market share. This software is essential in enhancing the operational efficiency of self-driving buses. Through real-time remote monitoring, IoT-based maintenance forecasting, fuel consumption tracking, and route optimization, fleet management systems enable bus operators to boost productivity, minimize downtime, and ensure smoother operations.
| Market Scope | |
|---|---|
| Start Year | 2024 |
| Forecast Year | 2025-2034 |
| Start Value | $855.1 Million |
| Forecast Value | $7.3 Billion |
| CAGR | 24.2% |
Further, the autonomous bus software market is segmented by automation levels-Level 3, Level 4, and Level 5 automation. The Level 4 autonomous buses held 43% of the market share in 2024. These buses are fully autonomous within predefined areas, such as business districts or smart cities. They leverage advanced artificial intelligence (AI), machine learning, and predictive analytics to navigate through varying road conditions and traffic patterns, making them highly suitable for urban environments. With the continued refinement of AI technologies, the adoption of Level 4 autonomous buses is expected to surge, especially in densely populated metropolitan areas.
North America Autonomous Bus Software Market accounted for 38% of the global market share in 2024. The region's investments in autonomous technology, coupled with supportive government policies, are accelerating the development and deployment of self-driving buses. Several cities are already launching pilot projects with promising results, which are expected to fuel the wider adoption of autonomous bus systems. As these buses become more integrated into public transportation, they offer the potential to reduce emissions, alleviate traffic congestion, and improve overall efficiency in urban mobility, aligning with the broader trend toward more sustainable, smart transportation systems.
Table of Contents
Chapter 1 Methodology & Scope
- 1.1 Research design
- 1.1.1 Research approach
- 1.1.2 Data collection methods
- 1.2 Base estimates and calculations
- 1.2.1 Base year calculation
- 1.2.2 Key trends for market estimates
- 1.3 Forecast model
- 1.4 Primary research & validation
- 1.4.1 Primary sources
- 1.4.2 Data mining sources
- 1.5 Market definitions
Chapter 2 Executive Summary
- 2.1 Industry 360º synopsis, 2021 - 2034
Chapter 3 Industry Insights
- 3.1 Industry ecosystem analysis
- 3.2 Supplier landscape
- 3.2.1 OEM
- 3.2.2 Software provider
- 3.2.3 Cloud service providers
- 3.2.4 System integrators
- 3.2.5 End Use
- 3.3 Profit margin analysis
- 3.4 Technology & innovation landscape
- 3.5 Patent analysis
- 3.6 Key news & initiatives
- 3.7 Regulatory landscape
- 3.8 Impact forces
- 3.8.1 Growth drivers
- 3.8.1.1 Rising demand for shared mobility and on-demand transport
- 3.8.1.2 Improved safety and traffic management
- 3.8.1.3 Growing public awareness and acceptance
- 3.8.1.4 Rising interest in autonomous vehicles
- 3.8.2 Industry pitfalls & challenges
- 3.8.2.1 Regulatory and legal challenges
- 3.8.2.2 High development and operational costs
- 3.8.1 Growth drivers
- 3.9 Growth potential analysis
- 3.10 Porter's analysis
- 3.11 PESTEL analysis
Chapter 4 Competitive Landscape, 2024
- 4.1 Introduction
- 4.2 Company market share analysis
- 4.3 Competitive positioning matrix
- 4.4 Strategic outlook matrix
Chapter 5 Market Estimates & Forecast, By Functionality, 2021 - 2034 ($Bn)
- 5.1 Key trends
- 5.2 Fleet management software
- 5.3 Autonomous driving
- 5.4 Traffic management
- 5.5 Passenger management
- 5.6 Safety & security
- 5.7 Bus route design
Chapter 6 Market Estimates & Forecast, By Level of Automation, 2021 - 2034 ($Bn)
- 6.1 Key trends
- 6.2 Level 3
- 6.3 Level 4
- 6.4 Level 5
Chapter 7 Market Estimates & Forecast, By Deployment Model, 2021 - 2034 ($Bn)
- 7.1 Key trends
- 7.2 On-premises
- 7.3 Cloud-based
- 7.4 Hybrid
Chapter 8 Market Estimates & Forecast, By Application, 2021 - 2034 ($Bn)
- 8.1 Key trends
- 8.2 Public transport
- 8.3 Campus and corporate shuttles
- 8.4 Airport shuttles
- 8.5 Others
Chapter 9 Market Estimates & Forecast, By End Use, 2021 - 2034 ($Bn)
- 9.1 Key trends
- 9.2 Public transportation authorities
- 9.3 Private transport operators
- 9.4 Corporate fleets
Chapter 10 Market Estimates & Forecast, By Region, 2021 - 2034 ($Bn)
- 10.1 Key trends
- 10.2 North America
- 10.2.1 U.S.
- 10.2.2 Canada
- 10.3 Europe
- 10.3.1 UK
- 10.3.2 Germany
- 10.3.3 France
- 10.3.4 Spain
- 10.3.5 Italy
- 10.3.6 Russia
- 10.3.7 Nordics
- 10.4 Asia Pacific
- 10.4.1 China
- 10.4.2 India
- 10.4.3 Japan
- 10.4.4 South Korea
- 10.4.5 ANZ
- 10.4.6 Southeast Asia
- 10.5 Latin America
- 10.5.1 Brazil
- 10.5.2 Mexico
- 10.5.3 Argentina
- 10.6 MEA
- 10.6.1 UAE
- 10.6.2 South Africa
- 10.6.3 Saudi Arabia
Chapter 11 Company Profiles
- 11.1 Aurora
- 11.2 Baidu Apollo
- 11.3 EasyMile
- 11.4 Imagry
- 11.5 ioki
- 11.6 Karsan
- 11.7 LILEE Systems
- 11.8 May Mobility
- 11.9 Mobileye
- 11.10 Navya
- 11.11 NVIDIA
- 11.12 Oxa
- 11.13 T-Hive
- 11.14 Via Transportation
- 11.15 Volvo Bus

